MACD + Supertrend + DEMA StrategySTRATEGY 📊 STRATEGY LOGIC:
Long Entry: When ALL of these occur simultaneously:
MACD histogram crosses above 0
Supertrend is bullish (green)
Short DEMA > Long DEMA
Short Entry: When ALL of these occur simultaneously:
MACD histogram crosses below 0
Supertrend is bearish (red)
Short DEMA < Long DEMA
Exits: Based on your TP/SL percentages from entry price
This follows the same clean structure as your MACD strategy but adds the alignment concept and proper risk management!
Cerca negli script per "tp"

Dammu AI PROType & Purpose
Multi-functional trend, swing, and smart money concept indicator.
Combines SuperTrend, SMA, ATR-based risk management, swing structures, order blocks, EQH/EQL, and Fair Value Gaps (FVG).
Designed for identifying trends, entries/exits, and support/resistance zones.
2. Trend Detection
SuperTrend with ATR smoothing (nsensitivity*7 factor) for buy/sell signals.
SMA filter (8 & 9 periods) confirms trend strength.
Bar color changes:
Green if close > supertrend.
Red if close < supertrend.
Cirrus Cloud highlights trend zones with semi-transparent colors.
3. Swing & Structure
Detects pivot highs/lows and labels them as HH/LH (Highs), HL/LL (Lows).
Generates BOS (Break of Structure) and CHoCH (Change of Character) signals.
Internal swing structures and order blocks for short-term intraday moves.
4. Order Blocks
Internal Order Blocks (iOBs) and Swing Order Blocks (OBs).
Boxes drawn for bullish/bearish zones.
Auto-delete when broken.
Option to filter blocks by ATR or Cumulative Mean Range.
5. Risk Management
TP/SL levels based on ATR and user-defined % risk.
Shows lines and labels for:
Entry
Stop Loss
TP1, TP2, TP3
Adjustable line style (solid/dashed/dotted).
6. Fair Value Gaps (FVG)
Highlights bullish and bearish gaps.
Option for auto-threshold filtering.
Extendable FVG boxes.
7. EQH/EQL
Detects Equal Highs (EQH) and Equal Lows (EQL) for potential reversals.
Dotted lines with labels.
8. Smart Money Concepts (SMC) Features
Shows:
Swings (internal & swing structure)
Internal order blocks
Premium/Discount zones
Fair Value Gaps
Highs/Lows from previous day/week/month
Configurable for historical vs present display.
9. Alerts
Buy/Sell triggers:
bull = crossover of close above SuperTrend.
bear = crossunder of close below SuperTrend.
Alerts for BOS/CHoCH, EQH/EQL, and OB breaks.
10. Visualization
Trend clouds, colored bars, SMA markers, SuperTrend labels.
Multi-layered info displayed without cluttering the chart.
Customizable colors, line styles, and transparency.
✅ Summary:
This indicator is a comprehensive trading tool for trend detection, swing structure, order block analysis, and risk management. It’s built for smart money and SMC-based trading, offering visual cues and alerts for key trading decisions.

nadia
Gold ramon strategy based on 50 candles and atr of 12
You enter the maximum of 50 candles once the most bearish starts to rise, we expect 10 candles, if you don't go up in 10 candles, you don't enter, if you go up before 10 candles, you enter.
When is TP? Enough with 5 candles
The temporality is 1 hour. It can be adjusted to 1 minute temporality for scalping.
It is never lost, because it always exceeds the previous maximums.

ES cuhthis strategy uses laggard rsi to compute the best parameters to go long and tp at key levels. the overall trend strength within the rsi laggard indicator is what is used to automate the calculations within the script. enjoy and paramter optimize

Solana 4H RSI->MACD — Counter-Trend By TetradTetrad RSI→RSI Cross→MACD (Sequenced) — Counter-Trend (SL-Only)
Category: Market-neutral, counter-trend, sequenced entries
Timeframe default: Works on any TF; designed around 4H On Solana
Markets: Any (spot, perp, futures); parameterize to your asset
What it does
This strategy hunts reversals using a 3-step sequence on RSI and MACD, then optionally restricts entries by market regime and a price gate. It shows stop-loss lines only when hit (clean chart), and paints a Donchian glow for quick read of backdrop conditions.
Entry logic (sequenced)
1. RSI Extreme:
Long path activates when RSI < Oversold (default 27.5).
Short path activates when RSI > Overbought (default 74).
2. RSI Cross confirmation:
Long path: RSI crosses up back above the oversold level.
Short path: RSI crosses down back below the overbought level.
Each step has a max bar lookback so stale signals time out.
3. MACD Cross trigger:
Long: MACD line crosses above Signal.
Short: MACD line crosses below Signal.
→ When step 3 fires and gates are satisfied, a trade is entered.
Optional gates & filters
Regime Filter (Counter-Trend):
Longs allowed in **Range / Short Trend / Short Parabolic** regimes.
Shorts allowed in **Range / Long Trend / Long Parabolic** regimes.
Based on ADX/DI and ATR% intensity.
* Price Gate (Long Ceiling):
Toggle to **disable new longs above a chosen price (default 209.0 For SOL).
Useful for assets like SOL where you want longs only below a cap.
Exits / Risk
* Stop-Loss (% of entry):** default **14%**, toggleable.
* SL visualization:** plots a **thin dashed red line only on the bar it’s hit**.
* (No take-profit or time-based exit in this version—keep it pure to the sequence and regime. Add TP/time exits if desired.)
Visuals
* Donchian Glow (50): background band only (upper/lower lines hidden).
* Regime HUD: compact table (top-right) highlighting the active regime.
* Minimal marks: no entry/exit “arms” clutter; only SL-hit lines render.
Inputs (key)
* Core: RSI Length, Oversold/Overbought, MACD Fast/Slow/Signal.
* Sequence: Max bars from Extreme→RSI Cross and RSI Cross→MACD Cross.
* Regime: ADX Length, Trend/Parabolic thresholds, ATR length & floor.
* Stops: Enable/disable; SL %.
* Price Gate: Enable; Long ceiling price.
Alerts
Sequenced Long (CT): RSIhigh → RSI cross down → MACD bear cross.
## Notes & Tips
Designed for counter-trend fades that become trend rides. The regime filter helps avoid fading true parabolics and aligns entries with safer contexts.
The sequence is stateful (steps must occur in order). If a step times out, the path resets.
Works on lower TFs, but the 4H baseline reduces noise and over-trading.
Consider pairing with volume or structure filters if you want fewer but higher-conviction entries.
Past performance ≠ future results. **Educational use only. Not financial advice.

Pump-Smart Shorting StrategyThis strategy is built to keep your portfolio hedged as much as possible while maximizing profitability. Shorts are opened after pumps cool off and on new highs (when safe), and closed quickly during strong upward moves or if stop loss/profit targets are hit. It uses visual overlays to clearly show when hedging is on, off, or blocked due to momentum, ensuring you’re protected in most market conditions but never short against the pump. Fast re-entry keeps the hedge active with minimal downtime.
Pump Detection:
RSI (Relative Strength Index): Calculated over a custom period (default 14 bars). If RSI rises above a threshold (default 70), the strategy considers the market to be in a pump (strong upward momentum).
Volume Spike: The current volume is compared to a 20-bar simple moving average of volume. If it exceeds the average by 1.5× and price increases at least 5% in one bar, pump conditions are triggered.
Price Jump: Measured by (close - close ) / close . A single-bar change > 5% helps confirm rapid momentum.
Pump Zone (No Short): If any of these conditions is true, an orange or red background is shown and shorts are blocked.
Cooldown and Re-Entry:
Cooldown Detection: After the pump ends, RSI must fall below a set value (default ≤ 60), and either volume returns towards average or price momentum is less than half the original spike (oneBarUp <= pctUp/2).
barsWait Parameter: You can specify a waiting period after cooldown before a short is allowed.
Short Entry After Pump/Cooldown: When these cooldown conditions are met, and no short is active, a blue background is shown and a short position is opened at the next signal.
New High Entry:
Lookback New High: If the current high is greater than the highest high in the last N bars (default 20), and pump is NOT active, a short can be opened.
Take Profit (TP) & Stop Loss (SL):
Take Profit: Short is closed if price falls to a threshold below the entry (minProfitPerc, default 2%).
Stop Loss: Short is closed if price rises to a threshold above the entry (stopLossPerc, default 6%).
Preemptive Exit:
Any time a pump is detected while a short position is open, the strategy closes the short immediately to avoid losses.
Visual Feedback:
Orange Background: Market is pumping, do not short.
Red Background: Other conditions block shorts (cooldown or waiting).
Blue Background: Shorts allowed.
Triangles/Circles: Mark entries, pump start/end, for clear trading signals.

Measured Pattern Move (Bulkowski) [SS]Hey everyone,
This is the Measured Pattern Move using Bulkowski's process for measured move calculation.
What the indicator does:
The indicator has the associated measured move across 20 of the most common and frequent Bulkowski patterns, including:
Double Bottom / Adam Eve Bottom
Double Top / Adam Eve Top
Inverse Head and Shoulders
Bear Flag
Bull Flag
Horn Bottom
Horon Top
Broadening Top
Descending Broadening Wedge
Broadening Bottoms
Broadening Tops
Cup and Handle
Inverted cup and handle
Diamond Bottom
Diamond Top
Falling Wedge
Rising Wedge
Pipe Bottom
Pipe Top
Head and Shoulders
It will calculate the measured move according to the Bulkowski process.
What is the Bulkowski Process?
Each move has an associated continuation percentage, which Bulkowski has studied, analyzed and concluded statistically.
For example, Double tops have a continuation percent of 54%. Bear flags, 47%. These are "constants" that are associated with the pattern.
Bulkowski applies them to the daily, but how I have formulated this, it can be used on all timeframes, and with the constant, it will correctly calculate the measured move of the pattern.
What this indicator DOES NOT DO
This indicator will not identify the pattern for you.
I tried this using Dynamic Time Warping (DTW) using my own pre-trained Bulkowski model in R. I was successfully able to get Pinescript to calculate DTW which was amazing! But applying it to all these patterns actually went over the execution time limit, which is understandable.
As such, you will need to identify the pattern yourself, then use this indicator to hilight the pattern and it will calculate the measured move based on the constant and the pattern range.
Let's look at some examples:
Use examples
Double bottom / adam eve bottom on SPY on the 1-Minute chart
Adam and Eve Double Bottom QQQ 1-Hour Chart
Adam Eve Double Bottom MSFT Daily Chart
Bearish Head and Shoulders Pattern MSFT Daily
You get the point.
How to use the indicator
To use the indicator, identify the pattern of interest to you.
Then, highlight the pattern using the indicator (it will ask you to select start time of the pattern and end time of the pattern). The indicator will then highlight the pattern and calculate the measured move, as seen in the examples above.
Best approaches
To make the most of the indicator, its best to draw out your pattern and wait for an actual break, the point of the break is usually the end of the pattern formation.
From here, you will then apply this indicator to calculate the expected up or down move.
Let me show you an example:
Here we see CME_MINI:ES1! has made an Adam bottom pattern. We know the Eve should be forming soon and it indeed does:
We mark the top of the pattern like so:
Then we use our Measured move indicator to calculate the measured move:
Measured move here for CME_MINI:ES1! is 6,510.
Now let's see....
Voila!
Selecting the Pattern
After you highlight the selected pattern, in the indicator settings, simply select the type of pattern it is, for example "head and shoulders" or "Broadening wedge", etc.
The indicator will then adjust its measurements to the appropriate constant and direction.
Concluding remarks
That is the indicator!
It is helpful for determining the actual projected move of a pattern on breakout.
Remember, it does not find the pattern for you , you are responsible for identifying the pattern. But this will calculate the actual TP of the pattern for you, without you having to do your own calculations.
I hope you find it useful, I actually use this indicator every day, especially on the lower timeframes!
And you will find, the more you use it, the better you get at recognizing significant patterns!
If you are not aware of these patterns, Bulkowski lists all of this information freely accessible on his website. I cannot link it here but you can just Google him and he has graciously made his information public and free!
That's it, I hope you enjoy and safe trades!
Disclaimer
This is not my intellectual property. The pattern calculations come from the work of Thomas Bulkowski and not myself. I simply coded this into an indicator using his publicly accessible information.
You can get more information from Bulkowski's official website about his work and patterns.

EA M1 Signals with Persistent ATR TP/SL1 Minute scalper for XAU/USD - uses multiple integrated indicators to provide signals upon a breakout and pullback

Daytrade Forex Scalper TwinPulse Auction Timer IndicatorWhat this indicator is
TwinPulse Auction Timer is a multi component execution aid designed for liquid markets. It looks for two families of opportunities
Breakouts that leave a compression area after a fresh sweep
Reversals that trigger after a sweep with strong wick polarity
It does not try to predict future prices. It measures present auction conditions with transparent rules and shows you when those conditions align. You get a simple table that says LONG SHORT or WAIT, optional session shading, clean entry and exit level visuals, and alerts you can wire to your workflow.
Why it is different
Most tools show a single signal. TwinPulse combines several independent signals into an Edge Score that you can tune. The components are
• Pulse. A signed measure of wick asymmetry with candle body direction
• Compression. Current true range compared with an average range
• Sweep timer. Bars elapsed since the most recent sweep of a prior high or low
• Bias. Direction of a higher timeframe candle
• Regime. Efficiency ratio and the relation of micro to macro volatility
• Location. Distance from the daily anchored VWAP
• Session. London and New York filter by time windows
Each component is visible in the inputs and in the table so you can understand why a suggestion appears. The script uses request.security() with lookahead off in all calls so it does not peek into the future. Shapes may move while a bar is open since price is still forming. They stop moving when the bar closes.
What you will see on the chart
• L and S shapes on entry bars
• An Exit shape at the price where a stop or the runner target would have been hit
• Four horizontal lines while a trade is active
Entry
Stop
TP1 at one R
TP2 at the runner target expressed in R
• Labels anchored to each line so you can instantly read Entry SL TP1 and TP2 with current values
• Optional shading during your session windows
• Optional daily VWAP line
The table in the top right shows
Action LONG SHORT IN LONG IN SHORT or WAIT
Session ON or OFF
Bias UP DOWN or FLAT
Pulse value
Compression value
Edge L percent and Edge S percent
How it works in detail
Pulse
For each bar the script measures up wick minus down wick divided by range and multiplies that by the sign of the candle body. The result is averaged with pulse_len. Positive numbers indicate aggressive buying. Negative numbers indicate aggressive selling. You control the minimum absolute value with pulse_thr.
Compression
Compression is the ratio of current range to an average range. You can choose the range basis. HL SMA uses simple high minus low smoothed by range_len. ATR uses classic True Range smoothed by atr_len. Values below comp_thr indicate a coil.
Sweeps and the timer
A sweep occurs when price trades beyond the highest high or lowest low seen in the previous sweep_len bars. A strict sweep requires a close back inside that prior range. The timer measures how many bars have elapsed since the last sweep. Breakout setups require the timer to exceed timer_thr.
Bias on a confirmation timeframe
A higher timeframe candle is read with confirm_tf. If close is above open bias is UP. If close is below open bias is DOWN. This keeps breakouts aligned with the prevailing drift.
Regime filters
Efficiency ratio measures the straight line change over the sum of absolute bar to bar changes over er_len. It rises in trendy conditions and falls in noise. Minimum efficiency is controlled by er_min.
Micro to macro volatility ratio compares a short lookback average range with a longer lookback average range using your chosen basis. For breakouts you usually want micro volatility to be near or above macro hence mvr_min. For reversals you often want micro volatility that is not overheated relative to macro hence mvr_max_rev.
VWAP distance gate
Daily anchored VWAP is rebuilt from the open of each session. The script computes the absolute distance from VWAP in units of your average range and requires that distance to exceed vwap_dist_thr when use_vwap_gate is true. This keeps entries away from the mean.
Edge Score
Each gate contributes a weight that you control. The script sums weights of the satisfied gates and divides by the sum of all weights to produce an Edge percent for long and an Edge percent for short. You can then require a minimum Edge percent using edge_min_pct. This turns the indicator into a step by step checklist that you can tune to your taste.
Using the indicator step by step
Choose markets and timeframes
The logic is designed for liquid instruments. Major currency pairs, index futures and cash index CFDs, and the most liquid crypto pairs work well. On intraday use one to fifteen minutes for signals and fifteen to sixty minutes for confirmation. On swing use one hour to one day for signals and one day for confirmation.
Decide on entry mode
Breakouts require a compression area and a sweep timer. Reversals require a strict sweep and a strong pulse. If you are unsure leave the default which allows both.
Pick a range basis
For FX and crypto HL SMA is often stable. For indices and single name equities with gaps ATR can adapt better. If results look too reactive increase the window. If results are too slow reduce it.
Tune regime filters
If you trade trend continuation raise er_min and mvr_min. If you trade counter rotation lower them and rely on the reversal path with the strict sweep condition.
Set the VWAP gate
Enabling it helps you avoid entries at the mean. Push the threshold higher on range bound days. Reduce it in strong trend days.
Table driven decision
Watch Action and the Edge percents. If the script says WAIT you can read Pulse and Compression to see what is missing. Often the best trades appear when both Edge percents are well separated and your session switch is ON.
Use the visuals
When a suggestion triggers you will see entry stop and targets. You can mirror the levels in your own workflow or use alerts.
Consider bar close
Signals are computed in real time. For a strict process you can wait until the bar closes to reduce noise.
Inputs explained with quick guidance
Setup
Signal TF chooses where the logic is computed. Leave blank to use the chart.
Confirm TF sets the higher timeframe for bias.
Session filter restricts signals to the London and New York windows you specify.
Invert flips long and short. It is useful on inverse instruments.
Logic options
Entry mode allows Breakouts Reversals or Both.
Average range basis selects HL SMA or ATR.
ATR length is used when ATR is selected.
Pulse source can be Regular OHLC or Heikin Ashi. Heikin Ashi smooths noisy series, but the script still runs on regular bars and you should publish and use it on standard candles to respect the platform guidance.
Core numeric settings
Sweep lookback controls the size of the liquidity pool targeted by the sweep condition.
Pulse window smooths the wick polarity measure.
Average range window controls your base range when you use HL SMA.
Pulse threshold sets the minimum polarity required.
Compression threshold sets the maximum current range relative to average to consider the market coiled.
Expansion timer bars sets how much time has passed since the last sweep before you allow a breakout.
Regime filters
Efficiency ratio length and minimum value keep you out of aimless drift.
Micro and Macro range lengths feed the micro to macro ratio.
Minimum micro to macro for breakouts and maximum micro to macro for reversals steer the two entry families.
VWAP gate and distance threshold keep you away from the mean.
Levels and trade management visuals
Runner target in R sets TP2 as a multiple of initial risk.
Stop distance as average range multiple sets initial risk size for the visuals.
Move stop to entry after one R touch turns on break even logic once price has traveled one risk unit.
Trail buffer as R fraction uses the last sweep as an anchor and keeps a dynamic stop at a chosen fraction of R beyond it.
Cooldown after exit prevents immediate re entries.
Edge Score
Weights for pulse compression timer bias efficiency ratio micro to macro VWAP gate and session let you align the checklist with your style.
Minimum Edge percent to suggest applies a final filter to LONG or SHORT suggestions.
UI
Table and markers switch the compact dashboard and the shapes.
TP and SL lines and labels draw and name each level.
TP1 partial label percent is printed in the TP1 label for clarity.
Session shading helps with focus.
Daily VWAP line is optional.
Alerts
The script provides alerts for Long Short Exit and for Edge percent crossing the threshold on either side. Use them to drive notifications or to sync with webhooks and your broker integration. Alerts trigger in real time and will repaint during a bar. For conservative use trigger on bar close.
Recommended presets
Intraday trend continuation
Confirm TF fifteen minutes
Entry mode Breakouts
Range basis HL SMA
Pulse threshold near 0.10
Compression threshold near 0.60
Timer around 18
Minimum efficiency ratio near 0.20
Minimum micro to macro near 1.00
VWAP gate enabled with distance near 0.35
Edge minimum 50 or higher
Intraday mean reversion at sweeps
Entry mode Reversals
Pulse source Regular OHLC
Compression threshold can be a little higher
Maximum micro to macro near 1.60
Efficiency ratio minimum lower near 0.12
VWAP gate enabled
Edge minimum 40 to 60
Swing trend continuation
Signal TF one hour
Confirm TF one day
Range basis ATR
ATR length around 14
Average range window 20 to 30
Efficiency ratio minimum near 0.18
Micro to macro windows 12 and 60
Edge minimum 50 to 70
These are starting points only. Your instrument and timeframe will require small adjustments.
Limitations and honest warnings
No indicator is perfect. TwinPulse will mark attractive conditions that do not always lead to profitable trades. During economic releases or very thin liquidity the assumptions behind compression and sweeps may fail. In strong gap environments the HL SMA basis may lag while ATR may overreact. Heikin Ashi pulse can help in choppy markets but it will lag during sharp reversals. Session times use the exchange time of your chart. If you switch symbol or exchange verify the windows.
Edge percent is not a probability of profit. It is the fraction of satisfied gates with your chosen weights. Two traders can set different weights and see different Edge readings on the same bar. That is the design. The score is a guide that helps you act with discipline.
This indicator does not place orders or manage real risk. The lines and labels show a model entry a model stop and two model targets built from the average range at entry and from recent swing points. Use them as references and not as hard rules. Always test on historical data and demo first. Past results do not guarantee anything in the future.
Credits and originality
All code in this publication is original and written for this indicator. The concept of the efficiency ratio originates from Perry Kaufman. The use of a daily anchored volume weighted average price is a standard industry tool. The specific combination of pulse from wick polarity strict sweep timing compression and the tunable Edge Score is unique to this script at the time of publication. If you reuse parts of the open source code in your own work remember to credit the author and contribute meaningful improvements.
How to read the table at a glance
Action reflects your current state.
IN LONG or IN SHORT appears while a trade is active.
LONG or SHORT appears when conditions for entry are met and the Edge threshold is satisfied.
WAIT appears when at least one gate is missing.
Session shows ON during your chosen windows.
Bias shows the color of the confirmation candle.
Pulse is the smoothed polarity number.
Comp shows current range divided by the average range. Values below one mean compression.
Edge L percent and Edge S percent show the long and short checklists as percents.
Final thoughts
Markets move because orders accumulate at certain prices and at certain times. The indicator tries to measure two things that often matter at those turning points. One is the existence of a hidden imbalance revealed by wick polarity and by sweeps of prior extremes. The other is the presence of energy stored in a coil that can release in the direction of a drift. Neither force guarantees profit. Together they can improve your selection and your timing.
Use the defaults for a few days so you learn the personality of the signals. After that adjust one group at a time. Start with the session filter and the Edge threshold. Then tune compression and the timer. Finally adjust the regime filters. Keep notes. You will learn which weights matter for your market and timeframe. The result is a process you can apply with consistency.
Disclaimer
This script and description are for education and analysis. They are not investment advice and they do not promise future results. Use at your own risk. Test thoroughly on historical data and in simulation before considering any live use.

Larry Williams - Smash Day (SL/TP in %)This strategy implements Larry Williams’ “Smash Day” reversal concept on any symbol and timeframe (daily is the classic). A Smash Day is a bar that closes beyond a recent extreme and then potentially reverses on the next session.

MNQ Morning Indicator | Clean SignalsMNQ Morning Trading Indicator Summary
What It Does
This is a TradingView indicator designed for day trading MNQ (Micro Nasdaq-100 futures) during morning sessions. It generates BUY and SELL signals only when multiple technical conditions align, helping traders identify high-probability trade setups.
Core Strategy
BUY Signal Requirements (All must be true):
✅ Price above VWAP (volume-weighted average price)
✅ Fast EMA (9) above Slow EMA (21) - uptrend confirmation
✅ Price above 15-minute 50 EMA - higher timeframe confirmation
✅ MACD histogram positive - momentum confirmation
✅ RSI above 55 - strength confirmation
✅ ADX above 25 - trending market (not choppy)
✅ Volume 1.5x above average - strong participation
SELL Signal (opposite conditions)
Key Features
🎯 Risk Management
Stop Loss: 2× ATR (Average True Range)
Take Profit 1: 2× ATR (1:2 risk-reward)
Take Profit 2: 3× ATR (1:3 risk-reward)
Dollar values: Calculates P&L based on MNQ's $2/point value
⏰ Session Filter
Default: 9:30 AM - 11:30 AM ET (customizable)
Safety feature: Avoids first 15 minutes (high volatility period)
Won't generate signals outside trading hours
🛡️ Signal Quality
Rates each signal: 🔥 STRONG, ⚡ MEDIUM, or ⚠️ WEAK
Requires minimum 15 bars between signals (prevents overtrading)
📊 Visual Dashboard
Shows real-time metrics:
ATR values
ADX (trend strength)
RSI (momentum)
Market condition (TREND/CHOP)
Session status
Volume status
Signal cooldown timer
Visual Elements
📈 VWAP with standard deviation bands (1σ, 2σ, 3σ)
📉 Multiple EMAs with trend-based coloring
🟢/🔴 Buy/Sell arrows on chart
📋 Detailed trade labels showing entry, SL, TPs, and risk-reward ratios
🎨 Background highlighting for market conditions
Safety Features
Cooldown period between signals
Session restrictions (no trading outside set hours)
First 15-minute avoidance (post-open volatility)
Multi-confirmation requirement (all 7 conditions must align)
Trend filter (ADX minimum to avoid choppy markets)
Best For
Day traders focused on morning sessions
MNQ futures traders
Traders who prefer systematic, rule-based entries
Those wanting pre-calculated risk management levels
Customization
All parameters are adjustable:
EMA periods
MACD settings
RSI thresholds
ADX minimum
ATR multipliers
Session times
Visual preferences
This indicator is designed to be conservative — it waits for strong confirmation before signaling, which means fewer but potentially higher-quality trades.

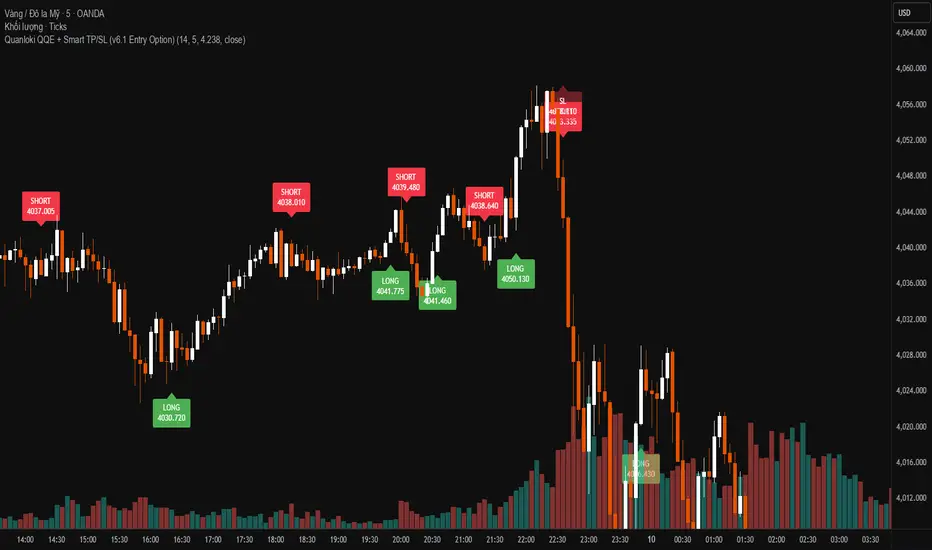
Quanloki QQE + Smart TP/SL (v6.1 Entry Option)Version v6.1 has more complete functions. You can choose open next to enter prices faster. For any information about orders or indicators, you can contact tele @Quanloki for instructions and refunds.
Risk-Reward Position SizerRisk-Reward Position Sizer – Features Checklist
Purpose:
A visual calculator and position sizing tool for day traders, providing realistic risk, stop-loss, take-profit, and reward-to-risk information based on account size and position constraints.
Features:
Flexible Risk Settings
Set risk as a percentage of your account or a fixed dollar amount per trade.
Automatically calculates position size based on desired risk and stop distance.
Stop Loss Options
Stop distance can be defined as a percent of entry price or a fixed price.
Automatically adjusts stop distance when position is cash-limited to achieve your target risk.
Take Profit Options
TP can be defined as a fixed R multiple (e.g., 2R) or fixed absolute price.
Cash-Limited Position Handling
Optional “Cap Position to Account Size” prevents buying more shares than your cash allows.
Shows actual achievable risk if your cash limits position size.
Realistic Risk / Reward Calculations
Calculates Actual Risk $ based on position size and stop distance.
Calculates Projected Win $ based on take profit and position size.
Calculates Actual Reward-to-Risk (R:R) ratio using actual stop and TP.
Position Metrics
Estimated quantity of shares/contracts to buy.
Estimated position value.
Estimated leverage used relative to account size.
Top-Right Table Display
Clear, compact table showing:
Account size
Target risk $
Actual risk $
Stop distance
Quantity
Position value
Take profit and stop-loss prices
Projected win $ and %
Projected loss %
Actual R:R
Leverage
Trading Decision Aid
Gives traders a realistic snapshot of achievable risk and reward before entering a trade.
Helps avoid the common trap of setting tight stops that don’t actually match desired account risk.
Why It’s Useful:
This indicator turns abstract risk/reward concepts into concrete, actionable numbers, helping day traders size positions safely, plan stops and targets realistically, and maintain consistent risk management across trades.

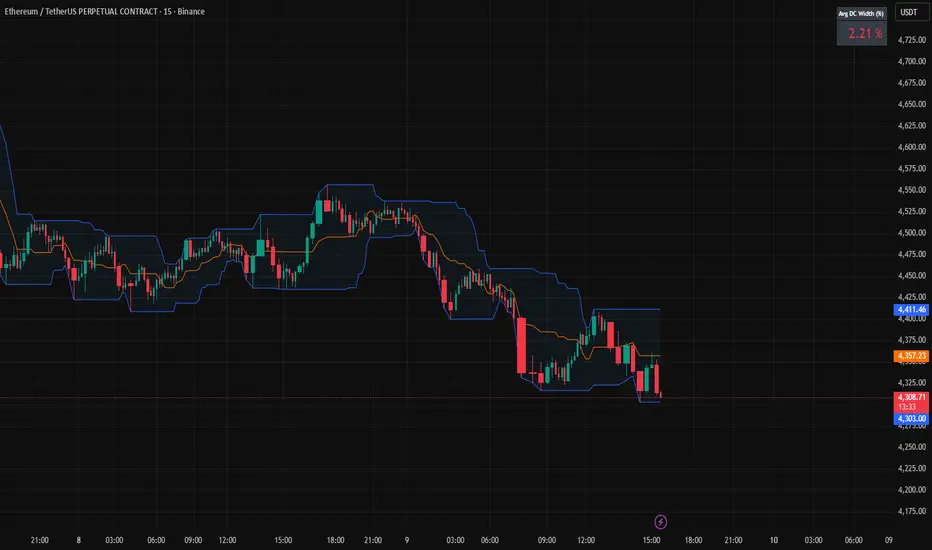
Donchian Channels + Avg Width % DashboardMeasures the average percentage width between the Donchian Channel’s upper and lower bands over a chosen period.
It quantifies how much the market has been moving relative to price — a direct gauge of realized volatility.
When the average width is small, price is range-bound and unlikely to reach fixed TP targets; when it expands, volatility is sufficient for trend or breakout trades.
Based on how fast your strategy is, set your TP% below the average percentage of the Band Width.
Stop Loss and TargetsEnter your purchase price, SL% and up to 3x TP%s. Automatically plots them on your chart to enable quicker set up of alerts.

Twisted Forex's Doji + Area StrategyTitle
Twisted Forex’s Doji + Area Strategy
Description
What this strategy does
This strategy looks for doji candles forming inside or near supply/demand areas . Areas are built from swing pivots and sized with ATR, then tracked for retests (“confirmations”). When a doji prints close to an area and quality checks pass, the strategy places a trade with the stop beyond the doji and a configurable R:R target.
How areas (zones) are built
• Swings are detected with a user-set pivot length.
• Each swing spawns a horizontal area centered at the pivot price with half-height = zoneHalfATR × ATR .
• Duplicates are de-duplicated by center distance (ATR-scaled).
• Areas fade when broken beyond a buffer or after an optional age (expiry).
• Retests are recorded when price touches and then bounces away from the area; repeated reactions increase the zone’s “strength”.
Signal logic (summary)
Doji detection: strict or loose body criteria with optional minimum wick fractions and ATR-scaled minimum range.
Proximity: price must be inside/near a supply or demand area (proxATR × ATR).
Side resolution: overlap is resolved by (a) which side price penetrates more, (b) fast/slow EMA trend, or (c) nearest distance. Optional “previous candle flip” can bias long after a bearish candle and short after a bullish one.
Optional 1-bar confirmation: the bar after the doji must close away from the area by confirmATR × ATR .
Quality filter (Off/Soft/Strict): four checks—(i) wick rejection past the edge, (ii) doji closes in an edge “band” of the area, (iii) fresh touch (cooldown), (iv) approach impulse over a short lookback. In Strict , thresholds auto-tighten.
Orders & exits
• Long: stop below doji low minus buffer; Short: above doji high plus buffer.
• Target = rrMultiple × risk distance .
• Pyramiding is off by default.
Position sizing
You can size from the script or from Strategy Properties:
• Script-driven (default): set Position sizing = “Risk % of equity” and choose riskPercent (e.g., 1.0%). The script applies safe floors/rounding (FX micro-lots by default) so quantity never rounds to zero.
• Properties-driven : toggle Use TV Properties → Order size ON, then pick “Percent of equity” in Properties (e.g., 1%). The header includes safe defaults so trades still place.
Key inputs to explore
• Zone building : pivotLen, zoneHalfATR, minDepartureATR, expiryBars, breakATR, leftBars, dedupeATR.
• Doji & proximity : strictDoji, dojiBodyFrac, minWickFrac, minRangeATR, proxATR, minBarsBetween.
• Overlap resolution : usePenetration, useTrend (EMA 21/55), “previous candle flip”, needNextBarConf & confirmATR.
• Quality : qualityMode (Off/Soft/Strict), minQualPass/kStrict, wickPenATR, edgeBandFrac, approachLookback, approachMinATR, freshTouchBars.
• Zone strength gating : minStrengthSoft / minStrengthStrict.
• HTF confluence (optional) : useHTFTrend (HTF EMA 34/89) and/or useHTFZoneProx (HTF swing bands).
Tips to make it cleaner / higher quality
• Turn needNextBarConf ON and use confirmATR = 0.10–0.15 .
• Increase approachMinATR (e.g., 0.35–0.45) to require a stronger pre-touch impulse.
• Raise minStrengthSoft/Strict (e.g., 4–6) so only well-reacted zones can signal.
• Use signalsOnlyConfirmed ON if you prefer trades only from zones with retests (the script falls back gracefully when none exist yet).
• Nudge proxATR to 0.5–0.6 to demand tighter proximity to the level.
• Optional: enable useHTFTrend to filter counter-trend setups.
Default settings used in this publication
• Initial capital: 100,000 (illustrative).
• Slippage: 1 tick; Commission: 0% (you can raise commission if you prefer—spread is partly modeled by slippage).
• Sizing: Risk % of equity via inputs; riskPercent = 1.0% ; FX uses micro-lot floors by default.
• Quality: Off by default (Soft/Strict available).
• HTF trend gate: Off by default.
Backtesting notes
For a meaningful sample size, test on liquid symbols/timeframes that yield 100+ trades (e.g., majors on 5–15m over 1–2 years). Backtests are modelled and broker costs/spread vary—validate on your feed and forward-test.
How to read the chart
Shaded bands are supply (above) and demand (below). Brighter bands are the nearest K per side (visual aid). BUY/SELL labels mark entries; colored dots show entry/SL/TP levels. You can hide zones or unconfirmed zones for a cleaner view.
Disclaimer
This is educational material, not financial advice. Trading involves risk. Always test and size responsibly.

my_strategy_2.0Overview:
This is a high-speed scalping strategy optimized for volatile crypto assets (BTC, ETH, etc.) on timeframes 1m–5m. It combines trend-following SuperTrend with confirmations from MACD, RSI, Bollinger Bands, and volume spikes for precise entries. Focus on quick profits (1–3 ATR) with strict risk control: partial take-profits, stop-loss, and trailing breakeven after the first TP.
Key Signals:
Long: SuperTrend flip up + MACD crossover up + RSI >50 + BB Upper breakout + volume spike + volatility filter (ATR >0.5%).
Short: Similar but downward.
Exits and Risks:
TP: 33% at +1 ATR, 33% at +2 ATR, 34% at +3 ATR (customizable).
SL: Initial at -1 ATR, after TP1 — to breakeven with trailing on BB midline (optional).
Filters: Minimum ATR to avoid flat markets; realistic commissions in backtests.
Recommendations:
Test on 2020–2025 data (out-of-sample 2024+). Expected Win Rate ~55%, Profit Factor >1.8, Drawdown <10%. Ideal for 1–2% risk per trade. Not for beginners — use paper trading.
Disclaimer: Past results do not guarantee future performance. Trade at your own risk.
(Pine v6 code, ready for publication. Author: gopog777 with expert fixes.)

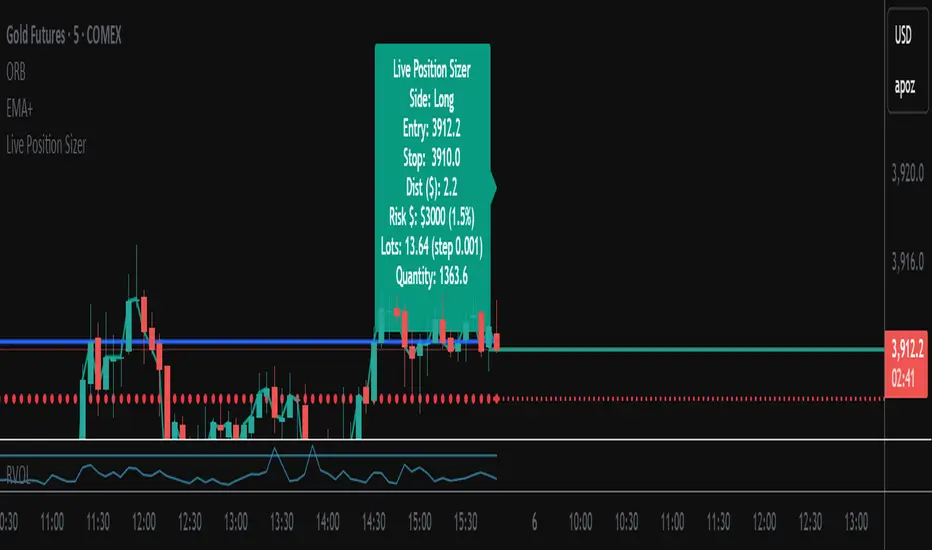
Live Position SizerThis position calculator locks onto the live price in real time and calculates your lot and quantity size for you. Best for scalping if you don't want to open a limit order. You input all the necessary data (Account size, risk, SL placement, LONG/SHORT position, etc...) It also has a nifty feature of allowing you the ability to see TP brackets (+1R, +2R, +3R).
The best way I have used it is seeing where my potential SL will go before I consider opening a position and inputting that. Then when I'm ready to open a position, I already have it calculated for me.
Zero Lag + Momentum Bias StrategyZero Lag + Momentum Bias Strategy (MTF + Strong MBI + R:R + Partial TP + Alerts)

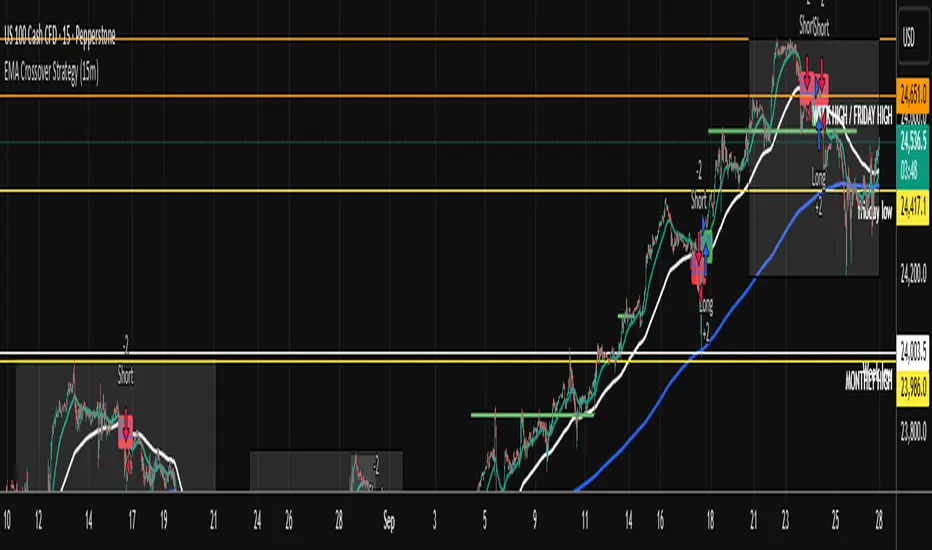
EMA Crossover Strategy (15m)50 and 200 ema crossing when leaving anchor. when 50 and 200 crosses will give you direction of where market is going. wait for a pull back and take trade. sl on highest or lowest point of apex tp open . when you see multiple equal ( low or High) get put of trade.
Trend TraderThe Trend Trader indicator is a trend-following tool based on a triple EMA (Exponential Moving Average) setup designed to help traders identify market direction and potential reversal zones. It plots three customizable EMAs on the chart to highlight bullish and bearish momentum, then generates trade signals when price shows a strong likelihood of continuing in the direction of the prevailing trend.
EMA Alignment: The indicator checks for bullish stacking (fast EMA above medium, medium above slow) and bearish stacking (fast EMA below medium, medium below slow). This alignment defines the prevailing market trend.
Trend Validation: A user-defined lookback period ensures signals are only taken if the market recently displayed a stacked trend, thus filtering false entries during consolidations.
Signal Generation: Buy signals appear when price dips into the zone between the fast and medium EMAs during a bullish trend. Sell signals appear when price rallies into the zone between the fast and medium EMAs during a bearish trend.
Alerts: Built-in alerts notify traders of new trade opportunities without having to constantly watch the chart.
This indicator is suitable for swing trading and intraday strategies across multiple markets, including forex, stocks, indices, and crypto.
Suggested Strategy for Profitability
This tool is best used as part of a structured trend-trading plan. Below is a suggested framework:
Entry Rules
Long (Buy Trade):
Confirm that EMA alignment is bullish (EMA1 > EMA2 > EMA3).
Wait for a Buy Signal (triangle up below price).
Ensure the higher timeframe (e.g., 4H if trading 1H) trend is also bullish to filter trades.
Short (Sell Trade):
Confirm EMA alignment is bearish (EMA1 < EMA2 < EMA3).
Wait for a Sell Signal (triangle down above price).
Higher timeframe should also be bearish to increase probability.
Stop Loss
For long positions, place the stop loss just below EMA3 or the most recent swing low.
For short positions, place the stop loss just above EMA3 or the most recent swing high.
Take Profit
Conservative: Set TP at 1.5x to 2x the stop loss distance.
Aggressive: Trail stop loss below EMA2 (for longs) or above EMA2 (for shorts) to capture larger trends.
Risk Management
Use no more than 1–2% of account risk per trade.
Trade only when the signal aligns with overall market context (higher timeframe, support/resistance, or volume confirmation).
This indicator is very similar to the indicator "Trend Scalper" by the same developer, the difference is this indicator is used to just find the trade and hold the trade or to find the reversal of a trend instead of triggering alerts every time price enters between EMA1 and EMA2.
Trader Marks Trailing SL + TP (BE @ 60%)This script provides a unique stop-loss and take-profit management tool designed for swing traders.
It introduces a two-stage stop-loss logic that is not available in standard TradingView tools:
Break-Even Protection: Once a defined profit threshold (e.g. 66%) is reached, the stop-loss automatically moves to break-even.
ATR-Based Trailing Stop: After a chosen delay (e.g. 12 hours), the script activates a dynamic trailing stop that follows market volatility using the ATR.
Flexible Ratchet Mechanism: The stop-loss can be locked at new profit levels and will never move backwards.
This combination allows traders to secure profits while still giving the trade room to develop. The indicator is especially useful for swing trading on 4H and daily timeframes but can be applied to other styles as well.
How to use:
Enter your entry price, stop-loss, and take-profit levels.
Choose your trailing mode: Exact S/L+ (simple) or Advanced (Delay + BE + Ratchet).
Adjust parameters such as ATR length or activation delay to match your strategy.
The script helps you balance risk and reward by ensuring that once the trade moves in your favor, you cannot lose the initial risk, while still benefiting from extended market moves.

Foresight Cone (HoltxF1xVWAP) [KedArc Quant]Description:
This is a time-series forecasting indicator that estimates the next bar (F1) and projects a path a few bars ahead. It also draws a confidence cone based on how accurate the recent forecasts have been. You can optionally color the projection only when price agrees with VWAP.
Why it’s different
* One clear model: Everything comes from Holt’s trend-aware forecasting method—no mix of unrelated indicators.
* Transparent visuals: You see the next-bar estimate (F1), the forward projection, and a cone that widens or narrows based on recent forecast error.
* Context, not signals: The VWAP option only changes colors. It doesn’t add trade rules.
* No look-ahead: Accuracy is measured using the forecast made on the previous bar versus the current bar.
Inputs (what they mean)
* Source: Price series to forecast (default: Close).
* Preset: Quick profiles for fast, smooth, or momentum markets (see below).
* Alpha (Level): How fast the model reacts to new prices. Higher = faster, twitchier.
* Beta (Trend): How fast the model updates the slope. Higher = faster pivots, more flips in chop.
* Horizon: How many bars ahead to project. Bigger = wider cone.
* Residual Window: How many bars to judge recent accuracy. Bigger = steadier cone.
* Confidence Z: How wide the cone should be (typical setting ≈ “95% style” width).
* Show Bands / Draw Forward Path: Turn the cone and forward lines on/off.
* Color only when aligned with VWAP: Highlights projections only when price agrees with the trend side of VWAP.
* Colors / Show Panel: Styling plus a small panel with RMSE, MAPE, and trend slope.
Presets (when to pick which)
* Scalp / Fast (1-min): Very responsive; best for quick moves. More twitch in chop.
* Smooth Intraday (1–5 min): Calmer and steadier; a good default most days.
* Momentum / Breakout: Quicker slope tracking during strong pushes; may over-react in ranges.
* Custom: Set your own values if you know exactly what you want.
What is F1 here?
F1 is the model’s next-bar fair value. Crosses of price versus F1 can hint at short-term momentum shifts or mean-reversion, especially when viewed with VWAP or the cone.
How this helps
* Gives a baseline path of where price may drift and a cone that shows normal wiggle room.
* Helps you tell routine noise (inside cone) from information (edges or breaks outside the cone).
* Keeps you aware of short-term bias via the trend slope and F1.
How to use (step by step)
1. Add to chart → choose a Preset (start with Smooth Intraday).
2. Set Horizon around 8–15 bars for intraday.
3. (Optional) Turn on VWAP alignment to color only when price agrees with the trend side of VWAP.
4. Watch where price sits relative to the cone and F1:
* Inside = normal noise.
* At edges = stretched.
* Outside = possible regime change.
5. Check the panel: if RMSE/MAPE spike, expect a wider cone; consider a smoother preset or a higher timeframe.
6. Tweak Alpha/Beta only if needed: faster for momentum, slower for chop.
7. Combine with your own plan for entries, exits, and risk.
Accuracy Panel — what it tells you
Preset & Horizon: Shows which preset you’re using and how many bars ahead the projection goes. Longer horizons mean more uncertainty.
RMSE (error in price units): A “typical miss” measured in the chart’s currency (e.g., ₹).
Lower = tighter fit and a usually narrower cone. Rising = conditions getting noisier; the cone will widen.
MAPE (error in %): The same idea as RMSE but in percent.
Good for comparing different symbols or timeframes. Sudden spikes often hint at a regime change.
Slope T: The model’s short-term trend reading.
Positive = gentle up-bias; negative = gentle down-bias; near zero = mostly flat/drifty.
How to read it at a glance
Calm & directional: RMSE/MAPE steady or falling + Slope T positive (or negative) → trends tend to respect the cone’s mid/upper (or mid/lower) area.
Choppy/uncertain: RMSE/MAPE climbing or jumping → expect more whipsaw; rely more on the cone edges and higher-TF context.
Flat tape: Slope T near zero → mean-revert behavior is common; treat cone edges as stretch zones rather than breakout zones.
Warm-up & tweaks
Warm-up: Right after adding the indicator, the panel may be blank for a short time while it gathers enough bars.
Too twitchy? Switch to Smooth Intraday or increase the Residual Window.
Too slow? Use Scalp/Fast or Momentum/Breakout to react quicker.
Timeframe tips
* 1–3 min: Scalp/Fast or Momentum/Breakout; horizon \~8–12.
* 5–15 min: Smooth Intraday; horizon \~12–15.
* 30–60 min+: Consider a larger residual window for a steadier cone.
FAQ
Q: Is this a strategy or an indicator?
A: It’s an indicator only. It does not place orders, TP/SL, or run backtests.
Q: Does it repaint?
A: The next-bar estimate (F1) and the cone are calculated using only information available at that time. The forward path is a projection drawn on the last bar and will naturally update as new bars arrive. Historical bars aren’t revised with future data.
Q: What is F1?
A: F1 is the indicator’s best guess for the next bar.
Price crossing above/below F1 can hint at short-term momentum shifts or mean-reversion.
Q: What do “Alpha” and “Beta” do?
A: Alpha controls how fast the indicator reacts to new prices
(higher = faster, twitchier). Beta controls how fast the slope updates (higher = quicker pivots, more flips in chop).
Q: Why does the cone width change?
A: It reflects recent forecast accuracy. When the market gets noisy, the cone widens. When the tape is calm, it narrows.
Q: What does the Accuracy Panel tell me?
A:
* Preset & Horizon you’re using.
* RMSE: typical forecast miss in price units.
* MAPE: typical forecast miss in percent.
* Slope T: short-term trend reading (up, down, or flat).
If RMSE/MAPE rise, expect a wider cone and more whipsaw.
Q: The panel shows “…” or looks empty. Why?
A: It needs a short warm-up to gather enough bars. This is normal after you add the indicator or change settings/timeframes.
Q: Which timeframe is best?
A:
* 1–3 min: Scalp/Fast or Momentum/Breakout, horizon \~8–12.
* 5–15 min: Smooth Intraday, horizon \~12–15.
Higher timeframes work too; consider a larger residual window for steadier cones.
Q: Which preset should I start with?
A: Start with Smooth Intraday. If the market is trending hard, try Momentum/Breakout.
For very quick tapes, use Scalp/Fast. Switch back if things get choppy.
Q: What does the VWAP option do?
A: It only changes colors (highlights when price agrees with the trend side of VWAP).
It does not add or remove signals.
Q: Are there alerts?
A: Yes—alerts for price crossing F1 (up/down). Use “Once per bar close” to reduce noise on fast charts.
Q: Can I use this on stocks, futures, crypto, or FX?
A: Yes. It works on any symbol/timeframe. You may want to adjust Horizon and the Residual Window based on volatility.
Q: Can I use it with Heikin Ashi or other non-standard bars?
A: You can, but remember you’re forecasting the synthetic series of those bars. For pure price behavior, use regular candles.
Q: The cone feels too wide/too narrow. What do I change?
A:
* Too wide: lower Alpha/Beta a bit or increase the Residual Window.
* Too narrow (misses moves): raise Alpha/Beta slightly or try Momentum/Breakout.
Q: Why do results change when I switch timeframe or symbol?
A: Different noise levels and trends. The accuracy stats reset per chart, so the cone adapts to each context.
Q: Any limits or gotchas?
A: Extremely large Horizon may hit TradingView’s line-object limits; reduce Horizon or turn
off extra visuals if needed. Big gaps or news spikes will widen errors—expect the cone to react.
Q: Can this predict exact future prices?
A: No. It provides a baseline path and context. Always combine with your own rules and risk management.
Glossary
* TS (Time Series): Data over time (prices).
* Holt’s Method: A forecasting approach that tracks a current level and a trend to predict the next bars.
* F1: The indicator’s best guess for the next bar.
* F(h): The projected value h bars ahead.
* VWAP: Volume-Weighted Average Price—used here for optional color alignment.
* RMSE: Typical forecast miss in price units (how far off, on average).
* MAPE: Typical forecast miss in percent (scale-free, easy to compare).
Notes & limitations
* The panel needs a short warm-up; stats may be blank at first.
* The cone reflects recent conditions; sudden volatility changes will widen it.
* This is a tool for context. It does not place trades and does not promise results.
⚠️ Disclaimer
This script is provided for educational purposes only.
Past performance does not guarantee future results.
Trading involves risk, and users should exercise caution and use proper risk management when applying this strategy.
