Enhanced High-Low Difference IndicatorEnhanced High-Low Difference Indicator
The "Enhanced High-Low Difference Indicator" is a powerful tool that highlights market volatility by tracking the difference between the high and low prices of a bar. Key features include:
Customizable Threshold: Set your own threshold for the high-low difference to filter out minor fluctuations.
Visual Highlights: Bars that exceed the threshold are highlighted with customizable color and opacity settings for easy identification.
Optional Labels: Display the exact high-low difference on the bars when the threshold is exceeded, with fully customizable label color and size.
High-Low Difference Line: Optionally plot a line that tracks the high-low difference of each bar for visual reference.
Alerts: Receive real-time alerts when the high-low difference exceeds your specified threshold.
Threshold Reference Line: Plot the threshold value as a horizontal reference line on the chart.
This indicator is ideal for traders looking to identify volatility spikes and make informed trading decisions based on price action.
Cerca negli script per "track"

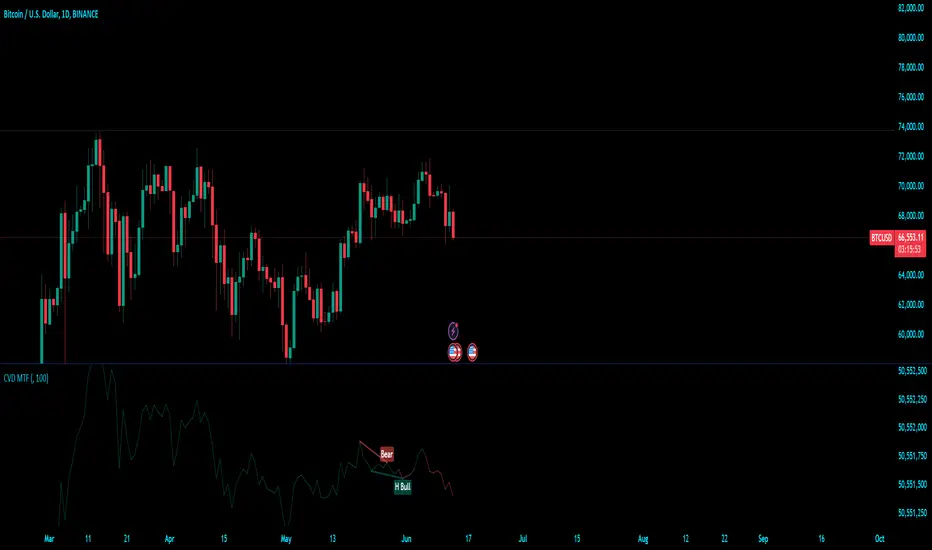
Cumulative Volume Delta (MTF)Cumulative Volume Delta (CVD) Indicator
The Cumulative Volume Delta (CVD) indicator is a powerful analytical tool used to understand the behavior and dynamics of market participants through volume analysis. It tracks the net difference between buying and selling pressure, providing insights into market trends and potential reversals. Here's a detailed description of this indicator and its components:
The Cumulative Volume Delta (CVD) indicator calculates the cumulative net difference between buying and selling volume over a specified period. By analyzing this net difference, traders can gain insights into the underlying strength or weakness of a price movement, helping to identify trends, reversals, and potential breakout points.
Key Components:
Bull & Bear Power Calculation:
Bull Power: Represents the strength of buyers in the market. It is calculated based on the relationship between the current and previous price bars. A higher Bull Power indicates stronger buying pressure.
Bear Power: Represents the strength of sellers in the market. It is also calculated based on the relationship between the current and previous price bars. A higher Bear Power indicates stronger selling pressure.
Bull & Bear Volume Calculation:
Bull Volume: The volume attributed to buying pressure. It is calculated by taking the proportion of Bull Power relative to the total of Bull Power and Bear Power, multiplied by the total volume.
Bear Volume: The volume attributed to selling pressure. It is calculated similarly to Bull Volume but using Bear Power.
Delta Calculation:
Delta: The net difference between Bull Volume and Bear Volume for each bar. A positive Delta indicates more buying pressure, while a negative Delta indicates more selling pressure.
Cumulative Volume Delta (CVD):
CVD: The running total of the Delta values over time. It accumulates the net buying and selling pressure to provide a visual representation of the market's cumulative sentiment.
Moving Average of CVD (CVD MA):
CVD MA: A simple moving average of the CVD, used to smooth out fluctuations and help identify the overall trend. It provides a baseline to compare the current CVD value against, highlighting divergences or convergences.
Multi-Timeframe Functionality:
The enhanced version of the CVD indicator includes multi-timeframe (MTF) capabilities, allowing users to select and analyze data from different timeframes. This feature enhances the versatility of the indicator by providing a broader perspective on market dynamics across various time intervals.
Practical Applications:
Trend Identification: By tracking the CVD and its moving average, traders can identify the prevailing trend. An upward-sloping CVD indicates sustained buying pressure, while a downward-sloping CVD indicates sustained selling pressure.
Divergences: Divergences between the CVD and price can signal potential reversals. For example, if the price is making new highs but the CVD is not, it may indicate weakening buying pressure and a potential reversal.
Breakout Confirmation: Significant changes in the CVD can confirm breakouts. A sharp increase in the CVD during a price breakout indicates strong buying support, adding confidence to the breakout.
Support and Resistance Levels: The CVD can help identify significant support and resistance levels based on changes in volume dynamics. For instance, a notable increase in buying volume at a support level can reinforce its strength.
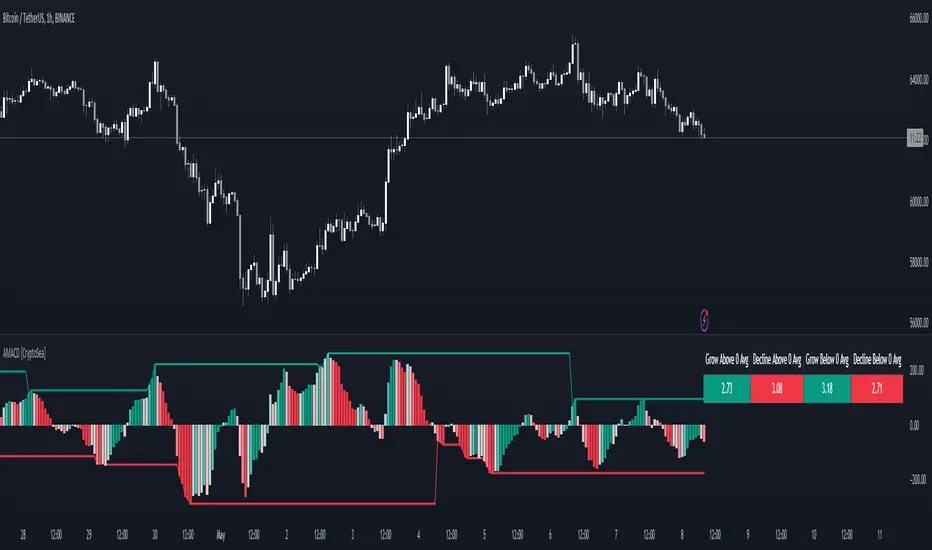
Advanced MACD [CryptoSea]Advanced MACD (AMACD) enhances the traditional MACD indicator, integrating innovative features for traders aiming for deeper insights into market momentum and sentiment. It's crafted for those seeking to explore nuanced behaviors of the MACD histogram, thus offering a refined perspective on market dynamics.
Divergence moves can offer insight into continuation or potential reversals in structure, the example below is a clear continuation signal.
Key Features
Enhanced Histogram Analysis: Precisely tracks movements of the MACD histogram, identifying growth or decline periods, essential for understanding market momentum.
High/Low Markers: Marks the highest and lowest points of the histogram within a user-defined period, signaling potential shifts in the market.
Dynamic Averages Calculation: Computes average durations of histogram phases, providing a benchmark against historical performance.
Color-Coded Histogram: Dynamically adjusts the histogram's color intensity based on the current streak's duration relative to its average, offering a visual cue of momentum strength.
Customisable MACD Settings: Enables adjustments to MACD parameters, aligning with individual trading strategies.
Interactive Dashboard: Showcases an on-chart table with average durations for each phase, aiding swift decision-making.
Settings & Customisation
MACD Settings: Customise fast length, slow length, and signal smoothing to tailor the MACD calculations to your trading needs.
Reset Period: Determine the number of bars to identify the histogram's significant high and low points.
Histogram High/Lows: Option to display critical high and low levels of the histogram for easy referencing.
Candle Colours: Select between neutral or traditional candle colors to match your analytical preferences.
When in strong trends, you can use the average table to determine when to look to get into a position. This example we are in a strong downtrend, we then see the histogram growing above the average in these conditions which is where we should look to get into a shorting position.
Strategic Applications
The AMACD serves not just as an indicator but as a comprehensive analytical tool for spotting market trends, momentum shifts, and potential reversal points. It's particularly useful for traders to:
Spot Momentum Changes Utilise dynamic coloring and streak tracking to alert shifts in momentum, helping anticipate market movements.
Identify Market Extremes Use high and low markers to spot potential market turning points, aiding in risk management and decision-making.
Alert Conditions
Above Average Movement Alerts: Triggered when the duration of the MACD histogram's growth or decline is unusually long, these alerts signal sustained momentum:
Above Zero: Alerts for both growing and declining movements above zero, indicating either continued bullish trends or potential bearish reversals.
Below Zero: Alerts for growth and decline below zero, pointing to potential bullish reversals or confirmed bearish trends.
High/Low Break Alerts: Activated when the histogram reaches new highs or falls to new lows beyond the set thresholds, these alerts are crucial for identifying shifts in market dynamics:
Break Above Last High: Indicates a potential upward trend as the histogram surpasses recent highs.
Break Below Last Low: Warns of a possible downward trend as the histogram drops below recent lows.
These alert conditions enable traders to automate part of their market monitoring or potential to automate the signals to take action elsewhere.
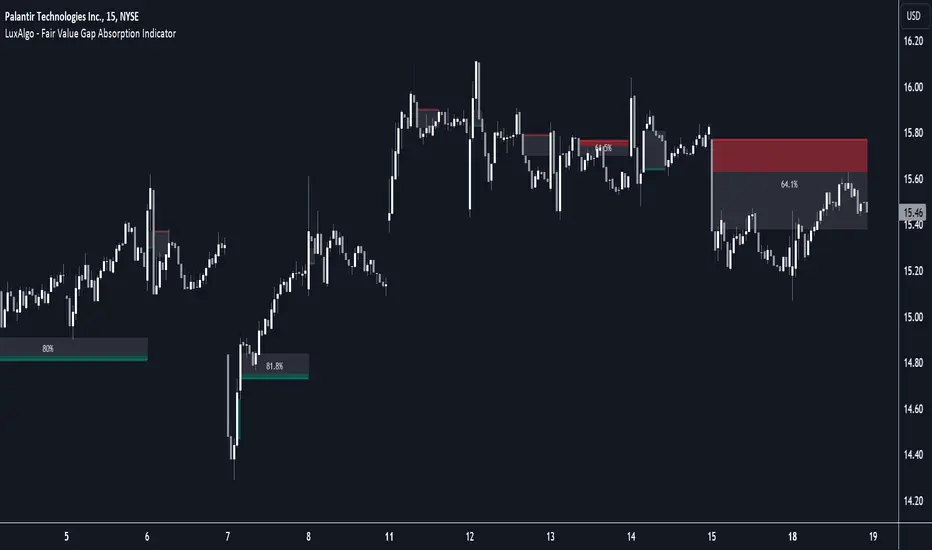
Fair Value Gap Absorption Indicator [LuxAlgo]The Fair Value Gap Absorption Indicator aims to detect fair value gap imbalances and tracks the mitigation status of the detected fair value gap by highlighting the mitigation level till a new fair value gap is detected.
The Fair Value Gap (FVG) is a widely utilized tool among price action traders to detect market inefficiencies or imbalances. These imbalances arise when buying or selling pressure is significant, resulting in a large upward or downward move, leaving behind an imbalance in the market.
🔶 USAGE
A fair value gap appears in a triple-candle pattern when there is a large candle whose previous candle’s high and subsequent candle’s low do not fully overlap the large candle. The space between these wicks is known as the fair value gap.
Price can come back to these imbalance areas and mitigate them, however, this is sometimes a process involving multiple bars, the displayed imbalances by the indicator allow tracking the current mitigation level of a displayed imbalance.
Fair value gaps can become a magnet for the price before continuing in the same direction. Traders commonly wait for the price to revert toward the fair value gap to clear out the imbalance before continuing to move toward the prevailing trend.
🔶 SETTINGS
🔹Fair Value Gaps
Fair Value Gap Width Filter: defines the filtering multiplier, please refer to the tooltip of the input option for further details.
Bullish, Imbalance and Mitigation: color customization option.
Bearish, Imbalance and Mitigation: color customization option.
Display Percentage of Mitigation: Display the percentage of the mitigation areas.
Historical Fair Value Gaps: toggles the visibility of the historical fair value gaps.
🔶 LIMITATIONS
Please note that filtering cannot be applied for the first 144 (atr fixed-length) candles since the atr value won't be present that is used for filtering.
🔶 RELATED SCRIPTS
Fair-Value-Gap
HTF-Fair-Value-Gap
Liquidity-Voids-FVG
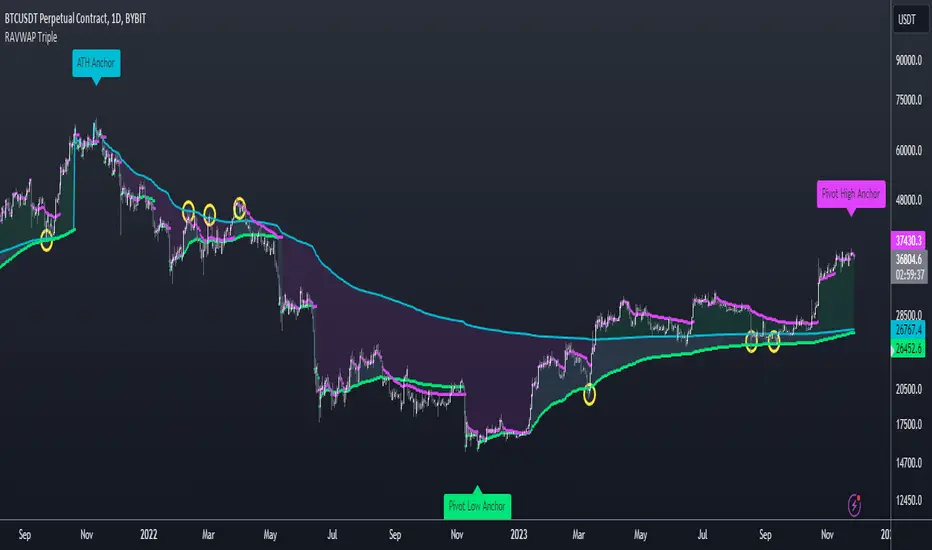
Re-Anchoring VWAP TripleThe Triple Re-Anchoring VWAP (Volume Weighted Average Price) indicator is a tool designed for traders seeking a deeper understanding of market trends and key price levels. This indicator dynamically recalibrates VWAP calculations based on significant market pivot points, offering a unique perspective on potential support and resistance levels.
Key Features:
Dynamic Re-anchoring at All-Time Highs (ATH) : The first layer of this indicator continuously tracks the all-time high and recalibrates the VWAP from each new ATH. This VWAP line, typically acting as a dynamic resistance level, offers insights into the overbought conditions and potential reversal zones.
Adaptive Re-anchoring to Post-ATH Lows : The second component of the indicator shifts focus to the market's reaction post-ATH. It identifies the lowest low following an ATH and re-anchors the VWAP calculation from this point. This VWAP line often serves as a dynamic support level, highlighting key areas where the market finds value after a significant high.
Re-anchoring to Highs After Post-ATH Lows : The third element of this tool takes adaptation one step further by tracking the highest high achieved after the lowest low post-ATH. This VWAP line can act as either support or resistance, providing a nuanced view of the market's valuation in the recovery phase or during consolidation after a significant low.
Applications:
Trend Confirmation and Reversal Signals : By comparing the price action relative to the dynamically anchored VWAP lines, traders can gauge the strength of the trend and anticipate potential reversals.
Entry and Exit Points : By highlighting significant support and resistance areas, it assists in determining optimal entry and exit points, particularly in swing trading and mean reversion strategies.
Enhanced Market Insight : The dynamic nature of the indicator, with its shifting anchor points, offers a refined understanding of market sentiment and valuation changes over time.
Why Triple Re-Anchoring VWAP?
Traditional VWAP tools offer a linear view, often missing out on the intricacies of market fluctuations. The Triple Re-Anchoring VWAP addresses this by providing a multi-faceted view of the market, adapting not just to daily price changes but pivoting around significant market events. Whether you're a day trader, swing trader, or long-term investor, this indicator adds depth to your market analysis, enabling more informed trading decisions.
Examples:
VWAP Balance ZonesVWAP Balance Zones (VBZ) Is based on 3 concepts.
Many Traders use VWAP to help determine Price Trends.
Trends are typically identified by new Highs or new Lows.
Balanced is found when Supply and Demand are mostly Equal.
VBZ tracks the daily, weekly, and monthly highs and lows; Then plots the average (50%) between the VWAP and the respective extremes.
50% VWAP Zones can be considered significant since they attempt to identify the equilibrium between market participants within the current trend, serving as key reference points to consider for decision making. >While in an uptrend, Buyers may see price falling to the Hi 50% as an attractive value entry for the continuation upwards.
>While ALSO in an uptrend, Sellers may see price falling to the Hi 50% as a change in sentiment with more downwards movement on the way.
Because of these conflicting mindsets, these zones are thought to display areas of balance between buyers and sellers, which can serve as potential decision points throughout the day.
VBZ Draws Zones from the Daily (High/Low/Close) VWAPs and the Day's (High/Low/Close) extremes as seen below.
Technically speaking, an average between vwap and extreme is a single point, to make these into zones I am using multiple sources for vwap and tracking different points of the bar throughout the day (ex. Close VWAP & Daily Highest Close)
Weekly and Monthly are only displaying the Average Price between the VWAP and the (Weekly or Monthly) High/Low.
These hold up as important levels for speculation; however, since most action will be discovered at the daily zones, I am not displaying the zones for the Weekly and Monthly to keep noise to a minimum.
Unique Behaviors:
- Weekly values are hidden on the first day of the week since they are similar to the daily values on the first day of the week.
- Monthly values are hidden in the first week of the month for the same reason.

DP_52W_HIGH_LOW_INDICATORThis indicator tracks the 52W High and Low of any script and provides a visual interpretation of the stock price movement.
It can be used as a quick tracking indicator for trading stocks / ETFs at their 52W Low.
A typical strategy will include buying such stocks at 52W Low and selling at 52W High.

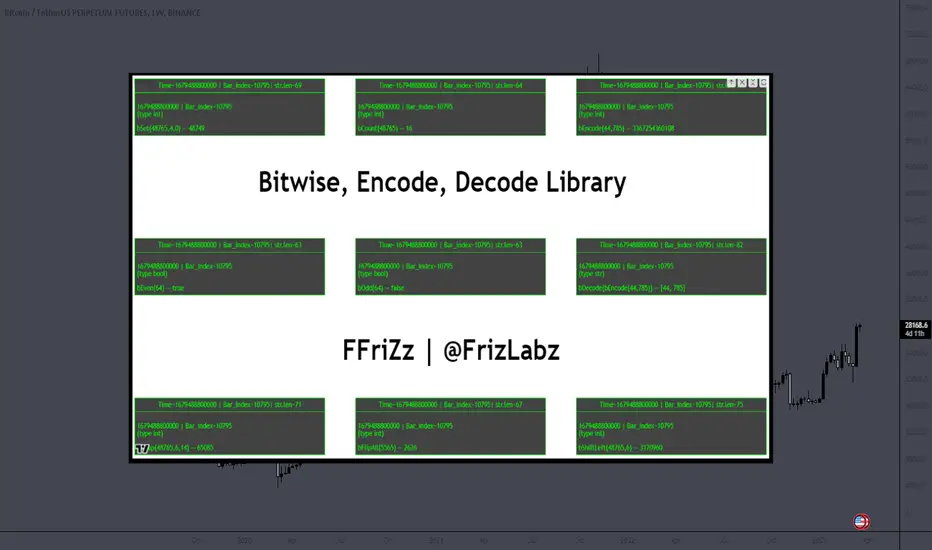
Bitwise, Encode, DecodeLibrary "Bitwise, Encode, Decode"
Bitwise, Encode, Decode, and more Library
docs()
Hover-Over Documentation for inside Text Editor
bAnd(a, b)
Returns the bitwise AND of two integers
Parameters:
a : `int` - The first integer
b : `int` - The second integer
Returns: `int` - The bitwise AND of the two integers
bOr(a, b)
Performs a bitwise OR operation on two integers.
Parameters:
a : `int` - The first integer.
b : `int` - The second integer.
Returns: `int` - The result of the bitwise OR operation.
bXor(a, b)
Performs a bitwise Xor operation on two integers.
Parameters:
a : `int` - The first integer.
b : `int` - The second integer.
Returns: `int` - The result of the bitwise Xor operation.
bNot(n)
Performs a bitwise NOT operation on an integer.
Parameters:
n : `int` - The integer to perform the bitwise NOT operation on.
Returns: `int` - The result of the bitwise NOT operation.
bShiftLeft(n, step)
Performs a bitwise left shift operation on an integer.
Parameters:
n : `int` - The integer to perform the bitwise left shift operation on.
step : `int` - The number of positions to shift the bits to the left.
Returns: `int` - The result of the bitwise left shift operation.
bShiftRight(n, step)
Performs a bitwise right shift operation on an integer.
Parameters:
n : `int` - The integer to perform the bitwise right shift operation on.
step : `int` - The number of bits to shift by.
Returns: `int` - The result of the bitwise right shift operation.
bRotateLeft(n, step)
Performs a bitwise right shift operation on an integer.
Parameters:
n : `int` - The int to perform the bitwise Left rotation on the bits.
step : `int` - The number of bits to shift by.
Returns: `int`- The result of the bitwise right shift operation.
bRotateRight(n, step)
Performs a bitwise right shift operation on an integer.
Parameters:
n : `int` - The int to perform the bitwise Right rotation on the bits.
step : `int` - The number of bits to shift by.
Returns: `int` - The result of the bitwise right shift operation.
bSetCheck(n, pos)
Checks if the bit at the given position is set to 1.
Parameters:
n : `int` - The integer to check.
pos : `int` - The position of the bit to check.
Returns: `bool` - True if the bit is set to 1, False otherwise.
bClear(n, pos)
Clears a particular bit of an integer (changes from 1 to 0) passes if bit at pos is 0.
Parameters:
n : `int` - The integer to clear a bit from.
pos : `int` - The zero-based index of the bit to clear.
Returns: `int` - The result of clearing the specified bit.
bFlip0s(n)
Flips all 0 bits in the number to 1.
Parameters:
n : `int` - The integer to flip the bits of.
Returns: `int` - The result of flipping all 0 bits in the number.
bFlip1s(n)
Flips all 1 bits in the number to 0.
Parameters:
n : `int` - The integer to flip the bits of.
Returns: `int` - The result of flipping all 1 bits in the number.
bFlipAll(n)
Flips all bits in the number.
Parameters:
n : `int` - The integer to flip the bits of.
Returns: `int` - The result of flipping all bits in the number.
bSet(n, pos, newBit)
Changes the value of the bit at the given position.
Parameters:
n : `int` - The integer to modify.
pos : `int` - The position of the bit to change.
newBit : `int` - na = flips bit at pos reguardless 1 or 0 | The new value of the bit (0 or 1).
Returns: `int` - The modified integer.
changeDigit(n, pos, newDigit)
Changes the value of the digit at the given position.
Parameters:
n : `int` - The integer to modify.
pos : `int` - The position of the digit to change.
newDigit : `int` - The new value of the digit (0-9).
Returns: `int` - The modified integer.
bSwap(n, i, j)
Switch the position of 2 bits of an int
Parameters:
n : `int` - int to manipulate
i : `int` - bit pos to switch with j
j : `int` - bit pos to switch with i
Returns: `int` - new int with bits switched
bPalindrome(n)
Checks to see if the binary form is a Palindrome (reads the same left to right and vice versa)
Parameters:
n : `int` - int to check
Returns: `bool` - result of check
bEven(n)
Checks if n is Even
Parameters:
n : `int` - The integer to check.
Returns: `bool` - result.
bOdd(n)
checks if n is Even if not even Odd
Parameters:
n : `int` - The integer to check.
Returns: `bool` - result.
bPowerOfTwo(n)
Checks if n is a Power of 2.
Parameters:
n : `int` - number to check.
Returns: `bool` - result.
bCount(n, to_count)
Counts the number of bits that are equal to 1 in an integer.
Parameters:
n : `int` - The integer to count the bits in.
to_count `string` - the bits to count
Returns: `int` - The number of bits that are equal to 1 in n.
GCD(a, b)
Finds the greatest common divisor (GCD) of two numbers.
Parameters:
a : `int` - The first number.
b : `int` - The second number.
Returns: `int` - The GCD of a and b.
LCM(a, b)
Finds the least common multiple (LCM) of two integers.
Parameters:
a : `int` - The first integer.
b : `int` - The second integer.
Returns: `int` - The LCM of a and b.
aLCM(nums)
Finds the LCM of an array of integers.
Parameters:
nums : `int ` - The list of integers.
Returns: `int` - The LCM of the integers in nums.
adjustedLCM(nums, LCM)
adjust an array of integers to Least Common Multiple (LCM)
Parameters:
nums : `int ` - The first integer
LCM : `int` - The second integer
Returns: `int ` - array of ints with LCM
charAt(str, pos)
gets a Char at a given position.
Parameters:
str : `string` - string to pull char from.
pos : `int` - pos to get char from string (left to right index).
Returns: `string` - char from pos of string or "" if pos is not within index range
decimalToBinary(num)
Converts a decimal number to binary
Parameters:
num : `int` - The decimal number to convert to binary
Returns: `string` - The binary representation of the decimal number
decimalToBinary(num, to_binary_int)
Converts a decimal number to binary
Parameters:
num : `int` - The decimal number to convert to binary
to_binary_int : `bool` - bool to convert to int or to string (true for int, false for string)
Returns: `string` - The binary representation of the decimal number
binaryToDecimal(binary)
Converts a binary number to decimal
Parameters:
binary : `string` - The binary number to convert to decimal
Returns: `int` - The decimal representation of the binary number
decimal_len(n)
way of finding decimal length using arithmetic
Parameters:
n `float` - floating decimal point to get length of.
Returns: `int` - number of decimal places
int_len(n)
way of finding number length using arithmetic
Parameters:
n : `int`- value to find length of number
Returns: `int` - lenth of nunber i.e. 23 == 2
float_decimal_to_whole(n)
Converts a float decimal number to an integer `0.365 to 365`.
Parameters:
n : `string` - The decimal number represented as a string.
Returns: `int` - The integer obtained by removing the decimal point and leading zeroes from s.
fractional_part(x)
Returns the fractional part of a float.
Parameters:
x : `float` - The float to get the fractional part of.
Returns: `float` - The fractional part of the float.
form_decimal(a, b, zero_fix)
helper to form 2 ints into 1 float seperated by the decimal
Parameters:
a : `int` - a int
b : `int` - b int
zero_fix : `bool` - fix for trailing zeros being truncated when converting to float
Returns: ` ` - float = float decimal of ints | string = string version of b for future use to ref length
bEncode(n1, n2)
Encodes two numbers into one using bit OR. (fastest)
Parameters:
n1 : `int` - The first number to Encodes.
n2 : `int` - The second number to Encodes.
Returns: `int` - The result of combining the two numbers using bit OR.
bDecode(n)
Decodes an integer created by the bCombine function.(fastest)
Parameters:
n : `int` - The integer to decode.
Returns: ` ` - A tuple containing the two decoded components of the integer.
Encode(a, b)
Encodes by seperating ints into left and right of decimal float
Parameters:
a : `int` - a int
b : `int` - b int
Returns: `float` - new float of encoded ints one on left of decimal point one on right
Decode(encoded)
Decodes float of 2 ints seperated by decimal point
Parameters:
encoded : `float` - the encoded float value
Returns: ` ` - tuple of the 2 ints from encoded float
encode_heavy(a, b)
Encodes by combining numbers and tracking size in the
decimal of a floating number (slowest)
Parameters:
a : `int` - a int
b : `int` - b int
Returns: `float` - new decimal of encoded ints
decode_heavy(encoded)
Decodes encoded float that tracks size of ints in float decimal
Parameters:
encoded : `float` - encoded float
Returns: ` ` - tuple of decoded ints
decimal of float (slowest)
Parameters:
encoded : `float` - the encoded float value
Returns: ` ` - tuple of the 2 ints from encoded float
Bitwise, Encode, Decode Docs
In the documentation you may notice the word decimal
not used as normal this is because when referring to
binary a decimal number is a number that
can be represented with base 10 numbers 0-9
(the wiki below explains better)
A rule of thumb for the two integers being
encoded it to keep both numbers
less than 65535 this is because anything lower uses 16 bits or less
this will maintain 100% accuracy when decoding
although it is possible to do numbers up to 2147483645 with
this library doesnt seem useful enough
to explain or demonstrate.
The functions provided work within this 32-bit range,
where the highest number is all 1s and
the lowest number is all 0s. These functions were created
to overcome the lack of built-in bitwise functions in Pinescript.
By combining two integers into a single number,
the code can access both values i.e when
indexing only one array index
for a matrices row/column, thus improving execution time.
This technique can be applied to various coding
scenarios to enhance performance.
Bitwise functions are a way to use integers in binary form
that can be used to speed up several different processes
most languages have operators to perform these function such as
`<<, >>, &, ^, |, ~`
en.wikipedia.org
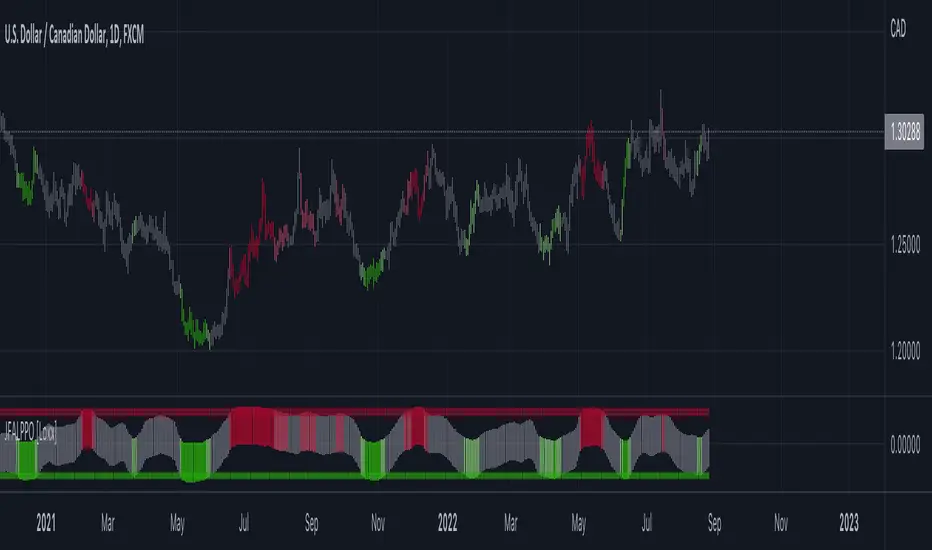
Jurik-Filtered, Adaptive Laguerre PPO [Loxx]Jurik-Filtered, Adaptive Laguerre PPO is an indicator used to find reversals. Smoothing with a Jurik Filter reduces noise and better identifies reversal points.
What is Laguerre Filter?
The Adaptive Laguerre is based on the Laguerre filter, described by John Ehlers in his paper “Time Warp – Without Space Travel”. It applies a variable gamma factor, based on how well the filter is tracking previous price movement. As with other adaptive moving averages, the Adaptive Laguerre tracks trending markets closely but will see less changes in range-bound markets.
The Adaptive Laguerre filter allows for an adjustment of the simple Laguerre filter. When price moves away from the filter, it becomes faster. When price moves sideward, the filter gets slower. Accordingly, this indicator belongs to the same class of moving average as the Kaufman Adaptive Moving Average (KAMA). It similar to the Volatility Index Dynamic Average (VIDYA) developed by Tushar Chande. The Adaptive Laguerre filter is smoother than the VIDYA and will adjust slower to price action after consolidations.
What is Jurik Volty?
One of the lesser known qualities of Juirk smoothing is that the Jurik smoothing process is adaptive. "Jurik Volty" (a sort of market volatility ) is what makes Jurik smoothing adaptive. The Jurik Volty calculation can be used as both a standalone indicator and to smooth other indicators that you wish to make adaptive.
What is the Jurik Moving Average?
Have you noticed how moving averages add some lag (delay) to your signals? ... especially when price gaps up or down in a big move, and you are waiting for your moving average to catch up? Wait no more! JMA eliminates this problem forever and gives you the best of both worlds: low lag and smooth lines.
Ideally, you would like a filtered signal to be both smooth and lag-free. Lag causes delays in your trades, and increasing lag in your indicators typically result in lower profits. In other words, late comers get what's left on the table after the feast has already begun.
Included:
-Toggle on/off bar coloring
RedK Magic RibbonRedK Magic Ribbon is simple script that combines a fast and a slow moving averages to create a 2-Moving Average Cross-over / trend visualization tool.
We utilize the Compound Ratio Weighted Average (CoRa Wave) as the fast MA line and the RedK Slow Smooth Weighted Moving Average (RSS_WMA) aka LazyLine as the slow MA line.
i put this script together when i found that i started using these 2 moving average lines in my trading charts most of the time. thought others may find it useful.
The simple idea is that when the 2 lines "agree" on direction, then this is possibly a confirmed trend in that direction.
Visually, when the 2 lines agree on a trend direction, Magic Ribbon gives either a green (up) or red (down) fill, when they disagree, it gives a gray fill - Gray areas are considered "no trade" or "get ready" zones depending on the situation.
This ribbon can be used to support trend-following trades, swing trading, or as a visual trend tracking tool
Suggested Usage Tips:
----------------------------
* Position entry should be made as close to the RSS_WMA/LazyLine as possible to maximize gain.
* The RSS_WMA can act as a guide for Stop Loss
* An aggressive (or swing) trader may consider entries as soon as the CoRa Wave line changes color, but in context of the prevailing trend.
* if you intend to use this tool for trading, please test it using the PaperTrading or Rewind features of TV to get used to how it behaves and adjust accordingly.
* The Magic Ribbon should work on any timeframe.
* The basic settings are available - they enable adjusting the length and smoothness of the CoRa Wave and the Smoothness of the RSS_WMA - as well as the source price for each. Style settings enable to adjust color, line width, or hide/show various elements as needed.
* The most important tip for using the Magic Ribbon: when you first add it to your chart, is to fine-tune the length settings to your preference. start by adjusting the LazyLine (RSS_WMA) Smoothness value, so it tracks and barely touches the highs / lows of price bars - with the least amount of lag possible - then adjust the CoRa Wave length to make it as responsive as you need. Keep smoothness to the lowest you can use (i like 3 or 4 max) - the default settings are generic usable values based on my testing.
* as usual, please use this tool only as a guide - make your own detailed chart analysis and support your trading decision with signals and confirmations from other indicators .
*** This script does not repaint.

Liquidation Levels
I got sick of calculating leverage all of the time, so I made this real time calculator. It is primarily for crypto derivatives.
It tracks and displays the liquidation price for 5 customisable leverage levels and plots them either historically and/or in real time, with labels beside each including the estimated price.
These calculations include maintenance margin and can be configured for linear futures (USDT) or non-linear futures. Never again make dumb mistakes that are obvious with a bit of maths.
To jazz it up, you can customise the colours, disable various labels, set different leverage multiples, and change the offsets and number of bars to plot in the past.
Alternatively, you can change the offset to 24 on an hourly chart and change show last bars to 0. By doing this, you can see which levels most often get liquidated. It is crude, I know, and there are better tools for tracking liquidation hunts. This is not an attempt to replace or compete with them.
Enjoy and trade safely.

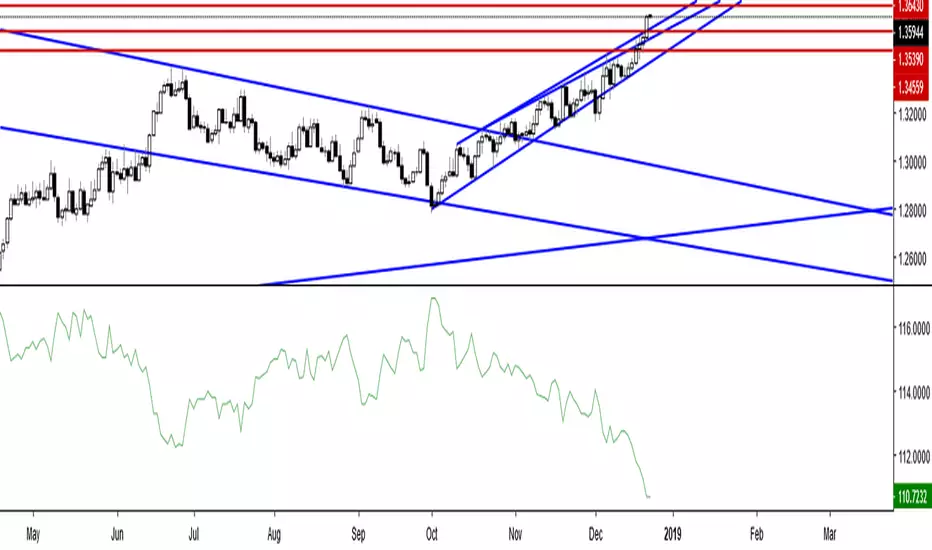
DollarChannelThis indicator just tracks lows/highs and "snaps a line" when the delta exceeds a buck (or whatever you configure) and starts tracking again from that new point.

Canadian Dollar Currency IndexCanadian Dollar Currency Index updates in real time and doesn't close like tradingview.com's currency indexes. Based off of the Bank of Canada's CEER methodology and tracks it quite closely, although not perfectly. It seems to be higher than the Bank of Canada's index by 2 points. This could be due to using different data for the currencies and as I am not proficient in PineScript, I don't think I was able to replicate the formula exactly...? Regardless ,it works well and is more than close enough to suit one's purpose of tracking the Canadian dollar against a basket of currencies that are weighted according to the Bank of Canada's total weights (The total weight of a country j in year t is a weighted average of the their import, export and third-market competition weights). For more information on the actual Bank of Canada's index: www.bankofcanada.ca
Custom Weekly Volume Profile [Multi-Timeframe]Description: This indicator renders a high-precision Weekly Volume Profile that resets at the start of every trading week. Unlike standard fixed-range profiles, this script builds the profile bar-by-bar using lower timeframe data (e.g., 1-minute or 5-minute data) to ensure accuracy even on higher timeframe charts.
It is designed for traders who track the developing value of the current week (Auction Market Theory) and need specific alerts when price tests the edges of value.
Key Features:
Developing Weekly Profile:
The profile resets automatically at the beginning of the week (Sunday/Monday).
It tracks the Point of Control (POC), Value Area High (VAH), and Value Area Low (VAL) in real-time as the week progresses.
Previous Week Levels:
The script automatically stores the final levels (POC, VAH, VAL) of the previous week and projects them forward. This allows you to trade tests of the prior week's value.
Auto-Scaling Histogram:
Smart Width: The profile starts wider at the beginning of the week (when data is sparse) and automatically shrinks as the week progresses (Thursday/Friday) to keep your chart clean and readable.
Advanced Alerting:
Crossover Alerts: Trigger alerts when price crosses the developing VAH/VAL or the previous week's levels.
Time Window Filter: Includes a session input (default 08:30-15:00) to restrict alerts to specific trading hours, preventing notifications during low-volume overnight sessions.
Customization:
Precision: Adjustable "Row Size" and "Calculation Timeframe" to tune performance vs. accuracy.
Visuals: Full color control over the Value Area, Outer Volume, and Level Lines.
Settings:
Calculation Precision: Determines the lower timeframe used to calculate the volume (e.g., set to "5" for 5-minute precision).
Value Area %: Default is 70%, standard for AMT trading.
Timezone: Adjustable to ensure the weekly reset aligns with your local exchange time (e.g., America/Chicago for CME Futures).
Disclaimer: This script is for educational and informational purposes only. It does not constitute financial advice, trading recommendations, or a solicitation to buy or sell any financial instrument. Trading futures and other financial markets involves significant risk and is not suitable for every investor. Past performance of any trading system or methodology is not necessarily indicative of future results. The user assumes all responsibility for any trading decisions made based on the information provided by this tool. Use at your own risk.

Global Macro Scanner & Relative PerformanceDescription: This indicator is an all-in-one Macro Dashboard that allows traders to track money flow across major global asset classes in real-time. It combines a floating data table with a normalized percentage-performance chart.
Features:
Macro Dashboard (Table): Displays the current value, daily % change, and status (Inflow/Outflow) for 9 key economic sectors:
US M2 Supply: Tracks monetary inflation/tightening.
DXY (US Dollar): Currency strength.
Bonds (AGG): US Aggregate Bond market.
Stocks (VT): Total World Stock Index.
Real Estate (VNQ): Vanguard Real Estate ETF.
Commodities: Oil (WTI), Gold, and Silver.
Crypto: Total Crypto Market Cap.
Relative Performance Chart (Lines): Instead of plotting raw prices (which have vastly different scales), this script plots the Percentage Return relative to a baseline.
Lookback Period: You can set a lookback (default 100 bars). The script sets the price 100 bars ago as "0%" and plots how much each asset has gained or lost since then.
Comparison: This allows you to visually see which assets are outperforming or underperforming relative to each other over the same time period.
Visual Aids:
Dynamic Labels: Each line is tagged with a label at the current candle so you can identify assets without needing a legend.
Colors: Each asset has a distinct, fixed color for consistency between the table and the chart.
How to use:
Add the script to your chart.
Adjust the "Lookback" setting in the inputs to change the starting point of the comparison (e.g., set it to the start of the year to see Year-to-Date performance).
Use the dashboard to spot daily money flow rotation (e.g., Money moving out of Stocks and into Gold).

KAMA Oscillator | IkkeOmarThis script transforms the Kaufman Adaptive Moving Average (KAMA) into an oscillator format, designed to visualize trend direction with reduced noise sensitivity. It operates in two modes: a Raw mode that tracks price levels directly, and a Normalized mode that bounds the oscillator between -1 and +1 for easier comparison across assets.
The calculations are the same as for the Normalized KAMA Oscillator, but I added a few features that users of the old version wouldn't necessarily want.
How it works
Efficiency Ratio (ER): The script calculates the "efficiency" of price movement by comparing the net direction of price to the total volatility over a set period.
Adaptive Smoothing:
When volatility is high but direction is unclear (choppy), the KAMA slows down to filter noise.
When price trends clearly, the KAMA speeds up to track the move.
Normalization (Optional): If enabled, the script takes the raw KAMA value and scales it relative to its highest and lowest points over the Normalization lookback period. The result oscillates between -1 (extreme low) and +1 (extreme high).
The SMA Signal Logic
The script allows you to overlay an SMA (Simple Moving Average) on the oscillator. This serves as a dynamic baseline for the oscillator's momentum.
Signal Generation: A signal is generated when the KAMA Oscillator crosses its SMA.
Bullish: Oscillator crosses above the SMA.
Bearish: Oscillator crosses below the SMA.
Lag vs. Noise Trade-off:
Advantage (Reduced Lag): Crossing the SMA often triggers a signal earlier than waiting for the oscillator to change color (slope change) or cross the zero line. It identifies when immediate momentum is outperforming the recent average.
Risk (Increased Noise): During consolidation, the oscillator will hover close to the SMA line. This increases the probability of "whipsaws" (false signals) where the line crosses back and forth rapidly without a sustained trend. This signal is aggressive and should be used with trend filters.
