Bollinger + EMA Strategy with StatsThis strategy is a mean-reversion trading model that combines Bollinger Band deviation entries with EMA-based exits. It enters a long position when the price drops significantly below the lower Bollinger Band by a user-defined multiple of standard deviation (x), and a short position when the price exceeds the upper band by the same logic. To manage risk, it uses a wider Bollinger Band threshold (y standard deviations) as a stop loss, while take profit occurs when the price reverts to the n-period EMA, indicating mean reversion. The strategy maintains only one active position at a time—either long or short—and allocates a fixed percentage of capital per trade. Performance metrics such as equity curve, drawdown, win rate, and total trades are tracked and displayed for backtesting evaluation.
Cerca negli script per "track"

VBSMI Strategy by QTX Algo SystemsVolatility Based SMI Strategy by QTX Algo Systems
Overview
The Volatility Based SMI Strategy transforms our popular VBSMI with Dynamic Bands indicator into a fully automated strategy that traders can backtest inside TradingView. It retains all core logic from the indicator—including adaptive volatility scaling and trend-based overbought/oversold thresholds—but adds two configurable entry methods, exit conditions, and a dual-mode trade execution engine.
This script is published separately from the VBSMI indicator because some traders use VBSMI as a confluence tool within their existing system, while others prefer a rules-based strategy that can be simulated, optimized, and tracked over time. This script serves the latter use case.
How It Works
Like the original indicator, this strategy uses:
Double-Smoothed SMI Calculation: Based on smoothed momentum using EMA of the relative and full range.
Adaptive Volatility Scaling: Uses a normalized BBWP-based factor to reflect current market volatility.
Dynamic Band Adjustment: Trend direction and strength shift overbought/oversold levels upward or downward.
Band Tilt & Compression Controls: Inputs allow users to define how aggressively the bands shift with trend conditions.
What’s different is the strategy layer—you now choose from two types of entry and exit logic, and two execution styles.
🛠️ Entry & Exit Modes
There are two logic modes for both entry and exit, allowing you to adapt the strategy to your own philosophy:
Cross Mode (SMI Crosses EMA):
Entry: Buy when SMI crosses above its EMA
Exit: Close when SMI crosses below its EMA
Exit OB/OS Mode (Band Exit Logic):
Entry: Buy when price exits dynamic oversold zone (crosses back above tilted oversold band)
Exit: Close when price exits dynamic overbought zone (crosses back below tilted overbought band)
You can mix and match the modes (e.g., enter on Cross, exit on Band Exit).
⚙️ Spot vs. Leverage Mode
Spot Mode
Designed for traders who prefer long-only setups
Enters a long position and holds until the exit condition is met
Prevents overlapping trades—ensures only one position at a time
Leverage Mode
Designed for those testing bi-directional systems (e.g., long/short switching)
Automatically flips between long and short entries depending on the signals
Useful for testing symmetrical strategies or inverse conditions
Both modes work across any asset class and timeframe.
Customization Options
Users can adjust:
Smoothing K/D: Controls how fast or slow the momentum reacts
SMI EMA Length: Determines the responsiveness of the signal line
Trend Lookback Period: Influences how stable the dynamic band tilt is
Band Tilt & Compression Strengths: Refines how far bands adjust based on trend
Entry/Exit Logic Type: Choose between “Cross” or “Exit OB/OS” logic
Trading Mode: Select either "Spot" or "Leverage" depending on your use case
Why It’s Published Separately
This script is not a cosmetic or minor variation of the original indicator. It introduces:
Entry/exit logic
Order execution
Strategy testing capabilities
Mode selection (Spot vs. Leverage)
Signal logic control (Cross vs. Band Exit)
Because the original VBSMI indicator is widely used as a charting and confirmation tool, converting it into a strategy changes how it functions. This version is intended for strategy evaluation and automation, while the original remains available for discretionary and visual use.
Use Cases
This strategy is best suited for:
Evaluating VBSMI-based signals in backtests
Comparing entry and exit logic over time
Testing setups on different assets and timeframes
Automating VBSMI-based logic in a structured and risk-aware framework
Disclaimer
This strategy is for educational purposes only. It does not guarantee future results or profitability. Always test in simulation before using any strategy live, and use proper risk management and trade discipline.

Stealth Trigger X🔰 Stealth Trigger X — Smart Divergence & Breakout Strategy with Trend Weakness Exit
Stealth Trigger X is a precision-engineered, non-repainting strategy designed for traders who rely on high-conviction breakouts and trend confirmation. Rather than relying on lagging or oversimplified signals, this strategy fuses divergence logic, volatility detection, volume filtering, and slope-based trend validation into one clean system — making it both responsive and reliable.
📌 Core Components (How It Works):
1. ZLEMA (Zero-Lag Exponential Moving Average):
Used as the primary trend baseline. Unlike a standard EMA, ZLEMA compensates for lag by using a double-smoothing technique that allows the strategy to detect trend direction changes sooner — especially useful in crypto and fast-moving markets.
2. Gradient Filter (Slope of ZLEMA):
Rather than waiting for price to cross a moving average, the strategy measures the slope of the ZLEMA itself. Positive slope = uptrend, negative slope = downtrend. This gives us early trend validation and exit signals based on weakening momentum.
3. Vortex Indicator (Directional Volatility):
A diff-based implementation of the Vortex Indicator is used to validate whether volatility is expanding in favor of the trend. This prevents false entries during indecision phases or low-momentum conditions.
4. White Line Bias Filter (Structural Trend):
The strategy calculates the midpoint of the highest high and lowest low over a user-defined period. This “White Line” serves as a structural trend bias, ensuring entries align with the broader context — not just momentary momentum.
5. Volume Spike Confirmation:
To avoid manipulation and choppy conditions, the strategy confirms breakouts only when the current bar’s volume exceeds the median volume of recent candles by a set multiplier. This filters out noise and ensures only high-conviction moves trigger entries.
6. Breakout with Divergence Timing:
A hybrid logic checks for price breaking previous range highs/lows (breakouts), combined with simulated divergence behavior based on RSI-like momentum. This helps align entry timing with areas where price is likely to accelerate.
⚙️ Trade Management Logic:
Entry Conditions:
Triggered when all conditions align: ZLEMA slope, Vortex confirmation, White Line bias, volume spike, and divergence-based breakout.
Take Profits:
TP1: 50% of position is closed using a limit order
TP2: Remaining 50% closed with another limit order
This split exit approach lets profits run while locking in gains early.
Exits on Trend Weakness:
If trend conditions weaken (slope flip or vortex flip), the position is exited before a full reversal occurs — helping protect capital during exhaustion phases.
Reentry Delay:
Enforces a 1-bar cooldown between exit and new entries to avoid “ping-pong” signals and maintain clean backtest results.
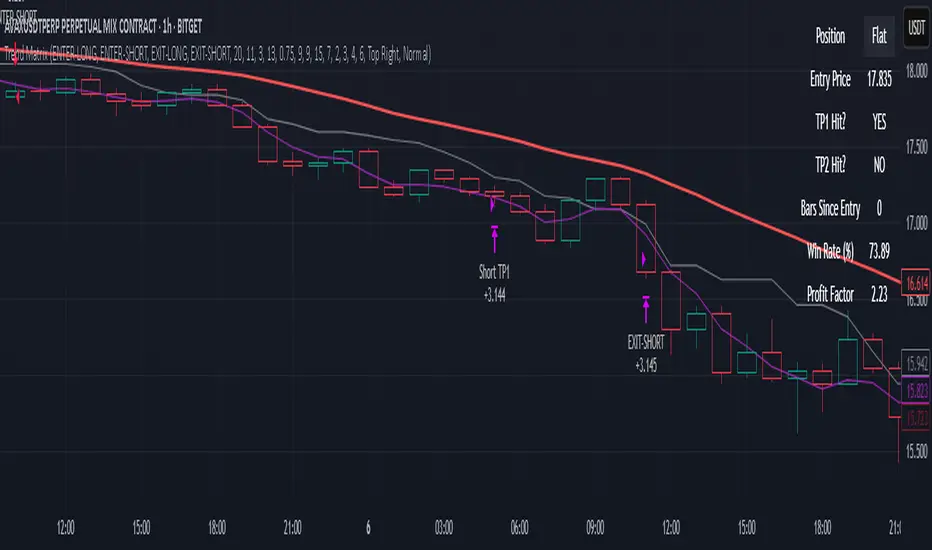
📊 Real-Time Dashboard (On-Chart):
Displays critical stats including:
Current position (Long, Short, or Flat)
Entry price
TP1 and TP2 hit status
Win rate (%)
Profit factor
Bars since entry
This makes live trading or visual backtesting easy to interpret and track.
✅ Key Facts:
Non-Repainting: All signals are calculated using confirmed bar data only. No future bars or security() functions are used.
Original Logic: This is not a generic mashup. Each component (ZLEMA slope, vortex diff, breakout divergence, volume spike filtering, White Line structure) is optimized to work in tandem.
Best Timeframes: 1H – 4H
Markets: Crypto, Forex, Indices — any market with trending behavior and measurable volume
⚠️ Disclaimer:
This strategy is for educational purposes only. It is not financial advice or a recommendation to trade. Past performance does not guarantee future results. Always trade with proper risk management and backtest strategies before live deployment.
🧠 Summary:
Stealth Trigger X is built for traders who want:
Precision entries
Early trend exits
Reliable backtest integrity
Clean logic with no repainting
It is especially effective in breakout environments where volume and momentum align — and excels at avoiding weak or manipulated trends.

Trend MatrixFinal TradingView-Compliant Description for Trend Matrix
Trend Matrix is a precision-engineered trend-following strategy built for high-confidence entries and tactical trade management.
This strategy combines multiple non-repainting filters, each with a distinct role, to form a unified "trend matrix" that confirms directional bias, volume commitment, and momentum strength — all before entry is considered.
🔍 Core Components & Why They’re Used
🧠 Gaussian Filter (Custom)
A smoothed Gaussian-weighted moving average is used to detect trend direction changes. Unlike standard EMAs, this filter minimizes lag while retaining smooth transitions — ideal for confirming trend shifts without false reversals.
📈 RMI Trend Memory
A Relative Momentum Index is used to validate trend direction persistence. RMI's ability to filter out short-term oscillations makes it ideal for confirming whether a trend is still active.
📊 Gradient Filter (ZLEMA-based)
Measures the slope of a ZLEMA-smoothed close. If slope flips, it signals a potential trend weakness. This provides real-time confirmation for entry or exit bias.
📉 Volume Spike Detection
Confirms that breakouts or trend continuations are supported by volume commitment. Uses a dynamic SMA-based volume filter with a user-defined multiplier.
🟦 White Line (Bias Midpoint)
This structural component calculates the midpoint of the highest high and lowest low over a range — providing directional context and helping eliminate trades in consolidation zones.
🎯 Entry Conditions
Long entries require:
Gaussian trend flip to the upside
RMI > 50 (bullish memory)
Volume spike confirmation
Positive gradient (ZLEMA slope)
Price above White Line (bias filter)
Short entries use the inverse logic.
All entries enforce a cooldown bar to prevent same-bar reversals or whipsaw trades.
🎯 Exit Conditions
Take Profit 1: 50% of position at +2%
Take Profit 2: Remaining 50% at +4%
Early Exit on Trend Weakness:
Position closes fully if the trend weakens (RMI flip or gradient reversal)
📊 Dashboard + Performance Tracking
The built-in dashboard shows:
Current Position
Entry Price
TP1/TP2 Hit Status
Bars Since Entry
Win Rate (%)
Profit Factor
Useful for manual tracking or live trading review.
🌐 Multi-Exchange Bot Compatibility
Trend Matrix is built with universal trade alerts using customizable comment= fields. This makes it compatible with any exchange-connected bot platform such as:
WunderTrading
3Commas
Alertatron
Cornix
Or any webhook-based trading system
Alerts are sent using the {{strategy.order.comment}} placeholder, allowing you to route entries and exits through your preferred exchange account on Binance, Bybit, OKX, Kraken, and others.
🛠️ Customization
All components are modular:
TP1/TP2 levels
Gaussian length & sigma
Volume spike filter sensitivity
Gradient & White Line length
RMI settings
You can tailor the strategy for different assets or timeframes — optimized for crypto 1H, but works with stocks, FX, or lower timeframes with adjusted parameters.
✅ Final Notes
Trend Matrix is not just a mashup — it's a synchronized system of filters with clear roles, designed to maximize trade confidence and minimize noise. Every layer of confirmation serves a purpose, making this a highly adaptive trend-following tool for any market environment.
⚠️ Disclaimer (as required by TradingView)
This script is for educational purposes only and does not constitute financial advice. Use at your own risk. Always test strategies thoroughly before applying them in live trading environments. Past performance is not indicative of future results.
Profit Trailing BBandsProfit Trailing Trend BBands v4.7.5 with Double Trailing SL
A TradingView Pine Script Strategy
Created by Kevin Bourn and refined with the help of Grok 3 (xAI)
Overview
Welcome to Profit Trailing Trend BBands v4.7.5, a dynamic trading strategy designed to ride trends and lock in profits with a unique double trailing stop-loss mechanism. Built for TradingView’s Pine Script v6, this strategy combines Bollinger Bands for trend detection with a smart trailing system that doubles down on profit protection. Whether you’re trading XRP or any other asset, this tool aims to maximize gains while keeping risk in check—all with a clean, visual interface.
What It Does
Identifies Trends: Uses Bollinger Bands to spot uptrends (price crossing above the upper band) and downtrends (price crossing below the lower band).
Enters Positions: Opens long or short trades based on trend signals, with customizable position sizing and leverage.
Trails Profits: Employs a two-stage trailing stop-loss:
Initial Trailing SL: Acts as a take-profit level, set as a percentage (%) or dollar ($) distance from the entry price.
Tightened Trailing SL: Once the initial profit target is hit, the stop-loss tightens to half the initial distance, locking in gains as the trend continues.
Manages Risk: Includes a margin call feature to exit losing positions before they blow up your account.
Visualizes Everything: Plots Bollinger Bands (blue upper, orange lower) and a red stepped trailing stop-loss line for easy tracking.
Why Built It?
Captures Trends: Bollinger Bands are a proven way to catch momentum, and we tuned them for responsiveness (short length, moderate multiplier).
Secures Profits: Traditional trailing stops often leave money on the table or exit too early. The double trailing SL first takes a chunk of profit, then tightens up to ride the rest of the move.
Stays Flexible: Traders can tweak price sources, stop-loss types (% or $), and position sizing to fit their style.
Looks Good: Clear visuals help you see the strategy in action without cluttering your chart.
Originally refined for XRP, it’s versatile enough for most markets — crypto, forex, stocks, you name it.
How It Works
Core Components
Bollinger Bands:
Calculated using a simple moving average (SMA) and standard deviation.
Default settings: 6-period length, 1.66 multiplier.
Upper Band (blue): SMA + (1.66 × StdDev).
Lower Band (orange): SMA - (1.66 × StdDev).
Trend signals: Price crossing above the upper band triggers a long, below the lower band triggers a short.
Double Trailing Stop-Loss:
Initial SL: Set via "Trailing Stop-Loss Value" (default 6% or $6). Trails the price at this distance and doubles as the first profit target.
Tightened SL: Once price hits the initial SL distance in profit (e.g., +6%), the SL tightens to half (e.g., 3%) and continues trailing, locking in gains.
Visualized as a red stepped line, only visible during active positions.
Position Sizing:
Choose "% of Equity" (default 30%) or "Amount in $" to set trade size.
Leverage (default 10x) amplifies positions, capped by available equity to avoid overexposure.
Margin Call:
Exits positions if drawdown exceeds the "Margin %" (default 10%) to protect your account.
Backtesting Filter:
Starts trading after a user-defined date (default: Jan 1, 2020) for focused historical analysis.
Trade Logic
Long Entry: Price crosses above the upper Bollinger Band → Closes any short position, opens a long.
Short Entry: Price crosses below the lower Bollinger Band → Closes any long position, opens a short.
Exit: Position closes when price hits the trailing stop-loss or triggers a margin call.
How to Use It
Setup
Add to TradingView:
Open TradingView, go to the Pine Editor, paste the script, and click "Add to Chart."
Ensure you’re using Pine Script v6 (the script includes @version=6).
Configure Inputs:
Start Date for Backtesting: Set the date to begin historical testing (default: Jan 1, 2020).
BB Length & Mult: Adjust Bollinger Band sensitivity (default: 6, 1.66).
BB Price Source: Choose the price for BBands (default: Close).
Trend Price Source: Choose the price for trend detection (default: Close).
Trailing Stop-Loss Type: Pick "%" or "$" (default: Trailing SL %).
Trailing Stop-Loss Value: Set the initial SL distance (default: 6).
Margin %: Define the max drawdown before exit (default: 10%).
Order Size Type & Value: Set position size as % of equity (default: 30%) or $ amount.
Leverage: Adjust leverage (default: 10x).
Run It:
Use the Strategy Tester tab to backtest on your chosen asset and timeframe.
Watch the chart for blue/orange Bollinger Bands and the red trailing SL line.
Tips for Traders
Timeframes: Works on any timeframe, but test 1H or 4H for XRP—great balance of signals and noise.
Assets: Optimized for XRP, but tweak slValue and mult for other markets (e.g., tighter SL for low-volatility pairs).
Risk Management: Keep marginPercent low (5-10%) for volatile assets; adjust leverage based on your risk tolerance.
Visuals: The red stepped SL line shows only during trades—zoom in to see its tightening in action.
Visuals on the Chart
Blue Line: Upper Bollinger Band (trend entry for longs).
Orange Line: Lower Bollinger Band (trend entry for shorts).
Red Stepped Line: Trailing Stop-Loss (shifts tighter after the first profit target).
Order Labels: Short tags like "OL" (Open Long), "CS" (Close Short), "LSL" (Long Stop-Loss), etc., mark trades.
Disclaimer
Trading involves risk. This strategy is for educational and experimental use—backtest thoroughly and use at your own risk. Past performance doesn’t guarantee future results. Not financial advice—just a tool from traders, for traders.

GQT GPT - Volume-based Support & Resistance Zones V2搞钱兔,搞钱是为了更好的生活。
Title: GQT GPT - Volume-based Support & Resistance Zones V2
Overview:
This strategy is implemented in PineScript v5 and is designed to identify key support and resistance zones based on volume-driven fractal analysis on a 1-hour timeframe. It computes fractal high points (for resistance) and fractal low points (for support) using volume moving averages and specific price action criteria. These zones are visually represented on the chart with customizable lines and zone fills.
Trading Logic:
• Entry: The strategy initiates a long position when the price crosses into the support zone (i.e., when the price drops into a predetermined support area).
• Exit: The long position is closed when the price enters the resistance zone (i.e., when the price rises into a predetermined resistance area).
• Time Frame: Trading signals are generated solely from the 1-hour chart. The strategy is only active within a specified start and end date.
• Note: Only long trades are executed; short selling is not part of the strategy.
Visualization and Parameters:
• Support/Resistance Zones: The zones are drawn based on calculated fractal values, with options to extend the lines to the right for easier tracking.
• Customization: Users can configure the appearance, such as line style (solid, dotted, dashed), line width, colors, and label positions.
• Volume Filtering: A volume moving average threshold is used to confirm the fractal signals, enhancing the reliability of the support and resistance levels.
• Alerts: The strategy includes alert conditions for when the price enters the support or resistance zones, allowing for timely notifications.
⸻
搞钱兔,搞钱是为了更好的生活。
标题: GQT GPT - 基于成交量的支撑与阻力区间 V2
概述:
本策略使用 PineScript v5 实现,旨在基于成交量驱动的分形分析,在1小时级别的图表上识别关键支撑与阻力区间。策略通过成交量移动平均线和特定的价格行为标准计算分形高点(阻力)和分形低点(支撑),并以自定义的线条和区间填充形式直观地显示在图表上。
交易逻辑:
• 进场条件: 当价格进入支撑区间(即价格跌入预设支撑区域)时,策略在没有持仓的情况下发出做多信号。
• 离场条件: 当价格进入阻力区间(即价格上升至预设阻力区域)时,持有多头头寸则会被平仓。
• 时间范围: 策略的信号仅基于1小时级别的图表,并且仅在指定的开始日期与结束日期之间生效。
• 备注: 本策略仅执行多头交易,不进行空头操作。
可视化与参数设置:
• 支撑/阻力区间: 根据计算得出的分形值绘制支撑与阻力线,可选择将线条延伸至右侧,便于后续观察。
• 自定义选项: 用户可以调整线条样式(实线、点线、虚线)、线宽、颜色及标签位置,以满足个性化需求。
• 成交量过滤: 策略使用成交量移动平均阈值来确认分形信号,提高支撑和阻力区间的有效性。
• 警报功能: 当价格进入支撑或阻力区间时,策略会触发警报条件,方便用户及时关注市场变化。
⸻

Aggressive Strategy for High IV Market### Strategic background
In a volatile high IV market, prices are volatile and market expectations of future uncertainty are high. This environment provides opportunities for aggressive trading strategies, but also comes with a high level of risk. In pursuit of a high Sharpe ratio (i.e., risk-adjusted return), we need to design a strategy that captures the benefits of market volatility while effectively controlling risk. Based on daily line cycles, I choose a combination of trend tracking and volatility filtering for highly volatile assets such as stocks, futures or cryptocurrencies.
---
### Strategy framework
#### Data
- Use daily data, including opening, closing, high and low prices.
- Suitable for highly volatile markets such as technology stocks, cryptocurrencies or volatile index futures.
#### Core indicators
1. ** Trend Indicators ** :
Fast Exponential Moving Average (EMA_fast) : 10-day EMA, used to capture short-term trends.
- Slow Exponential Moving Average (EMA_slow) : 30-day EMA, used to determine the long-term trend.
2. ** Volatility Indicators ** :
Average true Volatility (ATR) : 14-day ATR, used to measure market volatility.
- ATR mean (ATR_mean) : A simple moving average of the 20-day ATR that serves as a volatility benchmark.
- ATR standard deviation (ATR_std) : The standard deviation of the 20-day ATR, which is used to judge extreme changes in volatility.
#### Trading logic
The strategy is based on a trend following approach of double moving averages and filters volatility through ATR indicators, ensuring that trading only in a high-volatility environment is in line with aggressive and high sharpe ratio goals.
---
### Entry and exit conditions
#### Admission conditions
- ** Multiple entry ** :
- EMA_fast Crosses EMA_slow (gold cross), indicating that the short-term trend is turning upward.
-ATR > ATR_mean + 1 * ATR_std indicates that the current volatility is above average and the market is in a state of high volatility.
- ** Short Entry ** :
- EMA_fast Crosses EMA_slow (dead cross) downward, indicating that the short-term trend turns downward.
-ATR > ATR_mean + 1 * ATR_std, confirming high volatility.
#### Appearance conditions
- ** Long show ** :
- EMA_fast Enters the EMA_slow (dead cross) downward, and the trend reverses.
- or ATR < ATR_mean-1 * ATR_std, volatility decreases significantly and the market calms down.
- ** Bear out ** :
- EMA_fast Crosses the EMA_slow (gold cross) on the top, and the trend reverses.
- or ATR < ATR_mean-1 * ATR_std, the volatility is reduced.
---
### Risk management
To control the high risk associated with aggressive strategies, set up the following mechanisms:
1. ** Stop loss ** :
- Long: Entry price - 2 * ATR.
- Short: Entry price + 2 * ATR.
- Dynamic stop loss based on ATR can adapt to market volatility changes.
2. ** Stop profit ** :
- Fixed profit target can be selected (e.g. entry price ± 4 * ATR).
- Or use trailing stop losses to lock in profits following price movements.
3. ** Location Management ** :
- Reduce positions appropriately in times of high volatility, such as dynamically adjusting position size according to ATR, ensuring that the risk of a single trade does not exceed 1%-2% of the account capital.
---
### Strategy features
- ** Aggressiveness ** : By trading only in a high ATR environment, the strategy takes full advantage of market volatility and pursues greater returns.
- ** High Sharpe ratio potential ** : Trend tracking combined with volatility filtering to avoid ineffective trades during periods of low volatility and improve the ratio of return to risk.
- ** Daily line Cycle ** : Based on daily line data, suitable for traders who operate frequently but are not too complex.
---
### Implementation steps
1. ** Data Preparation ** :
- Get the daily data of the target asset.
- Calculate EMA_fast (10 days), EMA_slow (30 days), ATR (14 days), ATR_mean (20 days), and ATR_std (20 days).
2. ** Signal generation ** :
- Check EMA cross signals and ATR conditions daily to generate long/short signals.
3. ** Execute trades ** :
- Enter according to the signal, set stop loss and profit.
- Monitor exit conditions and close positions in time.
4. ** Backtest and Optimization ** :
- Use historical data to backtest strategies to evaluate Sharpe ratios, maximum retracements, and win rates.
- Optimize parameters such as EMA period and ATR threshold to improve policy performance.
---
### Precautions
- ** Trading costs ** : Highly volatile markets may result in frequent trading, and the impact of fees and slippage on earnings needs to be considered.
- ** Risk Control ** : Aggressive strategies may face large retracements and need to strictly implement stop losses.
- ** Scalability ** : Additional metrics (such as volume or VIX) can be added to enhance strategy robustness, or combined with machine learning to predict trends and volatility.
---
### Summary
This is a trend following strategy based on dual moving averages and ATR, designed for volatile high IV markets. By entering into high volatility and exiting into low volatility, the strategy combines aggressive and risk-adjusted returns for traders seeking a high sharpe ratio. It is recommended to fully backtest before implementation and adjust the parameters according to the specific market.

JMA Quantum Edge: Adaptive Precision Trading System JMA Quantum Edge: Adaptive Precision Trading System - Enhanced Visuals & Risk Management
Get ready to experience a groundbreaking trading strategy that adapts in real-time to market conditions! This powerful, open-source script combines advanced technical analysis with state-of-the-art risk management tools, designed to give you the edge you need in today's dynamic markets.
What It Does:
Adaptive JMA Indicator:
Utilizes a custom Jurik Moving Average (JMA) that adjusts its sensitivity based on market volatility, ensuring you get precise signals even in the most fluctuating environments.
Dynamic Risk Management:
Features built-in support for partial exits (scaling out) to secure profits, along with an optional Kelly Criterion-based position sizing that tailors your exposure based on historical performance metrics.
Robust Error Handling:
Incorporates market condition filters—like minimum volume and maximum allowed gap percentage—to ensure trades are only executed under favorable conditions.
Vivid Visual Enhancements:
Enjoy an animated background that reflects market momentum, dynamic pivot markers, and clearly drawn trend channels. Plus, interactive tables provide real-time performance analytics and detailed error metrics.
Fully Customizable:
With a comprehensive set of inputs, you can easily tailor the strategy to your personal trading style and market preferences. Adjust everything from JMA parameters to refresh intervals for tables and labels!
How to Use It:
Add the Script:
Copy and paste the script into the Pine Script Editor on TradingView and click “Add to Chart.”
Configure Your Settings:
Customize your risk management (capital, commission, position sizing, partial exits, etc.) and tweak the JMA settings to match your preferred trading style. Use the extensive input panel to adjust visuals, alerts, and more.
Backtest & Optimize:
Run the strategy in the Strategy Tester to analyze its historical performance. Monitor real-time analytics and error metrics via the interactive tables, and fine-tune your parameters for optimal performance.
Go Live with Confidence:
Once you're satisfied with the backtest results, use the generated signals for live trading, and let the system help you stay ahead in fast-paced markets!
How to use the imputs:
This cutting-edge strategy is designed to adapt to changing market conditions and offers you complete control over your trading parameters. Here’s a breakdown of what each group of inputs does and how you should use them:
Risk Management & Trade Settings
Recalculate on Every Tick:
What it does: When enabled, the strategy recalculates on every price update.
Recommendation: Leave it true for fast charts.
Initial Capital:
What it does: Sets your starting capital for backtesting, which influences position sizing and performance metrics.
Recommendation: Start with $10,000 (or adjust according to your trading capital).
Commission (%):
What it does: Simulates the cost per trade.
Recommendation: Use a realistic rate (e.g., 0.04%).
Position Size & Quantity Type:
What they do: Define how large each trade will be. Choose between a fixed unit amount or a percentage of equity.
Recommendation: For beginners, the default fixed value is a good start. Experiment later with percentage-based sizing if needed.
Order Comment:
What it does: Adds a label to your orders for easier tracking.
Allow Reverse Orders:
What it does: If disabled, the strategy will close opposing positions before entering a new trade, reducing conflicts.
Enable Dynamic Position Sizing:
What it does: Adjusts trade size based on current volatility.
Recommendation: Beginners may start with this disabled until they understand basic sizing.
Partial Exit Inputs:
What they do:
Enable Partial Exits: When turned on, you can scale out of your position to lock in profits.
Partial Exit Profit (%): The profit percentage that triggers a partial exit.
Partial Exit Percentage: The percentage of your current position to exit. Recommendation: Use defaults (e.g., 5% profit, 50% exit) to secure profits gradually.
Kelly Criterion Option:
What it does: When enabled, adjusts your position sizing using historical performance (win rate and profit factor).
Recommendation: Beginners might leave this disabled until comfortable with backtest performance metrics.
Market Condition Filters:
What they do:
Minimum Volume: Ensures trades occur only when there’s sufficient market activity.
Maximum Gap (%): Prevents trading if there’s an unusually large gap between the previous close and current open. Recommendation: Defaults work well for most markets. If trades seem erratic, consider tightening these limits.
JMA Settings
Price Source:
What it does: The input series for the JMA calculation, typically set to the closing price.
JMA Length:
What it does: Controls the smoothing period of the JMA. Lower values are more sensitive; higher values smooth out the noise. Recommendation: Start with 21.
JMA Phase & Power:
What they do: Adjust how responsive the JMA is. Phase controls timing; power adjusts the intensity. Recommendation: Default settings (63 phase and 3 power) are a balanced starting point.
Visual Settings & Style
Show JMA Line, Pivot Lines, and Pivot Labels:
What they do: Toggle visual elements on your chart for easier signal identification.
Pivot History Count:
What it does: Limits how many historical pivot markers are displayed.
Color Settings (Up/Down Neon Colors):
What they do: Set the visual cues for buy and sell signals.
Pivot Marker & Line Style:
What they do: Choose the style and thickness of your pivot markers and lines.
Show Stats Panel:
What it does: Displays real-time performance and error metrics.
Dynamic Background & Visual Enhancements
Animate Background:
What it does: Changes the background color based on market momentum.
Show Trend Channels & Volume Zones:
What they do: Draw trend channels and highlight areas of high volatility/volume.
Show Data-Rich Labels:
What it does: Displays key metrics like volume, error percentage, and momentum on the chart.
High Volatility Threshold:
What it does: Determines the multiplier for when the chart background should change due to high volatility.
Multi-Timeframe Settings
Higher Timeframe:
What it does: Uses a higher timeframe’s JMA for trend confirmation. Recommendation: Use Daily ('D') or Weekly ('W') for broader trend analysis.
Show HTF Trend Zone & Opacity:
What they do: Display a visual zone from the higher timeframe to help confirm trends.
6. Trailing Stop Settings
Trailing Stop ATR Factor & Offset Multiplier:
What they do: Calculate trailing stops based on the Average True Range (ATR), adjusting stop distances dynamically. Recommendation: Default settings are a good balance but can be fine-tuned based on asset volatility.
Alerts & Notifications
Alerts on Pivot Formation & JMA Crossover:
What they do: Notify you when key events occur.
Dynamic Power Threshold:
What it does: Sets the sensitivity for dynamic alerts.
8. Static Stop Loss / Take Profit
Static Stop Loss (%) & Take Profit (%):
What they do: Allow you to set fixed stop loss or take profit levels. Recommendation: Leave them at 0 to disable if you prefer dynamic risk management, or set them if you have strict risk/reward preferences.
Advanced Settings
ATR Length:
What it does: Determines the period for ATR calculation, impacting trailing stop sensitivity. Recommendation: Start with 14.
Optimization Feedback & Enhanced Error Analysis
Error Metric Length & Error Threshold (%):
What they do: Calculate error metrics (like average error, skewness, and kurtosis) to help you fine-tune the JMA. Recommendation: Use the defaults and adjust if the error metrics seem off during backtesting.
UI - User-Driven Tweaking & Table Customization
Parameter Tweaker Panel, Debug/Performance Table Settings:
What they do: Provide interactive tables that display real-time performance, error metrics, and allow you to monitor strategy parameters.
Refresh Frequency Options (Table & Label Refresh Intervals):
What they do: Set how often the tables and labels update.
Recommendation: Start with an interval of 1 bar; increase it if your chart is too busy.
Important for Beginners:
Default Settings:
All default values have been chosen for balanced performance across different markets. If you ever experience unexpected behavior, start by resetting the inputs to their defaults.
Step-by-Step Adjustments:
Experiment by changing one setting at a time while observing how the strategy’s signals and performance metrics change. This will help you understand the impact of each parameter.
Resetting to Defaults:
If things seem off or you’re not getting the expected results, you can always reset the indicator. Either reload the script or use the “Reset Inputs” option (if available) to revert to the default settings.
Jump in, experiment, and enjoy the power of adaptive precision trading. This strategy is built to grow with your skills—have fun exploring and refining your trading edge!
Happy trading!

Pure Price Action Breakout with 1:5 RR
Description of the Price Action Trading Script (Pine Script v6)
Overview
This script is a pure price action-based breakout strategy designed for TradingView. It identifies key breakout levels and executes long and short trades based on market structure. The strategy ensures a minimum risk-to-reward ratio (RR) of 1:5, aiming for high profitability with well-defined stop-loss and take-profit levels.
How the Script Works
1️⃣ Breakout Identification
The script uses a lookback period to find the highest high and lowest low over the last n bars.
A bullish breakout occurs when the price closes above the previous highest high.
A bearish breakout happens when the price closes below the previous lowest low.
2️⃣ Entry & Exit Strategy
Long Entry: If a bullish breakout is detected, the script enters a long position.
Short Entry: If a bearish breakout is detected, the script enters a short position.
The stop-loss is placed at the recent swing low (for long trades) or recent swing high (for short trades).
The target price is calculated based on a risk-to-reward ratio of 1:5, ensuring profitable trades.
3️⃣ Risk Management
The stop-loss prevents excessive losses by exiting trades when the market moves unfavorably.
The strategy ensures that each trade has a reward potential at least 5 times the risk.
Positions are executed based on price action only, without indicators like moving averages or RSI.
4️⃣ Visual Representation
The script plots breakout levels to help traders visualize potential trade setups.
Entry points, stop-loss, and take-profit levels are labeled on the chart for easy tracking.
Key Features & Benefits
✔ Pure Price Action – No lagging indicators, only real-time price movements.
✔ High Risk-to-Reward Ratio (1:5) – Ensures high-profit potential trades.
✔ Real-time Entry & Exit Signals – Provides accurate trade setups.
✔ Dynamic Stop-loss Calculation – Adjusts based on recent market structure.
✔ Customizable Parameters – Lookback periods and risk ratios can be modified.

TDGS Dynamic Grid Trading Strategy [CoinFxPro]Advanced Dynamic Grid Trading Strategy
Logic and Working Principle:
This strategy uses a dynamic grid system to support both long and short trades. Grid trading aims to capitalize on price fluctuations within a predefined range by executing buy and sell orders systematically. The system calculates grid levels based on a base price and dynamically trades within these levels.
Grid Levels:
Grid levels are calculated based on the initial price and the user-defined grid spacing percentage.
Long Mode: Buys when the price decreases and sells when the price increases.
Short Mode: Sells when the price increases and buys when the price decreases.
Grid Updates:
Grid levels are recalculated based on the market price when the price moves by a user-defined update percentage.
For example;
In Long mode, when the price shows an upward trend, that is, when it rises by the Grid Update Percentage specified by the user, Grid levels are recreated and trades are made according to the new grid levels. While the price and grid levels are updated according to the new price, the Stop level is also updated upwards and the stop is followed with the TrailingStop logic.
In short mode, the same system operates with reverse logic. In other words, as prices decrease downwards, the grids are updated downwards when the Grid update percentage determined by the user decreases. The stop level is also updated accordingly.
The difference of the strategy from other Gridbots is that the grid levels are automatically updated and the levels are recreated with the price percentage difference determined by the user. Old levels can be tracked on the chart.
As the price updates, the self-updating grid levels are updated upwards in long mode and downwards in short mode.
The number of buying lots and selling lots are separated, allowing both trading within the position and the opportunity to collect lots and increase the position.
When trading with the grid trading logic, when buying and selling between grids, there is no repeated purchase at the same level unless there is a sale at the upper grid level. In this way, each level will be traded within itself.
For example, in a long condition, when the price is going up, after deducting the selling lot from the buying lot at each level, the remaining lots will be collected while the price is going up and an opportunity will be provided from the price rise.
Different preferences have been added to the profit taking conditions, allowing the robot to continue or stop after profit taking, if desired.
The system, which acts entirely according to user parameters, constantly updates itself as long as it moves in the direction determined by itself, and in these conditions, transactions are carried out according to profit or stop conditions.
Parameters:
Grid Parameters:
Settings such as buy lot size, sell lot size, grid count, and grid spacing percentage allow flexibility and customization.
Risk Management:
Stop loss (%) and take profit (%) levels help limit potential losses and secure profits at predefined thresholds.
Objective:
The goal of this strategy is to systematically capitalize on market price fluctuations through automated grid trading. This method is particularly effective in volatile markets where the price oscillates within a specific range.
The strategy works with a complete algorithm logic, and in appropriate instruments (especially instruments with depth and transaction volume should be preferred), buying and selling transactions are made according to the parameters determined at the beginning, and if the conditions go beyond the conditions, the stop is made, and when the profit taking conditions are met, it takes profit and prices according to the determined value. When it is updated, the values are updated again and the parameter works algorithmically.
Risk Management Recommendations:
Initial Capital: Grid trading involves frequent transactions, so sufficient initial capital is essential.
Stop Loss: Always set stop loss levels to prevent significant losses.
Grid Count and Spacing: A higher number of grids provides more trading opportunities but using grids that are too close may increase transaction costs due to small price movements.
First of all, it is important for risk management that you choose instruments that have depth and high transaction volume.
Strategy results may differ as a result of the parameters entered. Therefore, before trading in your real account, it is recommended that you start real transactions after backtesting with different parameters.
If you are stuck on something, you can mention it in the comments.

Fractional Accumulation Distribution Strategy🔹 INTRODUCTION:
As traders and investors, we often find ourselves searching for ways to maximize our market positioning—trying to capture the best price, manage risk, and adapt to ever-changing volatility. Through years of working with a variety of traders and investors, a common theme emerged: the most successful market participants were those who accumulated positions strategically over time, rather than relying on one-off, rigid entry points. However, even the best of them struggled to consistently time their entries and exits for optimal results.
That's why I created the Fractional Accumulation/Distribution Strategy (FADS)—an adaptable solution designed to dynamically adjust position sizing and entry points based on changing market conditions, enabling both passive and active market participants to optimize their approach.
The FADS trading strategy combines volatility-based trend detection and adaptive position scaling to maximize profitability across varied market conditions. By using the price ranges from higher timeframes, FADS pinpoints extreme demand and supply zones with a high statistical probability of reversal, making it effective in both high and low volatility environments. By applying adjustable threshold settings, users can focus on meaningful price movements to reduce unnecessary trades. Adaptive position scaling further enhances this approach by adjusting position sizes based on entry level distances, allowing for strategic position building that balances risk and reward in uncertain markets. This systematic scaling begins with smaller positions, expanding as the trend solidifies, creating a refined, robust trading experience.
🔹 FEATURES:
Multi-Timeframe Volatility-Based Trend Detection
Accumulation/Distribution Level Filter
Customizable Period for Highest/Lowest Prices Capture
Adjustable Sensitivity & Frequency in Positioning
Broad control settings of Strategy
Adaptive Position Scaling
🔹 SETTINGS:
Volatility : Determines trading range based on market volatility . Highest range value number of periods.
Factor : Adjusts the width of the Accumulation & Distribution bands separately. The Level Filter feature offers customizable triggering bands, allowing users to fine-tune the initiation point for the Accumulation/Distribution sequence. This flexibility enables traders to align entries more precisely with market conditions, setting optimal thresholds for initiating trade chains, whether in accumulating positions during uptrends or distributing in downtrends.
Lowest : Choose the price source (e.g., Close, Low). Number of bars considered when determining the lowest price level. Selecting the checkbox generate a signal when the price crosses below the previous lowest value for calculating the lowest value used for trade signals.
Highest : Choose the price source (e.g., Close, High). Number of bars considered when determining the highest price levels. Selecting the checkbox generate a signal when the price crosses above the previous highest value for calculating the highest value used for trade signals.
Accumulation Spread : Adjusts the buying frequency sensitivity by setting the distance between entries based on personal risk tolerance. Larger values for less frequent buys; smaller values for more frequent buys.
Distribution Spread : Adjusts the selling frequency sensitivity by setting the distance between exits based on reward preference. Larger values for less frequent sells; smaller values for more frequent sells.
Percentage of Capital Allocation : Sets the portion of total capital used for the initial trade in a strategy. It sets the scale for subsequent trades during accumulation phase.
🔹 APPLICATIONS:
❖ Accumulation and Distribution Phases
Early entries are avoided by initiating accumulation only after a trend reversal is confirmed and price breaks below long-term range.
Position sizes are determined by the distance between consecutive trades, smaller distance results in smaller position sizes and vice versa.
Average position cost is reduced by accumulating larger positions at the lower prices, potentially resulting in improved profitability.
Early exits are avoided by initiating distribution only after trend reversal is confirmed and price breaks above long-term range.
The pace of distribution can be tracked by the violet line that represents average positions during distribution phase
❖ Use Cases (Different than default setting input is used for illustration purposes)
If the starting point of accumulation starts too high for the risk preference, Accumulation Level Filter can be lowered by increasing the 🟢 threshold Factor.
If the starting point of distribution is too low for the reward preference, the Distribution Level Filter can be raised by increasing the 🔴 threshold Factor.
In lower timeframes, positions during the accumulation phase could be purchased at higher levels relative to prior entry positions. To optimize for this, consider extending the period used to capture the lowest prices. Similarly, during the distribution phase, increasing the period for identifying higher prices can improve accuracy.
🔹 Strategy Properties:
Adjusting properties within the script settings is recommended to align with specific accounts and trading platforms, ensuring realistic strategy results.
Balance (default): $100,000
Initial Order Size: 1% of the default balance
Commission: 0.1%
Slippage: 5 Ticks
Backtesting: Backtested using TradingView’s built-in strategy testing tool with default commission rates of 0.1% and slippage of 5 ticks. It reflects average market conditions for Apple Inc. (APPL) on 1-hour timeframe
Disclaimers: Commission and slippage varies with market conditions and brokerage policies. The assumed value may not represent all trading environments.
PAST PERFORMANCE DOESN’T GUARANTEE FUTURE RESULTS!
Disclaimer: Please remember that past performance may not be indicative of future results. Due to various factors, including changing market conditions, the strategy may no longer perform as well as in historical backtesting. This post and the script don’t provide any financial advice.
This invite-only script is being published as part of my commitment to developing tools that align with TradingView’s community standards. Access requests will be reviewed carefully after the script passes TradingView's moderation process.

Trend Signals with TP & SL [UAlgo] StrategyThe "Trend Signals with TP & SL Strategy" is a trading strategy designed to capture trend continuation signals while incorporating sophisticated risk management techniques. This strategy is tailored for traders who wish to capitalize on trending market conditions with precise entry and exit points, automatically calculating Take Profit (TP) and Stop Loss (SL) levels based on either Average True Range (ATR) or percentage values. The strategy aims to enhance trade management by preventing multiple simultaneous positions and dynamically adapting to changing market conditions.
This strategy is highly configurable, allowing traders to adjust sensitivity, the ATR calculation method, and the cloud moving average length. Additionally, the strategy can display buy and sell signals directly on the chart, along with visual representation of entry points, stop losses, and take profits. It also features a cloud-based trend analysis using a MACD-driven color fill that indicates the strength and direction of the trend.
🔶 Key Features
Configurable Trend Continuation Signals:
Source Selection: The strategy uses the midpoint of the high-low range as the default source, but it is adjustable.
Sensitivity: The sensitivity of the trend signals can be adjusted using a multiplier, ranging from 0.5 to 5.
ATR Calculation: The strategy allows users to choose between two ATR calculation methods for better adaptability to different market conditions.
Cloud Moving Average: Traders can adjust the cloud moving average length, which is used in conjunction with MACD to provide a visual trend indication.
Take Profit & Stop Loss Management:
ATR-Based or Percent-Based: The strategy offers flexibility in setting TP and SL levels, allowing traders to choose between ATR-based multipliers or fixed percentage values.
Dynamic Adjustment: TP and SL levels are dynamically adjusted according to the selected method, ensuring trades are managed based on real-time market conditions.
Prevention of Multiple Positions:
Single Position Control: To reduce risk and enhance strategy reliability, the strategy includes an option to prevent multiple positions from being opened simultaneously.
Visual Trade Indicators:
Buy/Sell Signals: Clearly displays buy and sell signals on the chart for easy interpretation.
Entry, SL, and TP Lines: Draws lines for entry price, stop loss, and take profit directly on the chart, helping traders to monitor trades visually.
Trend Cloud: A color-filled cloud based on MACD and the cloud moving average provides a visual cue of the trend’s direction and strength.
Performance Summary Table:
In-Chart Statistics: A table in the top right of the chart displays key performance metrics, including total trades, wins, losses, and win rate percentage, offering a quick overview of the strategy’s effectiveness.
🔶 Interpreting the Indicator
Trend Signals: The strategy identifies trend continuation signals based on price action relative to an ATR-based threshold. A buy signal is generated when the price crosses above a key level, indicating an uptrend. Conversely, a sell signal occurs when the price crosses below a level, signaling a downtrend.
Cloud Visualization: The cloud, derived from MACD and moving averages, changes color to reflect the current trend. A positive cloud in aqua suggests an uptrend, while a red cloud indicates a downtrend. The transparency of the cloud offers further nuance, with more solid colors denoting stronger trends.
Entry and Exit Management: Once a trend signal is generated, the strategy automatically sets TP and SL levels based on your chosen method (ATR or percentage). The stop loss and take profit lines will appear on the chart, showing where the strategy will exit the trade. If the price reaches either the SL or TP, the trade is closed, and the respective line is deleted from the chart.
Performance Metrics: The strategy’s performance is tracked in real-time with an in-chart table. This table provides essential information about the number of trades executed, the win/loss ratio, and the overall win rate. This information helps traders assess the strategy's effectiveness and make necessary adjustments.
This strategy is designed for those who seek to engage with trending markets, offering robust tools for entry, exit, and overall trade management. By understanding and leveraging these features, traders can potentially improve their trading outcomes and risk management.
🔷 Related Script
🔶 Disclaimer
Use with Caution: This indicator is provided for educational and informational purposes only and should not be considered as financial advice. Users should exercise caution and perform their own analysis before making trading decisions based on the indicator's signals.
Not Financial Advice: The information provided by this indicator does not constitute financial advice, and the creator (UAlgo) shall not be held responsible for any trading losses incurred as a result of using this indicator.
Backtesting Recommended: Traders are encouraged to backtest the indicator thoroughly on historical data before using it in live trading to assess its performance and suitability for their trading strategies.
Risk Management: Trading involves inherent risks, and users should implement proper risk management strategies, including but not limited to stop-loss orders and position sizing, to mitigate potential losses.
No Guarantees: The accuracy and reliability of the indicator's signals cannot be guaranteed, as they are based on historical price data and past performance may not be indicative of future results.

Gann Swing Strategy [1 Bar - Multi Layer]Use this Strategy to Fine-tune inputs for your Gann swing strategy.
Strategy allows you to fine-tune the indicator for 1 TimeFrame at a time; cross Timeframe Input fine-tuning is done manually after exporting the chart data.
MEANINGFUL DESCRIPTION:
The Gann Swing Chart using the One-Bar type, also known as the Minor Trend Chart, is designed to follow single-bar movements in the market. It helps identify trends by tracking price movements. When the market makes a higher high than the previous bar from a low price, the One-Bar trend line moves up, indicating a new high and establishing the previous low as a One-Bar bottom. Conversely, when the market makes a lower low than the previous bar from a high price, the One-Bar swing line moves down, marking a new low and setting the previous high as a One-Bar top. The crossing of these swing tops and bottoms indicates a change in trend direction.
HOW TO USE THE INDICATOR / Gann-swing Strategy:
The indicator shows 1, 2, and 3-bar swings. The strategy triggers a buy when the price crosses the previously determined high.
HOW TO USE THE STRATEGY:
Strategy to Fine-Tune Inputs for Your Gann Swing Strategy
This strategy allows for the fine-tuning of indicators for one timeframe at a time. Cross-timeframe input fine-tuning is done manually after exporting the chart data.
Meaningful Description:
The Gann Swing Chart using the One-Bar type, also known as the Minor Trend Chart, is designed to follow single-bar movements in the market. It helps identify trends by tracking price movements. When the market makes a higher high than the previous bar from a low price, the One-Bar trend line moves up, indicating a new high and establishing the previous low as a One-Bar bottom. Conversely, when the market makes a lower low than the previous bar from a high price, the One-Bar swing line moves down, marking a new low and setting the previous high as a One-Bar top. The crossing of these swing tops and bottoms indicates a change in trend direction.
How to Use the Indicator / Gann-Swing Strategy:
The indicator shows 1, 2, and 3-bar swings. The strategy triggers a buy when the price crosses the previously determined high.
How to Use the Strategy:
The strategy initiates a buy if the price breaks 1, 2, or 3-bar highs, or any combination thereof. Use the inputs to determine which highs or lows need to be crossed for the strategy to go long or short.
ORIGINALITY & USEFULNESS:
The One-Bar Swing Chart stands out for its simplicity and effectiveness in capturing minor market trends. Developed by meomeo105, this Gann high and low algorithm forms the basis of the strategy. I used my approach to creating strategy out of Gann swing indicator.
DETAILED DESCRIPTION:
What is a Swing Chart?
Swing charts help traders visualize price movements and identify trends by focusing on price highs and lows. They are instrumental in spotting trend reversals and continuations.
What is the One-Bar Swing Chart?
The One-Bar Swing Chart, also known as the Minor Trend Chart, follows single-bar price movements. It plots upward swings from a low price when a higher high is made, and downward swings from a high price when a lower low is made.
Key Features:
Trend Identification : Highlights minor trends by plotting swing highs and lows based on one-bar movements.
Simple Interpretation : Crossing a swing top indicates an uptrend, while crossing a swing bottom signals a downtrend.
Customizable Periods : Users can adjust the period to fine-tune the sensitivity of the swing chart to market movements.
Practical Application:
Bullish Trend : When the One-Bar Swing line moves above a previous swing top, it indicates a bullish trend.
Bearish Trend : When the One-Bar Swing line moves below a previous swing bottom, it signals a bearish trend.
Trend Reversal : Watch for crossings of swing tops and bottoms to detect potential trend reversals.
The One-Bar Swing Chart is a powerful tool for traders looking to capture and understand market trends. By following the simple rules of swing highs and lows, it provides clear and actionable insights into market direction.
Why the Strategy Uses 100% Allocation of a Portfolio:
This strategy allocates 100% of the portfolio to trading this specific pair, which does not mean 100% of all capital but 100% of the allocated trading capital for this pair. The strategy is swing-based and does not use take profit (TP) or stop losses.

Strategy SEMA SDI WebhookPurpose of the Code:
The strategy utilizes Exponential Moving Averages (EMA) and Smoothed Directional Indicators (SDI) to generate buy and sell signals. It includes features like leverage, take profit, stop loss, and trailing stops. The strategy is intended for backtesting and automating trades based on the specified indicators and conditions.
Key Components and Functionalities:
1.Strategy Settings:
Overlay: The strategy will overlay on the price chart.
Slippage: Set to 1.
Commission Value: Set to 0.035.
Default Quantity Type: Percent of equity.
Default Quantity Value: 50% of equity.
Initial Capital: Set to 1000 units.
Calculation on Order Fills: Enabled.
Process Orders on Close: Enabled.
2.Date and Time Filters:
Inputs for enabling/disabling start and end dates.
Filters to execute strategy only within specified date range.
3.Leverage and Quantity:
Leverage: Adjustable leverage input (default 3).
USD Percentage: Adjustable percentage of equity to use for trades (default 50%).
Initial Capital: Calculated based on leverage and percentage of equity.
4.Take Profit, Stop Loss, and Trailing Stop:
Inputs for enabling/disabling take profit, stop loss, and trailing stop.
Adjustable parameters for take profit percentage (default 25%), stop loss percentage (default 4.8%), and trailing stop percentage (default 1.9%).
Calculations for take profit, stop loss, trailing price, and maximum profit tracking.
5.EMA Calculations:
Fast and slow EMAs.
Smoothed versions of the fast and slow EMAs.
6.SDI Calculations:
Directional movement calculation for positive and negative directional indicators.
Difference between the positive and negative directional indicators, smoothed.
7.Buy/Sell Conditions:
Long (Buy) Condition: Positive DI is greater than negative DI, and fast EMA is greater than slow EMA.
Short (Sell) Condition: Negative DI is greater than positive DI, and fast EMA is less than slow EMA.
8.Strategy Execution:
If buy conditions are met, close any short positions and enter a long position.
If sell conditions are met, close any long positions and enter a short position.
Exit conditions for long and short positions based on take profit, stop loss, and trailing stop levels.
Close all positions if outside the specified date range.
Usage:
This strategy is used to automate trading based on the specified conditions involving EMAs and SDI. It allows backtesting to evaluate performance based on historical data. The strategy includes risk management through take profit, stop loss, and trailing stops to protect gains and limit losses. Traders can customize the parameters to fit their specific trading preferences and risk tolerance. Differently, it can perform leverage analysis and use it as a template.
By using this strategy, traders can systematically execute trades based on technical indicators, helping to remove emotional bias and improve consistency in trading decisions.
Important Note:
This script is provided for educational and template purposes and does not constitute financial advice. Traders and investors should conduct their research and analysis before making any trading decisions.

Short Selling EMA Cross (By Coinrule)BINANCE:AVAXUSDT
This short selling script works best in periods of downtrends and general bearish market conditions, with the ultimate goal to sell as the the price decreases further and buy back before a rebound.
This script can work well on coins you are planning to hodl for long-term and works especially well whilst using an automated bot that can execute your trades for you. It allows you to hedge your investment by allocating a % of your coins to trade with, whilst not risking your entire holding. This mitigates unrealised losses from hodling as it provides additional cash from the profits made. You can then choose to to hodl this cash, or use it to reinvest when the market reaches attractive buying levels.
Entry
The exponential moving average ( EMA ) 20 and EMA 50 have been used for the variables determining the entry to the short. EMAs can operate better than simple moving averages due to the additional weighting placed on the most recent data points, whereas simple moving averages weight all the data the same. This means that price is tracked more closely and the most recent volatile moves can be captured and exploited more efficiently using EMAs.
Our backtesting data revealed that the most profitable timeframe was the 30-minute timeframe, this also enabled a good frequency of trades and high profitability.
A fast (shorter term) exponential moving average , in this strategy the EMA 20, crossing under a slow (longer term) moving average, in this example the EMA 50, signals the price of an asset has started to trend to the downside, as the most recent data signals price is declining compared to earlier data. The entry acts on this principle and executes when the EMA 20 crosses under the EMA 50.
Enter Short: EMA 20 crosses under EMA 50.
Exit
This script utilises a take profit and stop loss for the exit. The take profit is set at -8% and the stop loss is set at +16% from the entry price. This would normally be a poor trade due to the risk:reward equalling 0.5. However, when looking at the backtesting data, the high profitability of the strategy (93.33%) leads to increased confidence and showcases the high probability of success according to historical data.
The take profit (-8%) and the stop loss (+16%) of the strategy are widely placed to ensure the move is captured without being stopped out due to relief rallies. The stop loss also plays a role of mitigating losses and minimising risk of being stuck in a short position once there has been a fundamental trend reversal and the market has become bullish .
Exit Short: -8% price decrease from entry price.
OR
Exit Short: +16% price increase from entry price.
Tip: Research what coins have consistent and large token unlocks / highly inflationary tokenomics, and target these during bear markets to short as they will most likely have substantial selling pressure that outweighs demand - leading to declining prices.
The strategy assumes each order is using 30% of the available coins to make the results more realistic and to simulate you only ran this strategy on 30% of your holdings. A trading fee of 0.1% is also taken into account and is aligned to the base fee applied on Binance.
The backtesting data was recorded from December 1st 2021, just as the market was beginning its downtrend. We therefore recommend analysing the market conditions prior to utilising this strategy as it operates best on weak coins during downtrends and bearish conditions.

QaSH Momentum EntriesThis script implements a variation of the Rob Hoffman's Inventory Retracement strategy, with entries being triggered by inventory retracement candles. Various confirmation parameters are available, such as
EMA slope for momentum confirmation
multi-timeframe EMA
multi-timeframe Ehler's mother of all moving averages
volume confirmation
Position management tools include
up to 3 orders can be tracked simultaneously and independently as a method of pyramiding into and out of a position
unique order ID's that pass along into the alert message (for helping the automation service manage positions)
entry filters based on current position profit
entry filters based on entry frequency
trade timers that can end a position after a specified amount of time
moving the stoploss when in profit
various parameters can be passed along into the alerts

xGhozt Consecutive Candle Count - BacktestxGhozt Consecutive Candle Count with Backtest simply counts consecutive positive or negative candles, and allows you to get the live statistics of how many times this consecutive candle series occurred in the past, with the probabilities of the next candle to be a reversal, and the average past gains from that reversal. You can select the number of consecutive candles you're tracking, and select a start and end date. When your desired pattern is met by the indicator, it will indicate you on the chart if it's worth shorting or longing the next candle.
You also have the possibility to set up alerts when your consecutive candles patterns are met. To do so, go into the indicator's settings, select your time frame, the consecutive number of candles you are tracking, your success rate, and the number this pattern occurred in the past. Once it's done, open the alerts box, and set up your alerts accordingly.
You will have 2 options:
- Green Candles Followed by Red = short next candle.
- Red Candles Followed by Green = long next candle
Now that the backtest is added, you can try different combinations and figure the best outcome to get the best returns!
One thing to note with the backtest: you cannot run the backtest with take profits / stop loss AND candle closing, it has to be one of the two.

Trailing SL Strategy [QuantNomad]I'm a big fan of simple strategies.
This one is a very simple one. So it consists only from one Trailing SL. When SL is hit, the position is reversed and SL is tracked for a new position.
You can choose one of 3 types of SL:
% of your price
ATR - it is calculated as current ATR * multiplier
Absolute
As you can see even this simple strategy can show pretty good results.
TrendMaster, v. 5.1TrendMaster (ver 5.0, a.k.a. "Mr. T") is a trend-anticipating system which shows eye-popping results. Rather than a simple "trend-rider" which continually lags, TrendMaster uses pattern recognition to anticipate trend changes. It hunts for turns in market cycles using a proprietary decision matrix of 27 "trade triggers" (variants of classic technical indicators). In backtesting the annualized return (July 2017-July2018) of the top 100 largest capitalized equities, not only did its results beat the indexes, but it outstripped a buy-and-hold strategy by a whopping 700%: i.e., while the 100 largest equities had an average annual yield of 17%, the strategy produced a 129% return across the entire range of stocks.* Even more staggering results can be seen when using the system in strongly-trending markets like cryptos. (See, for instance, the particularly stunning results for Bitcoin Cash in the screen shot at the end). [ ]
The following charts give you some sample tests of best performing (top chart) and worst performing (bottom chart) equities, ETFs, and cryptos (July 2017-July2018 time range).
TrendMaster / "Mr T" 5.1, Example Annualized returns
>>> Higher Performing Instruments (best performing interval between 15min - 1 day) <<<
Symbol Description Interval % Return Trades % Profitable Profit Factor Max Drawdown Sharpe Ratio Buy & Hold
DUST 3x Short Gold miners 30 min 3050% 421 43% 1.5 ( -17% ) 1.8 ( - 27 % )
NUGT 3x Long Gold miners 15 min 3300% 423 44 1.2 ( -11% ) 1.2 ( - 10 % )
APPL Apple, Inc 1 hour 118% 354 46 2.2 ( -6% ) 1.3 32%
GOOG Alphabet, Inc 30 min 128% 660 44 1.9 ( -5% ) 1 27%
BABA Alibaba Group 30 min 389% 642 46 2.3 ( -3% ) 1.6 37%
BTC/USDT Bitcoin 1 hour 1000000% 1573 53 3.1 ( -8% ) 1 57%
ETH/USDT Ethereum 1 hour 13000000% 1533 55 3.2 ( -12% ) 1.2 56%
LTC/ USDT Litecoin 30 min 5000000% 1946 54 2.8 ( -12% ) 1.2 ( - 71% )
>>> Lower Performing Instruments and/or Lower Performing Market Settings (worst performing interval between 15 min - 1 day) <<<
Symbol Description Interval % Return Trades % Profitable Profit Factor Max Drawdown Sharpe Ratio Buy & Hold
PSQ Short Nasdaq ETF 5 min ( - 14% ) 1894 28% ( - 0.9 % ) ( -20% ) ( -0.3 ) ( - 20 % )
SH Short S&P ETF 1 day 20% 35 51% 2.8 ( -7% ) 0.5 ( - 12 % )
MSFT Microsoft 1 hour 37% 249 37% 1.4 ( -4% ) 0.5 45%
AZN Astrazeneca, PLC 1 day 22% 32 50% 1.9 ( -6% ) 0.3 ( - 4 % )
MUFG Mitsubishi UFJ 1 day 296% 1255 39% ( - 0.6 ) ( -27% ) ( - 0.3 ) ( - 16 % )
BTC/USDT Bitcoin 1 min ( - 33 % ) 1349 25% ( - 0.5 ) ( - 33% ) ( - 1.1 ) 5%
ETH/USDT Ethereum 1 min ( - 40 % ) 1595 24% ( - 0.6 ) ( -40% ) ( - 1.1 ) 6%
LTC/USDT Litecoin 1 day 123 14 57% 4.8 ( - 5% ) 1.1 ( - 48% )
Note, of course, that any trend-anticipating bot has limitations. The Lower Performing results above show that because the system seeks gains in trends, it can underperform in choppy, aimless markets. Similarly, very short time frames (i.e. 1 - 5 minutes) can provide too many gaps and too few runs for it to reliably track. Backtesting is therefore essential to make sure this system is suitable for your (a) market, (b) time frame, and (c) trading mindset. On the other hand, a broad range of data show that almost any trending market, in almost any time frame, can be very productive.
Contact us if you would like to experience this bot.

SB_Compliment_RSI StrategyThe strategy modifies the original rsi strategy with the addition of compliment si (i.e. 100-rsi).
Strategy Idea: Previous rsi high and low value is recorded when the rsi crosses overBought(70) and OverSold(30) values.
Now when the rsi crosses above the overSold range, the rsi is matched with the compliment of previous high rsi value. If the compliment i.e.(100-prev_rsi_high) is less than or equal to rsi then long position is taken.
For short position, when the rsi crosses below the overBought range, the rsi is matched with the compliment of previous low rsi value. If compliment i.e.(100-prev_rsi_low) is greater than or equal to rsi.
Below s the code for the indicator present in the chart.
//@version=3
study(title="SB_Compliment_Relative Strength Index", shorttitle="RSI")
src = close, len = input(14, minval=1, title="Length")
up = rma(max(change(src), 0), len)
down = rma(-min(change(src), 0), len)
rsi = down == 0 ? 100 : up == 0 ? 0 : 100 - (100 / (1 + up / down))
plot(rsi, color=purple)
plot(100-rsi, color=orange)
band1 = hline(70)
band0 = hline(30)
fill(band1, band0, color=purple, transp=90)
The code also has switch code also which means it will enter the overBrought or overSold block one after the other.
Future modifications: Currently the value of rsi tracked is the one in which it crosses the overSold or OverBought range and not the highest/lowest value when the value is above/below OverBought/OverSold range.
Comment the perfect combination of indicators for it and will try to incorporate those indicators into it in the next version.
Message if you think of any modifications/ enhancements/ any opportunities. :)
Donations/Tips... :) -
BTC: 1BjswGcRR6c23pka7qh5t5k56j46cuyyy2
ETH: 0x64fed71c9d6c931639c7ba4671aeb6b05e6b3781
LTC: LKT2ykQ8QSzzfTDB6Tnsf12xwYPjgq95h4

[AutoView] Trailing Stop Back Testing and alerts + TP and TSThe number one request since the creation of autoview was to have alerts triggered for Take Profit, Stop Loss and Trailing Stops. Finally, we've figured it out, and as an additional bonus, this allows us to back test trailing stops in the strategy tester.
YouTube Video about this script and setup: bit.ly
This script contains 2 things people have been asking for, multiple time frames and of course, a trailing stop that can be both back tested and setup for alerts.
This strategy itself seems to perform better without the use of the Trailing Stop, so play around and monitor it before actually trying to trade it live.
View all the trades being tracked in a Google Sheets here: bit.ly
To learn more about back testing strategies, automation and AutoView join our free slack group via slack.crypto.pink
Referral Tax:
This requires 4 alerts, so you are going to have to upgrade to PRO. It'd be greatly appreciated if you signed up using our referral link.
bit.ly
1Broker
bit.ly
okcoin
bit.ly

Cognex Fibonacci Breakout StrategyTHE COMPLETE TRADE LOGIC (What We Want):
Step 1: Morning Session (9:30-10:30)
Track session high and low
Step 2: After 10:30 - Wait for Breakout
Bullish: Close above session high
Bearish: Close below session low
Step 3: Track Extreme After Breakout
Keep updating highest_after_breakout or lowest_after_breakout
This continuously updates as price makes new extremes
Step 4: Detect 28% Retracement (THE LOCK)
When price retraces to 28%, set last_extreme_for_retracement to the current extreme
This LOCKS the extreme for fibonacci calculations
fib_100 should use this locked value
Step 5: Place Limit Order EARLY (at 20% retracement)
When price retraces to 20%, place limit order at 28% entry
This is so the order is ready when price hits 28%
Step 6: Cancel & Recalculate if New Extreme
If price makes a NEW extreme AFTER the order is placed
Cancel the old order
Wait for new 20% retracement to place new order
Step 7: One Trade Per Day
Only ONE order placement attempt per day
Even if cancelled, don't try again

Fury by Tetrad Fury by Tetrad
What it is:
A rules-based Bollinger+RSI strategy that fades extremes: it looks for price stretching beyond Bollinger Bands while RSI confirms exhaustion, enters countertrend, then exits at predefined profit multipliers or optional stoploss. “Ultra Glow” visuals are purely cosmetic.
How it works — logic at a glance
Framework: Classic Bollinger Bands (SMA basis; configurable length & multiplier) + RSI (configurable length).
Long entries:
Price closes below the lower band and RSI < Long RSI threshold (default 28.3) → open LONG (subject to your “Market Direction” setting).
Short entries:
Price closes above the upper band and RSI > Short RSI threshold (default 88.4) → open SHORT.
Profit exits (price targets):
Uses simple multipliers of the strategy’s average entry price:
Long exit = `entry × Long Exit Multiplier` (default 1.14).
Short exit = `entry × Short Exit Multiplier` (default 0.915).
Risk controls:
Optional pricebased stoploss (disabled by default) via:
Long stop = `entry × Long Stop Factor` (default 0.73).
Short stop = `entry × Short Stop Factor` (default 1.05).
Directional filter:
“Market Direction” input lets you constrain entries to Market Neutral, Long Only, or Short Only.
Visuals:
“Ultra Glow” draws thin layered bands around upper/basis/lower; these do not affect signals.
> Note: Inputs exist for a timebased stop tracker in code, but this version exits via targets and (optional) price stop only.
Why it’s different / original
Explicit extreme + momentum pairing: Entries require simultaneous band breach and RSI exhaustion, aiming to avoid entries on gardenvariety volatility pokes.
Deterministic exits: Multiplier-based targets keep results auditable and reproducible across datasets and assets.
Minimal, unobtrusive visuals: Thin, layered glow preserves chart readability while communicating regime around the Bollinger structure.
Inputs you can tune
Bollinger: Length (default 205), Multiplier (default 2.2).
RSI: Length (default 23), Long/Short thresholds (28.3 / 88.4).
Targets: Long Exit Mult (1.14), Short Exit Mult (0.915).
Stops (optional): Enable/disable; Long/Short Stop Factors (0.73 / 1.05).
Market Direction: Market Neutral / Long Only / Short Only.
Visuals: Ultra Glow on/off, light bar tint, trade labels on/off.
How to use it
1. Timeframe & assets: Works on any symbol/timeframe; start with liquid majors and 60m–1D to establish baseline behavior, then adapt.
2. Calibrate thresholds:
Narrow/meanreverting markets often tolerate tighter RSI thresholds.
Fast/volatile markets may need wider RSI thresholds and stronger stop factors.
3. Pick realistic targets: The default multipliers are illustrative; tune them to reflect typical mean reversion distance for your instrument/timeframe (e.g., ATRinformed profiling).
4. Risk: If enabling stops, size positions so risk per trade ≤ 1–2% of equity (max 5–10% is a commonly cited upper bound).
5. Mode: Use Long Only or Short Only when your discretionary bias or higher timeframe model favors one side; otherwise Market Neutral.
Recommended publication properties (for backtests that don’t mislead)
When you publish, set your strategy’s Properties to realistic values and keep them consistent with this description:
Initial capital: 10,000 (typical retail baseline).
Commission: ≥ 0.05% (adjust for your venue).
Slippage: ≥ 2–3 ticks (or a conservative pertrade value).
Position sizing: Avoid risking > 5–10% equity per trade; fixedfractional sizing ≤ 10% or fixedcash sizing is recommended.
Dataset / sample size: Prefer symbols/timeframes yielding 100+ trades over the tested period for statistical relevance. If you deviate, say why.
> If you choose different defaults (e.g., capital, commission, slippage, sizing), explain and justify them here, and use the same settings in your publication.
Interpreting results & limitations
This is a countertrend approach; it can struggle in strong trends where band breaches compound.
Parameter sensitivity is real: thresholds and multipliers materially change trade frequency and expectancy.
No predictive claims: Past performance is not indicative of future results. The future is unknowable; treat outputs as decision support, not guarantees.
Suggested validation workflow
Try different assets. (TSLA, AAPL, BTC, SOL, XRP)
Run a walkforward across multiple years and market regimes.
Test several timeframes and multiple instruments. (30m Suggested)
Compare different commission/slippage assumptions.
Inspect distribution of returns, max drawdown, win/loss expectancy, and exposure.
Confirm behavior during trend vs. range segments.
Alerts & automation
This release focuses on chart execution and visualization. If you plan to automate, create alerts at your entry/exit conditions and ensure your broker/venue fills reflect your slippage/fees assumptions.
Disclaimer
This script is provided for educational and research purposes. It is not investment advice. Trading involves risk, including the possible loss of principal. © Tetrad Protocol.
