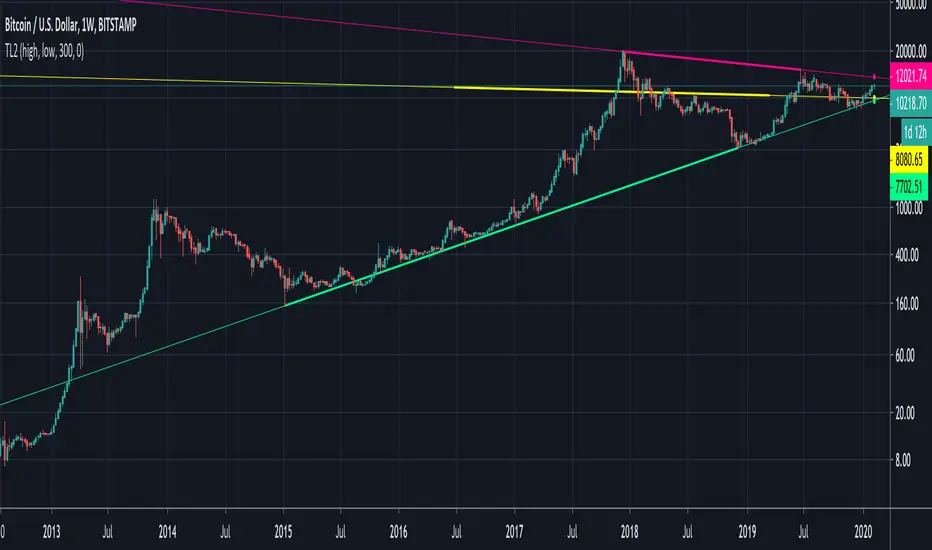
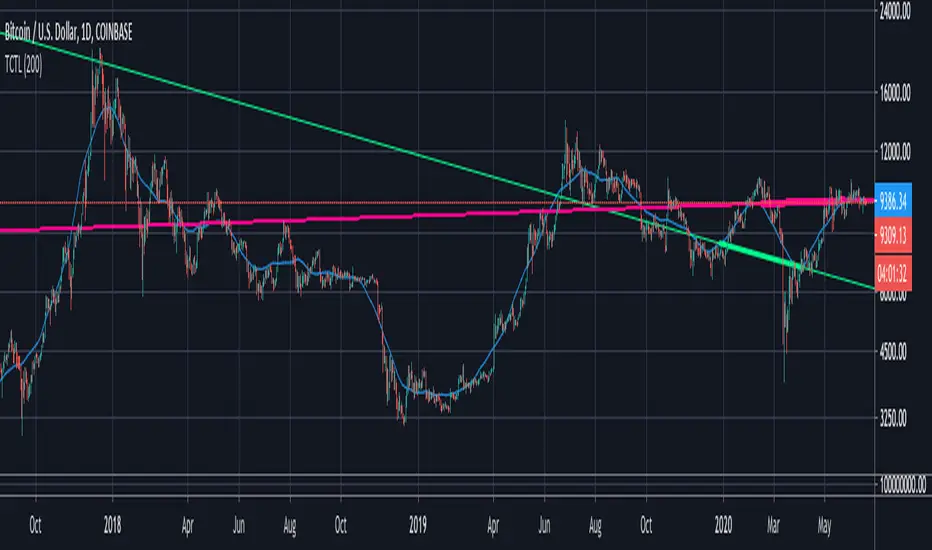
Trend Identifier StrategyTrend Identifier Strategy for 1D BTC.USD
The indicator smoothens a closely following moving average into a polynomial like plot and assumes 4 staged cycles based on the first and the second derivatives. This is an optimized strategy for long term buying and selling with a Sortino Ratio above 3. It is designed to be a more profitable alternative to HODLing. It can be combined with 'Accumulation/Distribution Bands & Signals' and 'Exponential Top and Bottom Finder'.
Cerca negli script per "trend"

Trend IdentifierTrend Identifier for 1D BTC.USD
It smoothens a closely following moving average into a polynomial like plot.
And assumes 4 stage cycles based on the first and second derivatives.
Green: Bull / Exponential Rise
Yellow: Distribution
Red: Bear / Exponential Drop
Blue: Accumulation
Red --> Blue --> Green: indicates the start of a bull market
Green --> Yellow --> Red: indicates the start of a bear market
Green --> Yellow: Start of a distribution phase, take profits
Red --> Blue: Start of a accumulation phase, DCA

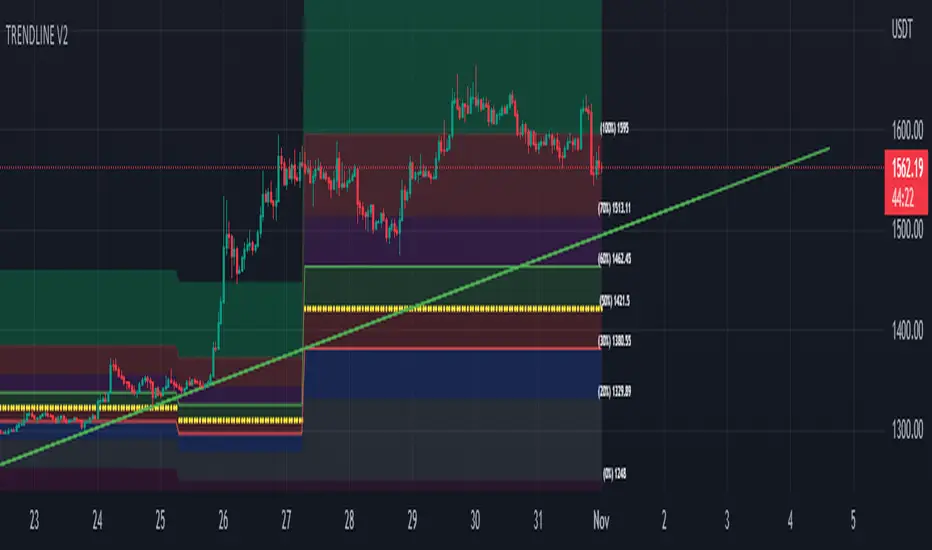
TRENDLINE V1Hello all ...
this is the source trendline of the three pivots
with adjustable resolution and length
function to find a breakout or breakdown
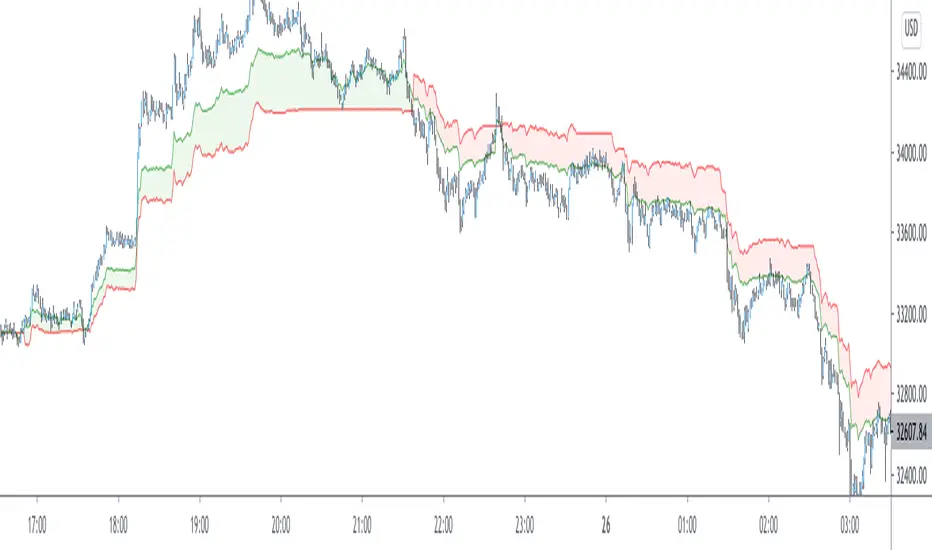
Trend Day IndentificationVolatility is cyclical, after a large move up or down the market typically "ranges" during the next session. Directional order flow that enters the market during this subsequent session tends not to persist, this non-persistency of transactions leads to a non-trend day which is when I trade intraday reversionary strategies.
This script finds trend days in BTC with the purpose of:
1) counting trend day frequency
2) predicting range contraction for the next 1-2 days so I can run intraday reversion strategies
Trend down is defined as daily bar opening within X% of high and closing within X% of low
Trend up is defined as daily bar opening within X% of low and closing within X% of high
default parameters are:
1) open range extreme = 15% (open is within 15% of high or low)
2) close range extreme = 15% (close is within 15% of high or low)
There is also an atr filter that checks that the trend day has a larger range than the previous 4 bars this is to make sure we find true range expansion vs recent ranges.
Notes:
If a trend day occurs after a prolonged sideways contraction it can signal a breakout - this is less common but is an exception to the rule. These types of occurrences can lead to the persistency of order flow and result in extended directional daily runs.
If a trend day occurs close to 20 days high or low (stopping just short OR pushing slightly through) then wait an additional day before trading intraday reversion strategies.

Trend intensity 65 TI65––––History & Credit
This indicator has been inspired by public videos of StockBee and his community. Stockbee is a famous successful trader, who has approach to detail and backtesting. The TI65 is a great confirmation tool for the trend strenght.
–––––What it does
TI65 is an indicator that measures trend and momentum over 65 days.
When there is a green cloud we have a confirmed uptrend with certain velocity.
The calculation is simple as it measures the ratio between the 7d SMA over the 65D sma.
–––––How to use it
Look for entry points when during green trade intensity.

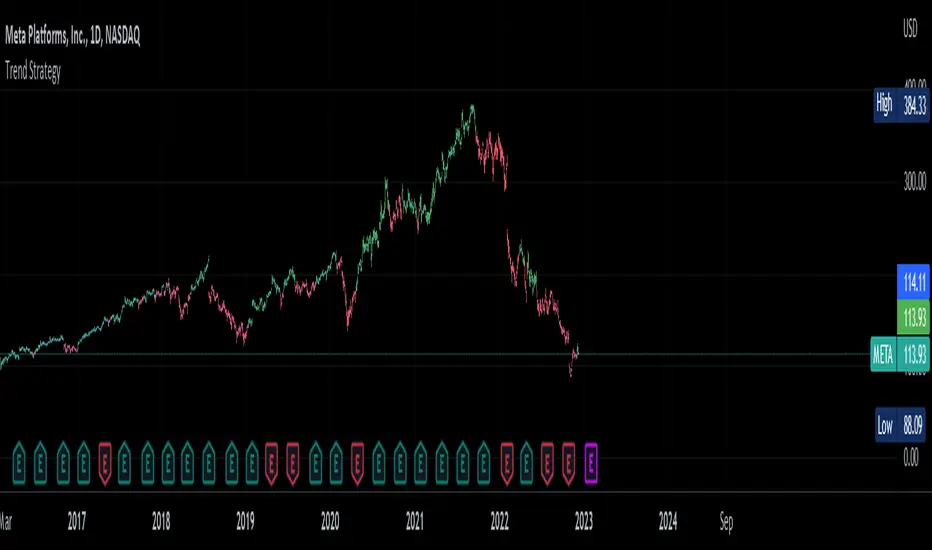
Trend Strategy by zdmreThis Strategy is a trend following indicator. It is plotted on price and the current trend can be determined by its placement vis-a-vis price. It is constructed with just three parameters: Period, Multiplier and Entry/Exit Point with Superformula.
The default parameters are 14 for Average True Range (ATR) and 4 for its multiplier. The average true range (ATR) plays a key role in ‘Trend’ as the indicator uses ATR to compute its value and it signals the degree of price volatility. You should note that any changes to these numbers can affect the use of the Trend indicator.
While you using this indicator, you should not avoid putting your stop loss.
For a long position, you can put stop loss right at the red indicator line. For a short position, you can put it at the green indicator line. You can insert your own settings as well.
Using Trend Strategy along with a stop loss pattern is the best way for earning the best wealth in trading.
There is no best setting for any trading indicator.
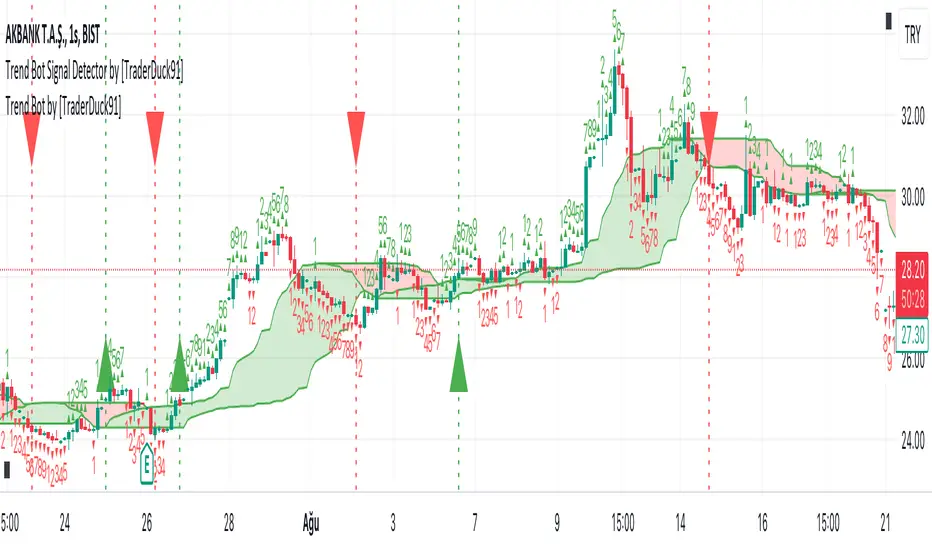
Trend Bot by [ToplaninKizlarUcuyoruz]Description:
1. Just a moving average strategy used in this indicator.
2. If the src2 (you can change it in settings) close above highest MA, appear the long signal.
3. And if the src2 close under the lowest MA, appear the short signal.
How is it using:
Green is an uptrend. Red is a downtrend.
-If you see the green up triangle signal, open long (and close short)
-If you see the red down triangle signal, open short (and close long)
*** Please check signals with your own strategy and your favorite indicators ***
inspired by the original open source indicator and added some new setting options:
(click on the image to open the original indicator's page)
Trend MagicTrend Magic is originally a MT platform (MetaTrader) indicator and it can be used with any forex trading systems / strategies for additional confirmation of trading entries or exits. Converted the MT platform code to TradingView Pine version 4. Also you can use Multiple Time Frame.
It also works well with Crypto and Stock Markets.
Trend Magic consists of two main calculation parts as momentum and volatility:
First part is ATR based (like ATR Trailing Stop) logic, second part is all about CCI which also determines the color of Trend Magic.
Blue: when CCI is positive
Red: when CCI is negative
Also added alert condition regarding price crosses :
when LOW CrossesAbove TM
and HIGH CrossesBelow TM
Enjoy
Kıvanç Özbilgiç

Trend Line Fibonacci [TLF]TLF is a price based Adaptive Scalping Indicator ideally to be used over lower timeframes
1min, 5min,.... 30 min
Its made using pivot calculations of fibonacci lookback lengths, which gives it an adaptability
default lookback lengths are:
55,89,144,233
This indicator is a pine script clone of Trend Line Fibonacci as available in MT4
google search ( prorealcode , trend line fibonacci )
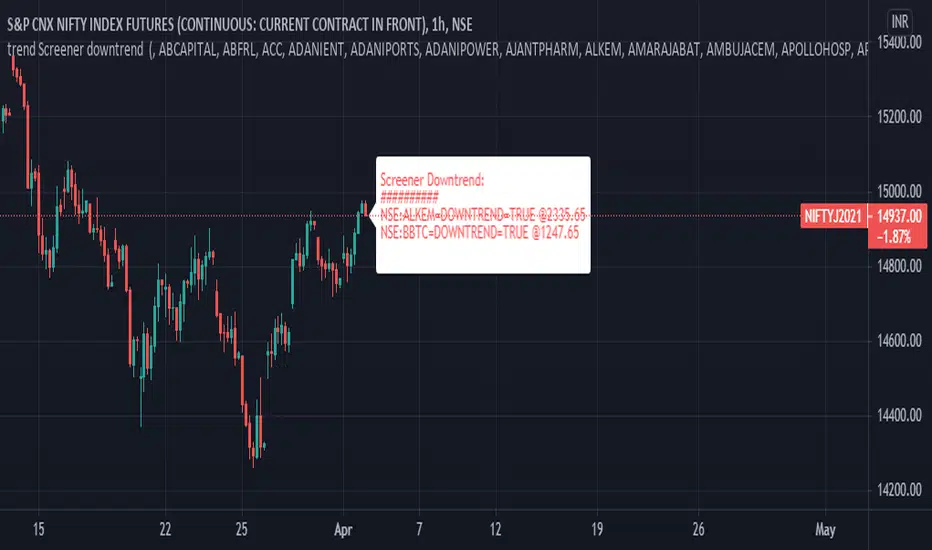
trend Screener downtrendthis is in continuation with - previous trend screener i have published, In this code only downtrend screener is there ,This is type of custom screener I searched and made to screen bulk stocks any one can modify it, other may get help out of it.
you can change or add new symbol in input section.
in my code i have made defined and printed last close price when downtrend was true.
1. downtrend = ema (close,55)< ema (close,144) and ema (close,144)< ema (close,388) and ema (close,388)<ema(close,576) and close<ema(close,388)
if the indicator is printing DOWNTREND=TRUE or UPTREND=TRUE then the corresponding stock is in currently in that trend out of the stocks listed in the code
in one code only 40 (max) stocks can be called.
to add more stocks I copied same code and changed the stocks in the code, now you can screen 80 stocks at a time.
This code runs on each bar and checks if the stocks is in uptrend or down trend.
you can customize this screener according to your requirement.
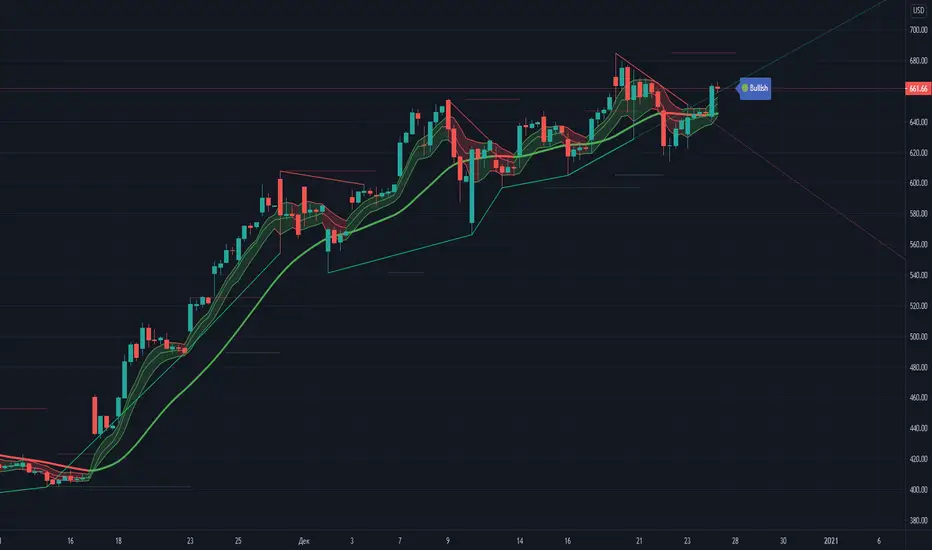
Trend Visualizer with S/RDetection and color visualization of the trend direction by constructing a candle envelope based on exponential moving averages and a double exponential moving line.
Analysis of highs and lows and construction of trend lines.
Showing support/resistance levels and trend forecast.
English version.
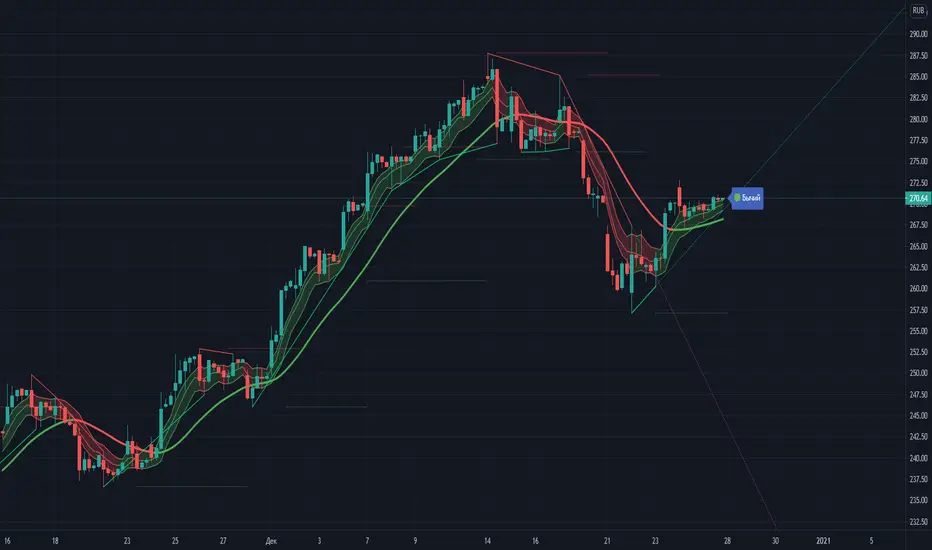
Trend Visualizer with S/R (Russian version)Обнаружение и цветная визуализация трендового направления путем построения свечного конверта по экспоненциальным скользящим средним и линии двойной экспоненциальной скользящей.
Анализ максимумов и минимумов и построение трендовых линий. Показ уровней поддержки/сопротивления и прогноз тренда.
Рускоязычная версия интерфейса. Англоязычная версия позже.
Detection and color visualization of the trend direction by constructing a candle envelope based on exponential moving averages and a double exponential moving line.
Analysis of highs and lows and construction of trend lines. Showing support/resistance levels and trend forecast.
Russian-language version of the interface. English version later.
Trend Trader Buy/Sell SignalsTrend Trader
The code is open source, what it uses to print signals is MACD cross and ADX. Bar colors change in relation to where price is according to the 50 day MA. The MA ribbon is used for visualizing trend and using it for dynamic support/resistance. The ribbon is comprised of the 50 day and 100 day MAs.
Main reason to publish this script is because some like to jumble up scripts together slap some moving averages on it to "follow trend" and then label it an algorithm, market it and sell it to people online. No single system will work 100% of the time, do you due diligence in anything you are interested in buying. Plenty of free scripts in the TV library that can do you justice when trading.

trend Screener List1This is type of custom screener I searched and made to screen bulk stocks any one can modify it, other may get help out of it.
in my code i have made defined
1. uptrend= ema(close,55)> ema(close,144) and ema(close,144)> ema(close,388) and ema(close,388)> ema(close,576) and close>ema(close,388)
2. downtrend = ema(close,55)< ema(close,144) and ema(close,144)< ema(close,388) and ema(close,388)

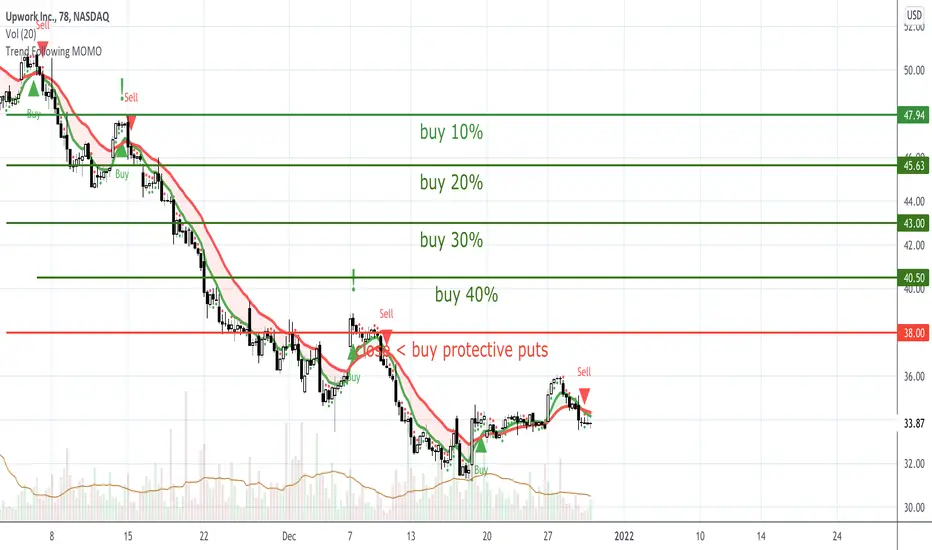
Trend Following MOMOIngredients
Daily chart
8ema & 21ema on a 78-minute chart
Trend Following v1 indicator for TradingView (optional)
Steps
Identify stocks that tend to move the same direction for one or more weeks at a time.
Find and locate stocks where the 8ema is crossing above (bullish) or below (bearish) the 21 ema on a 78-minute chart.
If the 8ema > 21ema, the indicator will show a GREEN shaded area , be bullish OR if the 21ema > 8ema, the indicator will show a RED shaded area, be bearish.
Buy to open with a “Limit buy” order if a green arrowis present at CLOSE of a 78-minute candle or sell to open with a “limit sell” or if a red arrowis present at CLOSE of a 78-minute candle.
Use either stocks or options. allocate the same $$ for each trade, continue in the trend (stay in the trade) until you 1) trend is changing. 2) ready to lock in profits.
Optional
The shift from bearish to bullish is the best scenario, consider Long only / short only / long and short.
Set alerts “Trend Reversal” inside the v1 trend following TradingView indicator and ONLY trade your alerts.
Premium indicator has built-in strategy tester.
Trend Indicator with BUY SELL signalsThe Script can be used to identify the main trend and take BUY/SELL decisions in the lower time frames.
The tool can be applied as follows
1) Apply the tool your favorite chart
2) Select the main trend.
3) Go to lower time frames to check the BUY/SELL signals. Example: If the selected main trend is 4 hrs then go to time frames below 4 hrs to find the entry and exit positions.
Feel free to reach out to me if you need any further information

Trend trader StrategyFirst I would like to thank to @JustUncleL since this strategy started from one of his scalper strategies
This strategy can be adapted to all time charts .
First it has the session where we want to trade, for this example I choosed the EURUSD so I only take in consideration london/neywork session.
Its made from 3 EMA :
normal
slow
ultra slow
It has has the capacity to use HA candles into consideration if its needed.
At the same time we have a price channel made from faster MAs, that act like a bollinger band .
Together with all of them, we establish which trend we have if its uptrend or downtrend
Then we check the candles if they are below or above the MA , and based on the condition if they crossed recently we can suggest if its a buy or a long condition
At the same time we have 2 options of stop conditions:
Through a trailing stop made from ATR or % based
And second, a SL/TP made from pip points or % based.
For this example I used % based.
Let me know what you think about it, and if you found some nice settings for it. So far I only adapted to EURUSD 1 min time.

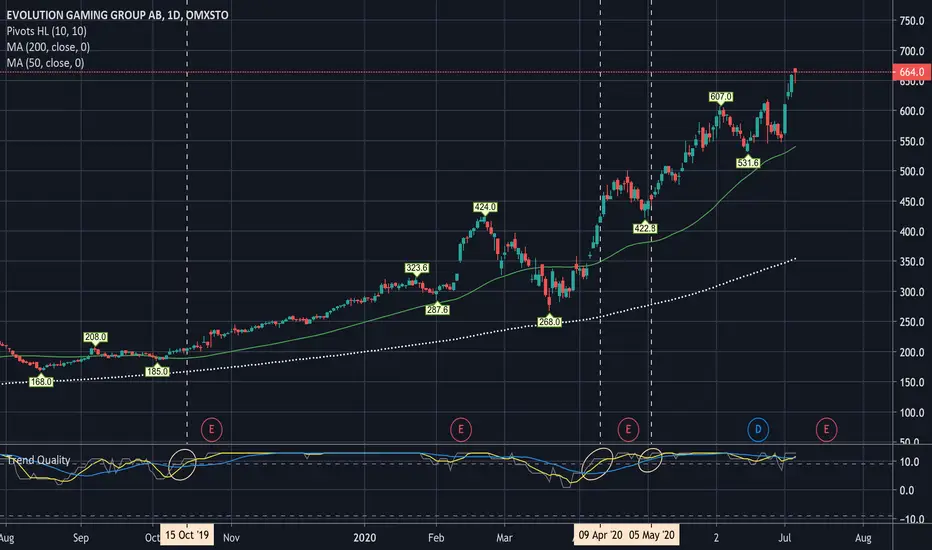
Trend QualityThe quality of the current trend is calculated by adding or subtracting
one point to the total value depending on the following criteras:
1. EMA-8, MA-20, MA-50, MA-100, MA-200 , each get a point if they are increasing.
2. EMA-8 > MA-20 > MA-20 > MA-50 > MA-100 > MA-200 , each condition that is true gets one point.
On top of the Trend Quality value we apply a "weekly" (5 periods) and
a "monthly" (22 periods) moving average.
When above a value of 5, a strong trend is indicated and hence
a trend following strategy should be used.
Use this to Buy when bouncing back from e.g MA-20 or a confirming
consolidation/candlestick/trendline pattern.
When the trend decreases below Zero a trend shift may have occured.
Idea, curtesy: Tobbe Rosèn
Trend Counter-Trend LinesThis analysis tool takes 4 local samples to product a trend line (green) and a counter-trend line (red). The concept of this is similar to finding wedges where 4 points (usually alternating highs and lows) are used to form the wedge. The purpose of this is to give a general long term direction and pattern.
3-way Trend DeterminationTrend determination in 3 different ways
Pivot lows and highs
Moving Average Crosses
Heikin Ashi

Trend Trader Strategy with MACDThis is plots the indicator developed by Andrew Abraham in the Trading the Trend article of TASC September 1998
The strategy I use has already been published explicitly by HPotter, you can review the core code from there.
I have converted the existing strategy codes that have been published into the strategy and the result looks great but I noticed that the indicator performed too much in short periods like 1 minute and I thought it would be healthier to get MACD approval. MACD approval will come selected by default. When the indicator reaches the buy status, if the macd histogram is positive, it enters the long process. By removing this confirmation from the settings window, you can see the normal signal frequency of the indicator.
This strategy is mainly based on trend signals. In fact, I am publishing this strategy to use in alternating trading for Bear-Bull crypto coins.
What does the bear-bull comparison mean?
You can open the same chart in the ETHBEAR / USDT symbol as opposed to the ETHBULL / USDT symbol that appears on the chart. When BUY signal comes in bull symbol, SELL will come in bear symbol. When BUY signal comes in bear symbol, SELL will come in bull symbol. In this way, very fast and very high profit can be obtained by alternating operation.