BITMEX Bybit binance HUOBI OKCOIN BTC Ichimoku TREND strategyBITMEX Bybit binance HUOBI Coinbase OKCOIN BTC ETH Ichimoku TREND strategy
This is a very effective trend strategy.
Strategy principle
HOW TO USE
set long position when a green arrow appears in the chart.
set short position when a red arrow appears in the chart.
For the long position and the short direction, you can set the stop profit & stop loss or trailing profit stop & trailing stop loss respectively.
When a purple arrow appears to close a position, an aggressive trader can go in the opposite direction when it is purple.
Strategy applicability
The default setting is for bitmex perpetual swap contract XBTUSD , bybit BTCUSD perpetual futures contract ,binance btcusdt Spot,Bitfinex BTCUSD Spot,bitflyer BTCJPY Spot,bithumb BTCKRW Spot,bitso BTCMXN Spot, bitstamp BTCUSD Spot,bittrex BTCUSDT Spot,Coinbase BTCUSD spot, deribit BTCPERP perpetual futures contract,gemini BTCUSD Spot,Hitbit BTCUSDT Spot,huobi BTCUSDT Spot KRAKEN XBTUSD spot,OKCOIN OKEX BTCUSD3M BTCUSD BTCUSD2W,Poloniex BTCUSDT Spot etc btc symbol with 30 minutes timeframe.
This indicator has broad applicability and can be applied to multiple different symbols.
This indicator also applies to the ETHUSD symbol etc, just adjust the default configuration.
Using the alert of the indicator, it can work well on the trading robot like Gunbot,autoview, without repaint false signals.
这是非常有效的趋势策略。
如何使用
在图表中出现绿色箭头就做多。
在图表中出现红色箭头就做空。
对于多头头寸和空头方向,您可以分别设置止损和止损或尾随利润止损和尾随止损;当出现紫色箭头时平仓,激进的交易者,可以在紫色时就做反方向。
策略适用性
默认设置是针对bitmex交易所 XBTUSD永久掉期合约,BYBIT交易所 BTCUSD永续期货合约,binance币安交易所 btcusdt现货,Bitfinex交易所 BTCUSD现货,bitflyer交易所 BTCJPY现货,bithumb交易所 BTCKRW现货,bitso交易所 BTCMXN现货,bitstamp交易所 BTCUSD现货,bittrex交易所 BTCUSDT现货,Coinbase交易所 BTCUSD现货,deribit交易所 BTCPERP永续期货合约,gemini双子星交易所 BTCUSD现货,Hitbit交易所 BTCUSDT现货,huobi火币交易所 BTCUSDT现货,KRAKEN交易所 XBTUSD现货,OKCOIN OKEX交易所 BTCUSD3M OK BTC季度合约 BTCUSD BTCUSD2W OK BTC次周合约,Poloniex BTCUSDT现货等2小时区间的btc交易。
Bitmex XBTUSD 2H 比特币期货 2 hours Bitcoin Futures
这个指标具有广泛的适用性,可以适用多个不同交易品种。
该指标还适用于ETHUSD,ETHBTC,ADABTC,TRXBTC,XRPBTC交易品种等,只需调整默认配置即可。
Bitmex ETHUSD 2H 以太币合约
binance ADABTC 2H
Binance ETHBTC 90 minutes 分钟
Binance TRXBTC89 minutes 分钟
Binance XRPBTC 90 minutes 分钟
使用该指标的警报设置,它可以在自动交易机器人上很好地工作,而无重绘错误的信号。
Cerca negli script per "trend"

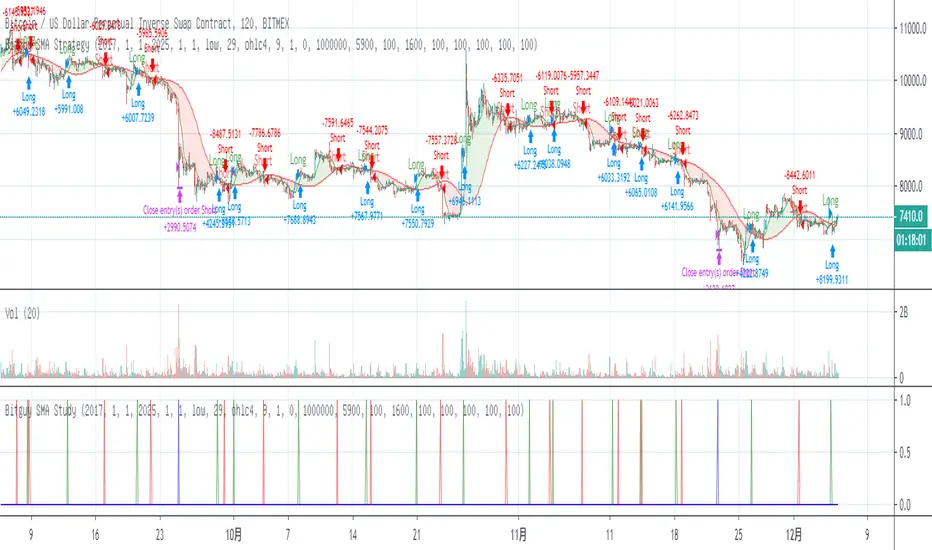
BITMEX Bybit binance Bitfinex OKCOIN BTC SMA TREND strategy BITMEX Bybit binance Bitfinex Coinbase OKCOIN BTC SMA TREND strategy
This is a very effective trend strategy.
BITMEX Bybit binance Bitfinex BTC SMA TREND strategy
Strategy principle
HOW TO USE
set long position when a green arrow appears in the chart.
set short position when a red arrow appears in the chart.
For the long position and the short direction, you can set the stop profit & stop loss or trailing profit stop & trailing stop loss respectively.
When a purple arrow appears to close a position, an aggressive trader can go in the opposite direction when it is purple.
Strategy applicability
The default setting is for bitmex perpetual swap contract XBTUSD , bybit BTCUSD perpetual futures contract ,binance btcusdt Spot,Bitfinex BTCUSD Spot,bitflyer BTCJPY Spot,bithumb BTCKRW Spot,bitso BTCMXN Spot, bitstamp BTCUSD Spot,bittrex BTCUSDT Spot,Coinbase BTCUSD spot, deribit BTCPERP perpetual futures contract,gemini BTCUSD Spot,Hitbit BTCUSDT Spot,huobi BTCUSDT Spot KRAKEN XBTUSD spot,OKCOIN OKEX BTCUSD3M BTCUSD BTCUSD2W,Poloniex BTCUSDT Spot etc btc symbol with 30 minutes timeframe.
This indicator has broad applicability and can be applied to multiple different symbols.
This indicator also applies to the ETHUSD symbol etc, just adjust the default configuration.
Using the alert of the indicator, it can work well on the trading robot like Gunbot,autoview, without repaint false signals.
这是非常有效的趋势策略。
如何使用
在图表中出现绿色线就做多。
在图表中出现红色线就做空。
对于多头头寸和空头方向,您可以分别设置止损和止损或尾随利润止损和尾随止损;当出现紫色箭头时平仓,激进的交易者,可以在紫色时就做反方向。
策略适用性
默认设置是针对bitmex交易所 XBTUSD永久掉期合约,BYBIT交易所 BTCUSD永续期货合约,binance币安交易所 btcusdt现货,Bitfinex交易所 BTCUSD现货,bitflyer交易所 BTCJPY现货,bithumb交易所 BTCKRW现货,bitso交易所 BTCMXN现货,bitstamp交易所 BTCUSD现货,bittrex交易所 BTCUSDT现货,Coinbase交易所 BTCUSD现货,deribit交易所 BTCPERP永续期货合约,gemini双子星交易所 BTCUSD现货,Hitbit交易所 BTCUSDT现货,huobi火币交易所 BTCUSDT现货,KRAKEN交易所 XBTUSD现货,OKCOIN OKEX交易所 BTCUSD3M OK BTC季度合约 BTCUSD BTCUSD2W OK BTC次周合约,Poloniex BTCUSDT现货等2小时区间的btc交易。
Bitmex XBTUSD 2H 比特币期货 2 hours Bitcoin Futures
Binance BTCUSDT 2H 比特币期货 2 hours Bitcoin spot
这个指标具有广泛的适用性,可以适用多个不同交易品种。
该指标还适用于ETHUSD交易品种等,只需调整默认配置即可。
Bitmex EOSBTC 30分钟 EOS合约 30分钟 ETHUSD Futures
Bitmex XRPBTC 30分钟 XRP合约 30分钟 ETHUSD Futures
使用该指标的警报设置,它可以在自动交易机器人上很好地工作,而无重绘错误的信号。
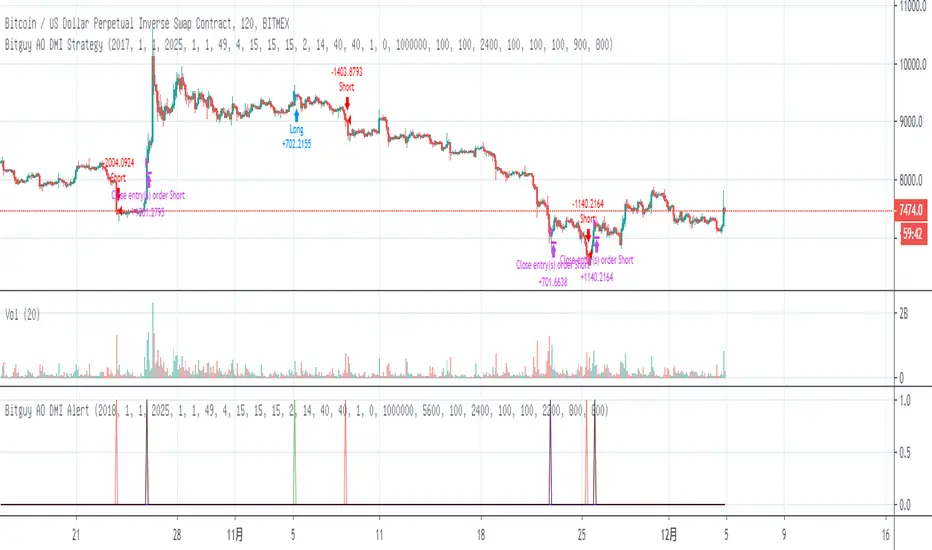
BITMEX Bybit binance Bitfinex BTC ETH AO DMI TREND strategyBITMEX Bybit binance Bitfinex Coinbase OKCOIN BTC ETH AO DMI TREND strategy
This is a very effective trend strategy.
Strategy principle
HOW TO USE
set long position when a green arrow appears in the chart.
set short position when a red arrow appears in the chart.
For the long position and the short direction, you can set the stop profit & stop loss or trailing profit stop & trailing stop loss respectively.
When a purple arrow appears to close a position, an aggressive trader can go in the opposite direction when it is purple.
Strategy applicability
The default setting is for bitmex perpetual swap contract XBTUSD , bybit BTCUSD perpetual futures contract ,binance btcusdt Spot,Bitfinex BTCUSD Spot,bitflyer BTCJPY Spot,bithumb BTCKRW Spot,bitso BTCMXN Spot, bitstamp BTCUSD Spot,bittrex BTCUSDT Spot,Coinbase BTCUSD spot, deribit BTCPERP perpetual futures contract,gemini BTCUSD Spot,Hitbit BTCUSDT Spot,huobi BTCUSDT Spot KRAKEN XBTUSD spot,OKCOIN OKEX BTCUSD3M BTCUSD BTCUSD2W,Poloniex BTCUSDT Spot etc btc symbol with 30 minutes timeframe.
This indicator has broad applicability and can be applied to multiple different symbols.
This indicator also applies to the ETHUSD symbol etc, just adjust the default configuration.
Using the alert of the indicator, it can work well on the trading robot like Gunbot,autoview, without repaint false signals.
这是非常有效的趋势策略。
如何使用
在图表中出现绿色线就做多。
在图表中出现红色线就做空。
对于多头头寸和空头方向,您可以分别设置止损和止损或尾随利润止损和尾随止损;当出现紫色箭头时平仓,激进的交易者,可以在紫色时就做反方向。
策略适用性
默认设置是针对bitmex交易所 XBTUSD永久掉期合约,BYBIT交易所 BTCUSD永续期货合约,binance币安交易所 btcusdt现货,Bitfinex交易所 BTCUSD现货,bitflyer交易所 BTCJPY现货,bithumb交易所 BTCKRW现货,bitso交易所 BTCMXN现货,bitstamp交易所 BTCUSD现货,bittrex交易所 BTCUSDT现货,Coinbase交易所 BTCUSD现货,deribit交易所 BTCPERP永续期货合约,gemini双子星交易所 BTCUSD现货,Hitbit交易所 BTCUSDT现货,huobi火币交易所 BTCUSDT现货,KRAKEN交易所 XBTUSD现货,OKCOIN OKEX交易所 BTCUSD3M OK BTC季度合约 BTCUSD BTCUSD2W OK BTC次周合约,Poloniex BTCUSDT现货等2小时区间的btc交易。
Bitmex XBTUSD 2H 比特币期货 2 hours Bitcoin Futures
Bitmex XBTUSD 30分钟 比特币期货 30 minutes Bitcoin Futures
这个指标具有广泛的适用性,可以适用多个不同交易品种。
该指标还适用于ETHUSD交易品种等,只需调整默认配置即可。
Bybit ETHUSD 30分钟 以太币合约 30分钟 ETHUSD Futures
使用该指标的警报设置,它可以在自动交易机器人上很好地工作,而无重绘错误的信号。
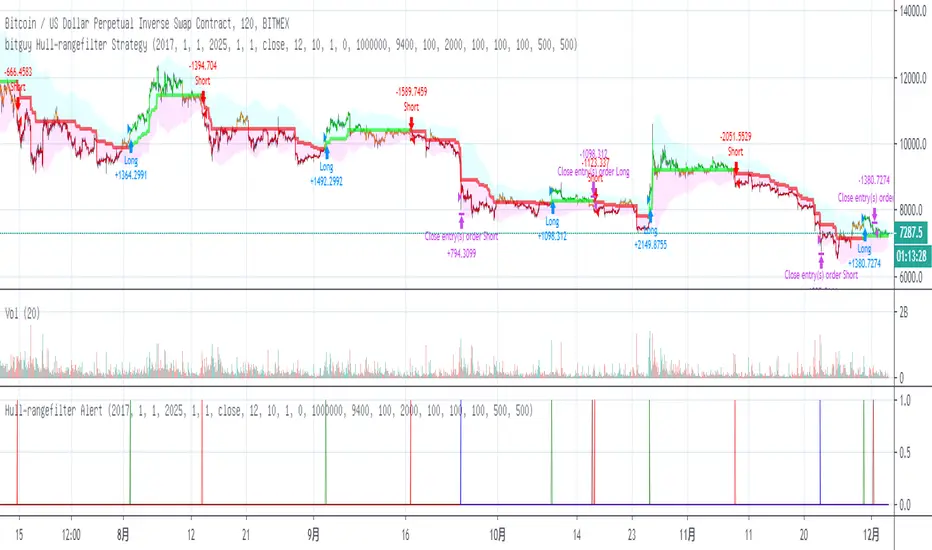
BITMEX Bybit binance BTC ETH HR TREND strategyBITMEX Bybit binance Bitfinex Coinbase OKCOIN BTC ETH HR TREND strategy
This is a very effective trend strategy.
Strategy principle
HOW TO USE
set long position when a green arrow appears in the chart.
set short position when a red arrow appears in the chart.
For the long position and the short direction, you can set the stop profit & stop loss or trailing profit stop & trailing stop loss respectively.
When a purple arrow appears to close a position, an aggressive trader can go in the opposite direction when it is purple.
Strategy applicability
The default setting is for bitmex perpetual swap contract XBTUSD , bybit BTCUSD perpetual futures contract ,binance btcusdt Spot,Bitfinex BTCUSD Spot,bitflyer BTCJPY Spot,bithumb BTCKRW Spot,bitso BTCMXN Spot, bitstamp BTCUSD Spot,bittrex BTCUSDT Spot,Coinbase BTCUSD spot, deribit BTCPERP perpetual futures contract,gemini BTCUSD Spot,Hitbit BTCUSDT Spot,huobi BTCUSDT Spot KRAKEN XBTUSD spot,OKCOIN OKEX BTCUSD3M BTCUSD BTCUSD2W,Poloniex BTCUSDT Spot etc btc symbol with 30 minutes timeframe.
This indicator has broad applicability and can be applied to multiple different symbols.
This indicator also applies to the ETHUSD symbol etc, just adjust the default configuration.
Using the alert of the indicator, it can work well on the trading robot like Gunbot,autoview, without repaint false signals.
这是非常有效的趋势策略。
如何使用
在图表中出现绿色线就做多。
在图表中出现红色线就做空。
对于多头头寸和空头方向,您可以分别设置止损和止损或尾随利润止损和尾随止损;当出现紫色箭头时平仓,激进的交易者,可以在紫色时就做反方向。
策略适用性
默认设置是针对bitmex交易所 XBTUSD永久掉期合约,BYBIT交易所 BTCUSD永续期货合约,binance币安交易所 btcusdt现货,Bitfinex交易所 BTCUSD现货,bitflyer交易所 BTCJPY现货,bithumb交易所 BTCKRW现货,bitso交易所 BTCMXN现货,bitstamp交易所 BTCUSD现货,bittrex交易所 BTCUSDT现货,Coinbase交易所 BTCUSD现货,deribit交易所 BTCPERP永续期货合约,gemini双子星交易所 BTCUSD现货,Hitbit交易所 BTCUSDT现货,huobi火币交易所 BTCUSDT现货,KRAKEN交易所 XBTUSD现货,OKCOIN OKEX交易所 BTCUSD3M OK BTC季度合约 BTCUSD BTCUSD2W OK BTC次周合约,Poloniex BTCUSDT现货等2小时区间的btc交易。
Bitmex XBTUSD 89分钟 比特币期货 89 minutes Bitcoin Futures
Bitmex XBTUSD 2H 比特币现货 2 hours Bitcoin Futures
Bitmex XBTUSD 1小时 比特币期货 1 hour Bitcoin Futures
Bybit BTCUSD 1小时 比特币合约 1 hour Bitcoin Futures
binance BTCUSDT 1H 比特币现货 1 hours Bitcoin Spot
这个指标具有广泛的适用性,可以适用多个不同交易品种。
该指标还适用于ETHUSD交易品种等,只需调整默认配置即可。
Bitmex ETHUSD 1小时 以太币合约 1H ETHUSD Futures
Binance ETHUSD 1小时 以太币现货 1H ETHUSD Spot
Bybit ETHUSD 1小时 以太币合约 1H ETHUSD Futures
使用该指标的警报设置,它可以在自动交易机器人上很好地工作,而无重绘错误的信号。
BITMEX Bybit binance Bitfinex OKCOIN BTC ETH TREND strategyBITMEX Bybit binance Bitfinex Coinbase OKCOIN BTC ETH TREND strategy
This is a very effective trend strategy.
Strategy principle
HOW TO USE
set long position when a green arrow appears in the chart.
set short position when a red arrow appears in the chart.
For the long position and the short direction, you can set the stop profit & stop loss or trailing profit stop & trailing stop loss respectively.
When a purple arrow appears to close a position, an aggressive trader can go in the opposite direction when it is purple.
Strategy applicability
The default setting is for bitmex perpetual swap contract XBTUSD , bybit BTCUSD perpetual futures contract ,binance btcusdt Spot,Bitfinex BTCUSD Spot,bitflyer BTCJPY Spot,bithumb BTCKRW Spot,bitso BTCMXN Spot, bitstamp BTCUSD Spot,bittrex BTCUSDT Spot,Coinbase BTCUSD spot, deribit BTCPERP perpetual futures contract,gemini BTCUSD Spot,Hitbit BTCUSDT Spot,huobi BTCUSDT Spot KRAKEN XBTUSD spot,OKCOIN OKEX BTCUSD3M BTCUSD BTCUSD2W,Poloniex BTCUSDT Spot etc btc symbol with 30 minutes timeframe.
This indicator has broad applicability and can be applied to multiple different symbols.
This indicator also applies to the ETHUSD symbol etc, just adjust the default configuration.
Using the alert of the indicator, it can work well on the trading robot like Gunbot,autoview, without repaint false signals.
这是非常有效的趋势策略。
如何使用
在图表中出现绿色箭头就做多。
在图表中出现红色箭头就做空。
对于多头头寸和空头方向,您可以分别设置止损和止损或尾随利润止损和尾随止损;当出现紫色箭头时平仓,激进的交易者,可以在紫色时就做反方向。
策略适用性
默认设置是针对bitmex交易所 XBTUSD永久掉期合约,BYBIT交易所 BTCUSD永续期货合约,binance币安交易所 btcusdt现货,Bitfinex交易所 BTCUSD现货,bitflyer交易所 BTCJPY现货,bithumb交易所 BTCKRW现货,bitso交易所 BTCMXN现货,bitstamp交易所 BTCUSD现货,bittrex交易所 BTCUSDT现货,Coinbase交易所 BTCUSD现货,deribit交易所 BTCPERP永续期货合约,gemini双子星交易所 BTCUSD现货,Hitbit交易所 BTCUSDT现货,huobi火币交易所 BTCUSDT现货,KRAKEN交易所 XBTUSD现货,OKCOIN OKEX交易所 BTCUSD3M OK BTC季度合约 BTCUSD BTCUSD2W OK BTC次周合约,Poloniex BTCUSDT现货等2小时区间的btc交易。
Bitmex XBTUSD 30分钟 比特币期货 30 minutes Bitcoin Futures
Bitfinex BTCUSD 30分钟 比特币现货 30 minutes Bitcoin Spot
Bybit BTCUSD 30分钟 比特币合约 30 minutes Bitcoin Futures
OKEX BTCUSD2M 30分钟 比特币次周合约 30 minutes Half a month Bitcoin Futures
Bitmex XBTUSD 2H 比特币现货 2 hours Bitcoin Futures
binance BTCUSDT 2H 比特币现货 2 hours Bitcoin Spot
Bybit BTCUSD 2H 比特币期货 2 hours Bitcoin Futures
这个指标具有广泛的适用性,可以适用多个不同交易品种。
该指标还适用于ETHUSD交易品种等,只需调整默认配置即可。
Bitmex ETHUSD 30 以太币合约
Bybit ETHUSD 30分钟合约
OKCOIN ETHUSD3W 30分钟季度合约
Bitmex ETHUSD 2H 以太币合约
Bybit ETHUSD 2H 以太币合约
HUOBI ETHUSD 2H 火币以太币现货
使用该指标的警报设置,它可以在自动交易机器人上很好地工作,而无重绘错误的信号。

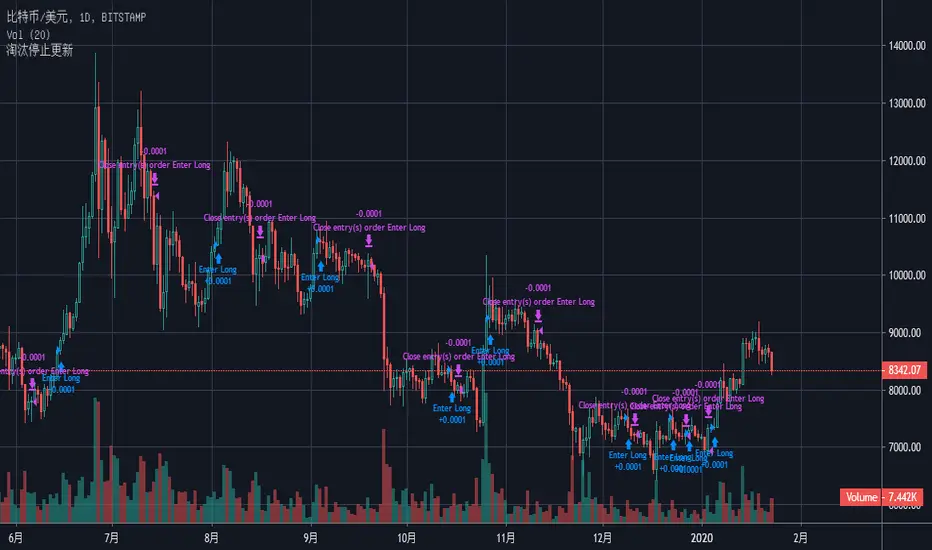
Bithanos Daily Trend A(灭霸比特币 2847198141) BITSTAMP:BTCUSD
two Ma cross up and down,make the "enter long" or "close order" symbol out the chart.
Modify the function of Ma by math as to reduce the mistake symbol.
"enter long" on chart meas the price may go up trend in next days.
"close the enter long order " on chart meas the price may not go up trend in next days.
the parameter can be changed,you can try the length(周期)89 the fastlength(fast周期)16,the position% 1.
JMOZ Trend (Core) for MudrexThe core trend strategy for Mudrex.
Partial take profits logic not included.
Stops set at 8% - generally should not be triggered, trend flip should act as stop.

Super Trend Daily 2.0 BFThis is my Super Trend Daily strategy but with one important difference. You can now adjust settings for long or short signals individually and separately. For example, the condition for a long signal may require a different parameter setting than the condition for a short signal. Each parameter in the signal generation can be tuned. You can also decide what kind of stop loss you want for each side - you could have a fixed stop loss for longs and an ATR derived stop loss for shorts, or whatever.
We also have the option to choose if we want longs, shorts or both.
INISTRUCTIONS
Look at the background colors:
Green line = long signal
Red line = short signal
Aqua = No long trades
White = No short trades
Yellow dotted line = stop loss for long
Orange dotted line = stop loss for short
The aqua and white backgrounds mean the conditions are choppy/sideways according to our settings we applied to the rate of change function for a long/short signal respectively. It is possible to get a long signal in a white background, but not a short signal. Similarly, it is possible to get a short signal in an aqua background, but not a long signal.
This is a work in progress so any suggestions for improvements are welcome.

Super Trend Daily BF 🚀Super Trend is based on volatility and attempts to show the overall greater trend of a market. Thanks to everget for the idea of improving the Super Trend code. Thanks to kiasaki for ROC code.
The idea here is to enter a trade upon trend reversal (unless we have a white background - this indicates choppy/sideways market).
INSTRUCTIONS
Follow the background color for signals of a trend reversal.
Bright green = long
Bright red = short
White = no trade
We use a fixed stop loss here of 6% but I have included the option to apply an ATR based stop loss in Settings. No take profit. No re-entering until we get an opposing signal.
I use a Rate of Change function to detect when we should stay out due to choppy sideways price action.
This strategy was optimised for XBT/USD on Bitmex 1 day chart, ideal settings for other pairs will differ.

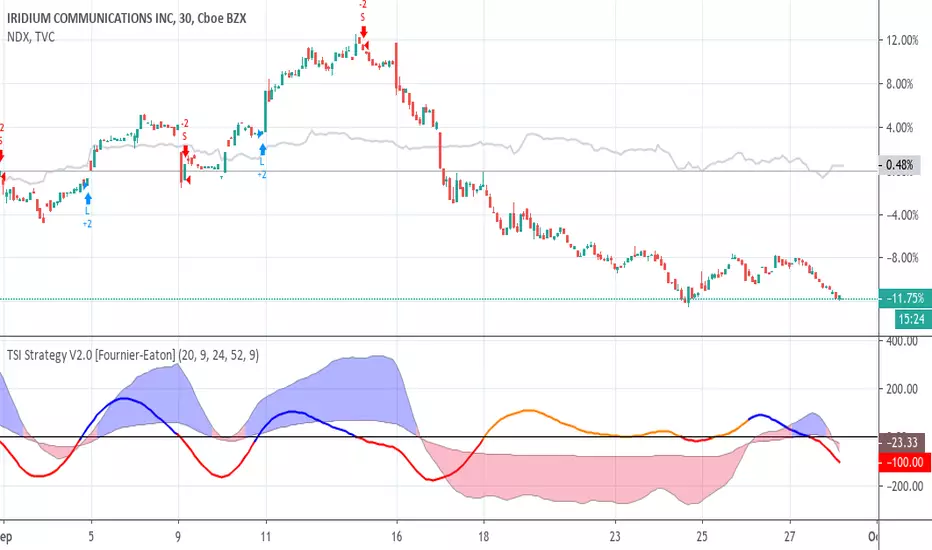
Trend Shift Indicator Strategy V2.0 [Fournier-Eaton]Major update of Trend Shift Indicator with adjustable parameter strategy
Defaults are set for 1 month view and 30min candle width.
Global Market Signals: Is the Trend Your Friend? AlgorithmWelcome!
This is a fully customizable strategy to help generate great trade signals as well as provide basic analysis on any market of your choice. All the trades occur at the open of a candle.
Settings:
1. Long or Short
2. Look back length
3. New Highs or New Lows?
4. Trade Duration
5. Trend SMA Length
6. Above or Below Trend SMA
Example:
Using a Daily SPY chart.
The Default Settings are:
1. Long
2. 10
3. New Lows
4. 5
5. 200
6. Above
What this means is that you will be going long when there is a new 10 day lowest close, you'll hold the trade for 5 days, and the trades only occur above the 200 day simple moving average.
**When you test your settings, make sure that in the Properties tab, you have the "Order Size" set at 100 and in the drop down menu to the right, make sure "% of equity" is selected.**


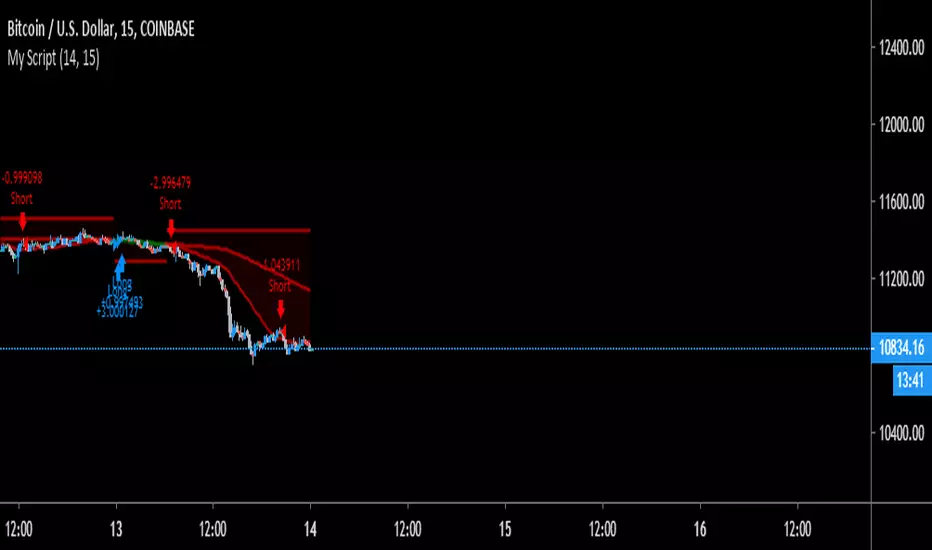
QuantCat 15M Trend Strategy [Crypto]**NOTE: IF YOU DO NOT OWN TRADINGVIEW PRO YOUR STRATEGIES WILL TAKE DATA FROM A SMALLER SAMPLE SIZE, AND THUS GIVE LESS ACCURATE BACKTESTING RESULTS TO THE ONES WE SHOW (LINKS WITH STEP 3) AND OPTIMISED OUR STRATEGIES WITH**
QuantCat 15M Crypto Trend Strategy
This strategy will allow you to absolutely smash the Crypto/USD pairs. We have optimised this strategy to work best for the Crypto/USD pairs on the 15 minute time frame. There are 4 pairs that we optimised the strategy to work for. There are a few main steps are as follows to use the strategy in it's most efficient manner-
1. Pyramiding orders needs to be set to 2 for maximum efficiency of the strategy due to aggressive and conservative entries, recommended % of equity per trade = 10-50%.
2. 15 Minute time frame needs to be applied (obvious, we know).
3. Pairs we used to optimise and backtest the strategy should ideally be used when using the strategy-
BTC/USD - prntscr.com
LTC/USD - prntscr.com
BCH/USD - prntscr.com
ETH/BTC - prntscr.com
XRP/BTC - prntscr.com
LTC/BTC - prntscr.com
We have a list of Visual and Technical features that are implemented into our strategy to make sure it is easy to use, consistent and giving it the highest chance of being profitable.
Visual Features
Colored candles- a visual to notification of an entry.
Stop-loss line- a horizontal red line to show the user where the stop-loss has been placed. Our testing proved a horizontal stop was more profitable than implementation of a trailing.
Price Bands- a dynamic price band to show the direction of the trend and support zones.
Technical Features
Trend Confirmation- Our algorithm fires entries only on trend confirmation and looks to trade the move for as long as it can, while also filtering out any false entries.
Aggressive and Conservative Entries- Two different types of entries have been incorporated in the strategy to maximise profit.
If you have discord alerts access, be sure to watch out in the discord for entries!

QuantCat 15M Crypto Trend StrategyQuantCat 15M Crypto Trend Strategy
This strategy will allow you to absolutely smash the Crypto/USD pairs. We have optimised this strategy to work best for the Crypto/USD pairs on the 15 minute time frame. There are 4 pairs that we optimised the strategy to work for. There are a few main steps are as follows to use the strategy in it's most efficient manner-
1. Pyramiding orders needs to be set to 2 for maximum efficiency of the strategy.
2. 15 Minute timeframe needs to be applied (obvious, we know)
3. Pairs we used to optimise and backtest the strategy should ideally be used when using the strategy-
BTC/USD
ETH/USD
LTC/USD
BCH/USD
We have a list of Visual and Technical features that are implemented into our strategy to make sure it is easy to use, consistent and giving it the highest chance of being profitable.
Visual Features
Colored candles- a visual to notification of an entry.
Stop-loss line- a horizontal red line to show the user where the stop-loss has been placed. Our testing proved a horizontal stop was more profitable than implementation of a trailing.
Price Bands- a dynamic price band to show the direction of the trend and support zones.
Technical Features
Trend Confirmation- Our algorithm fires entries only on trend confirmation and looks to trade the move for as long as it can, while also filtering out any false entries.
Aggressive and Conservative Entries- Two different types of entries have been incorporated in the strategy to maximise profit.
If you have discord alerts access, be sure to watch out in the discord for entries!
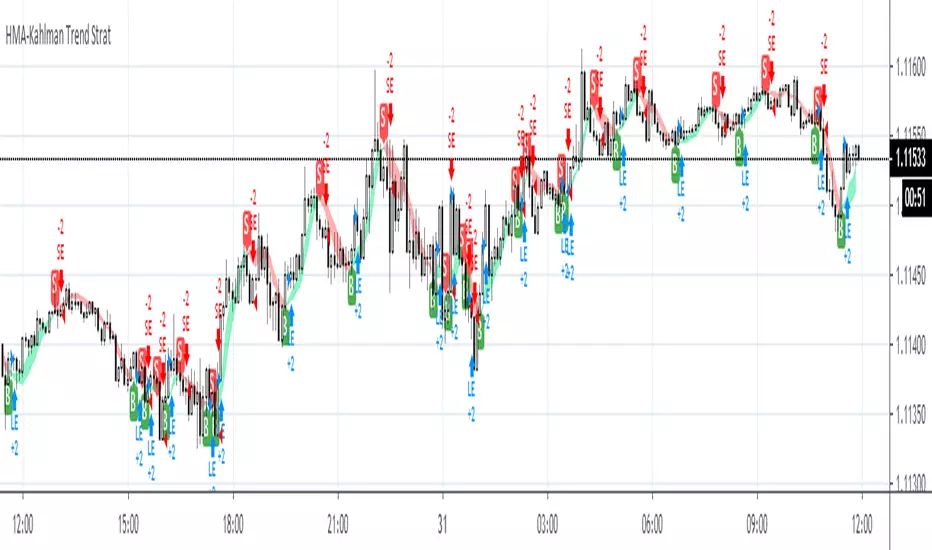
Hull Trend with Kahlman Strategy BacktestA simple backtest version of a Hull Trend with Kahlman strategy
Wyckoff Trend Tracking Crazy RocketWyckoff Trend Tracking Crazy Rocket 该策略可以保持良好的盈利能力,且不重绘。带您驰骋各种市场。

Trend Volatility Strategy TesterImproved the code, by filtering out bad trades: Using 240 days of Data in the Strategy Tester.
ETH/USD (Coinbase): 3 5 25 settings
BTC/USD (Coinbase): 5 5 25 settings
Date/Time can be changed from settings
Amazing results compared to old script. I will update the actual "Trend Volatility" script soon with new filter added.

Renko RSI trend - StrategyThis strategy takes advantage of Renko chart's noise cancelling and follows the trend accordingly.
Without fundamentals, mean reversion and trend following are the only two wakes to make consistent profits (disregarding high frequency market making and stat-arb)
so here it is, a simple strategy that will bring dollar bills.
Commission : 0.075%
Slippage : 10 ticks

Trend Detector [Strategy]This is the Strategy for the Trend Detector to show the performance (real time, not delayed) on Agrello. Profit from backtesting is huge at 1,500% for daily charts. This was for 2 years of trading data on daily timeframe. It beats buy and hold no contest.
New indicator for today called Trend Detector, follows the trend. It shows buy signals when coin is going up, sell signals when it is going down. Indicator showed plenty of Buy and Sell signals at the right times for buying and selling DLT . This indicator works on real time so you get the email alerts on time so you can action it.
Message me if you are interested in using the Trend Detector Indicator and Strategy.

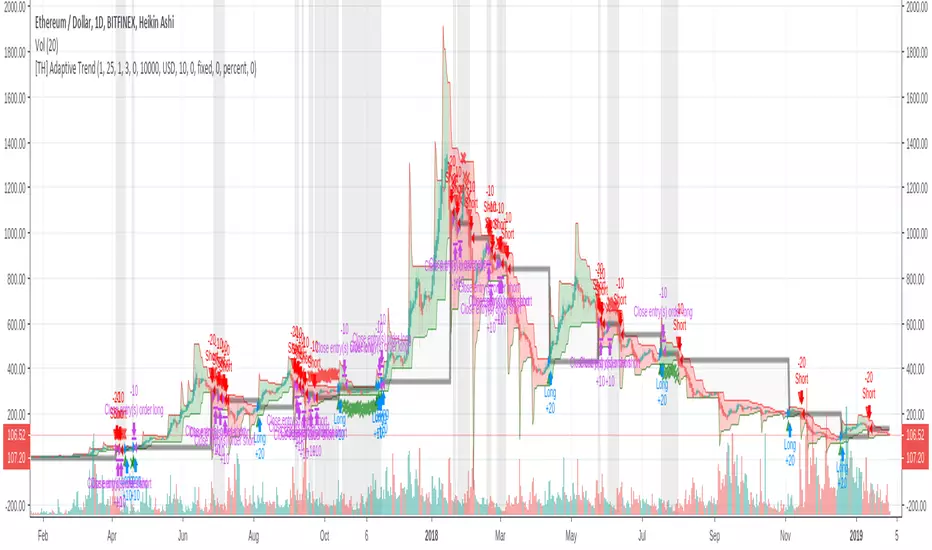
[TH] Adaptive Trend : StrategyAdaptive Trend : Strategy
*** It should be used with 'heikin ashi' chart ***
Super Trend
Basically, it is super trend strategy ( Rajandran R Supertrend )
- My idea is,
1. (scale) Factor of super trend is related with sensitivity of Up/Down trend change
2. Constant Factor cause failure of super trend strategy when market prices variance is low ( ie. high Factor ==> miss short trend )
3. By using variance measure ( like BollingerBand ) as a varying Factor, maybe we can catch short trend and long trend together
Loss Cut
The silver thick line is loss cut line & silver background means exit position status
I found that silver background is appear usually when price moves horizontally
1. It is set to open price of actual position entry ( heikin ashi chart's open price = loss cut line = (open + close)/2 )
2. If position is long
==> loss cut is executed when low price is lower than loss cut line
==> re-entry when low price is higher than loss cut line
3. If Position is short
==> loss cut is executed when high price is higher than loss cut line
==> re-entry when high price is lower than loss cut lin
Wyckoff Trend Tracking Trade SystemWyckoff Trend Tracking Trading System威科夫趋势跟踪交易指标工具为非结构化的市场增添了结构,它有一套明确一致的交易规则,让您专注于具有最高回报和最低风险的交易机会,无论您是刚刚开始从事交易还是经验丰富的交易员,它对您来说绝对是一种竞争优势。

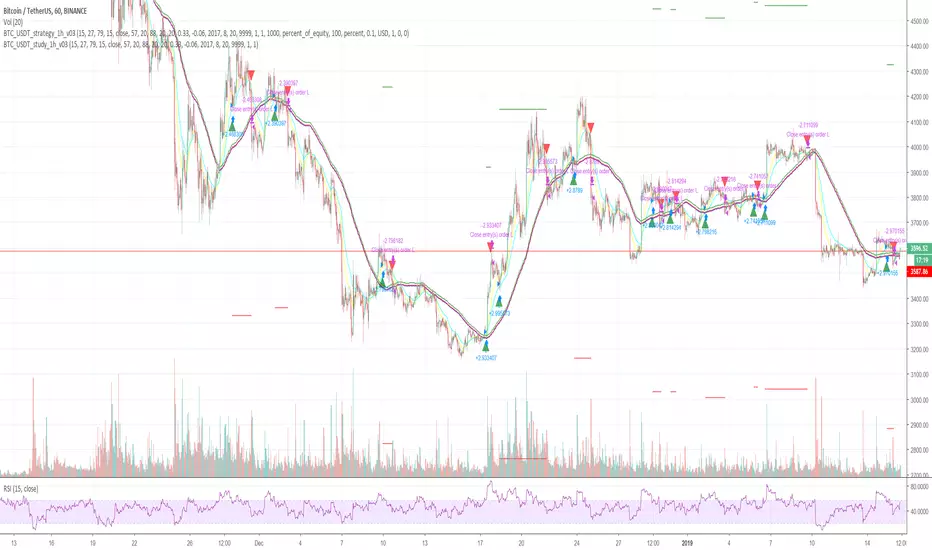
Cryptocurrency trend following LONG only strategyThis strategy uses multiple indicators to find optimal time to enter/exit the trade. The default setting is mainly for trading bitcoin/stable coin pair such as USDT etc on 1h timeframe but it can be applied to any pair/any timeframe with some settings adjustments.
Strategy settings description:
ID Name Descrption
1 FastMA - Value for fast exponencial moving average
2 SlowEMA - Value for slow exponencial moving average
3 SMA - Value for simple moving average
4 RSI Length - Length of RSI identificator
5 RSI Source candle - What price of candle is used for RSI calculation (open, close, high, low)
6 RSI Long condition - When buy, RSI indicator must be below this value to prevent of buying already overbought coin
7 RSI Short condition - When sell, RSI indicator must be above this value to prevent of selling already oversold coin
8 RSI close trade condition - Sell once RSI indicator acquires defined value
9 Take Profit (%) - Take profit value in percent
10 Stop Loss (%) - Stop loss value in percent
11 Long price toleration (%) - Price deviation for filtering bounces of simple moving average - price must close defined percents above SMA to open long trade
12 Short price toleration (%) - Price deviation for filtering bounces of simple moving average - price must close defined percents bellow SMA to close long trade
13 From Year - To run strategy in interval
14 From Month - To run strategy in interval
15 From Day - To run strategy in interval
16 To Year - To run strategy in interval
17 To Month - To run strategy in interval
18 To Day - To run strategy in interval
19 Show every signal? - (Study only) Unchecked shows only first signal based on strategy. But if you use take profit/stoploss settings within your bot, you might want to rebuy on next signal. Checked shows signal on each candle.
Notice that there are also false signals, especially when the coin is not trending or is strongly manipulated. Overall strategy is profitable though. You just take some minor loses and wont miss the big move.
You may also consider to compare buy&hold return vs profit from trading this strategy. In downtrend as we have seen recently, profit may not be as high as you expect but it is still much better than just hold and hope.
You can use the strategy script for fine tunning settings and find best settings for yourself
Study script helps you to automate trading with use of alerts perharps with 3commas bot or even trade manually based on email/sms notification setted by tradingview
Make sure that you keep same settings for strategy and study scripts.
If you need any help with settings do not hesitate to ask. I would also appriciate any feedback and ideas how to improve this script.
Here is backtest result from 23.08.2017:
RSC Trend Trading Strategy v1.0Ready Set Crypto Trend Trading Back-testing Strategy v1.0
This is a backtesting strategy for those who are familiar with Doc Severson's (Ready Set Crypto) Trend Trading Class offered at Ready Set Crypto . It is published with permission.
I highly recommend that you attend the class to understand this strategy and use this to your advantage. There is way more than just some indicators to utilise this trading strategy successfully.
Please also see the matching indicator for this strategy: Ready Set Crypto Trend Trading Indicator .
Buy and Sell Calls are based on the following:
An Upper Donchian Channel of 20 days (default) or more, used to indicate buy signals
A Lower Donchian Channel of 10 days (default) or more, used to indicate exit signals
A 50 day Simple Moving Average (for entry filtering)
A 200 day Simple Moving Average (for entry filtering)
How to do back-testing with this:
Once you add this strategy to your chart, go to the " Strategy Tester " section at the bottom of the screen to see it's performance.
You will need to configure the strategy (just like you'd configure any indicator) to tailor it to your specific scenarios.
Note following:
TradingView does not support BTC, ETH, etc as currencies, so BTC and other trading pairs are not available for back-testing; You will have to use USD pairs
The backtesting will apply to your chart's time frame (candle times) - use daily time candles as the starting point
You will need to tailor the " Input " and " Properties " options (click on the little gear icon) to adjust to suit your needs/scenarios
The default settings are as follows:
Backtest the current chart/ticker for the period of 2016 to 2020,
With a single position of US$1000 and a 0.1% commission (no pyramiding, i.e. multiple buy entries),
By entering a single position (buy) when the price is above SMA 50 and 200 and a candle high touches DC 20,
And exiting the position when a candle low touches DC 10.
Look under the " Strategy Tester " pane for the back-testing overview, performance and list of trades. Or if you are looking at the Published Idea , the back-testing results are displayed at the bottom of the page.
Please like, Share and Comment, if you like this indicator.
Warning
The Buy and Sell calls are meaningless and must not be auctioned without a thorough understanding of this trading strategy and the full consideration of the entry and exit conditions.
Please use this indicator at your own risk. The publisher does not accept any responsibility for its performance or any implications.
