Cerca negli script per "trend"
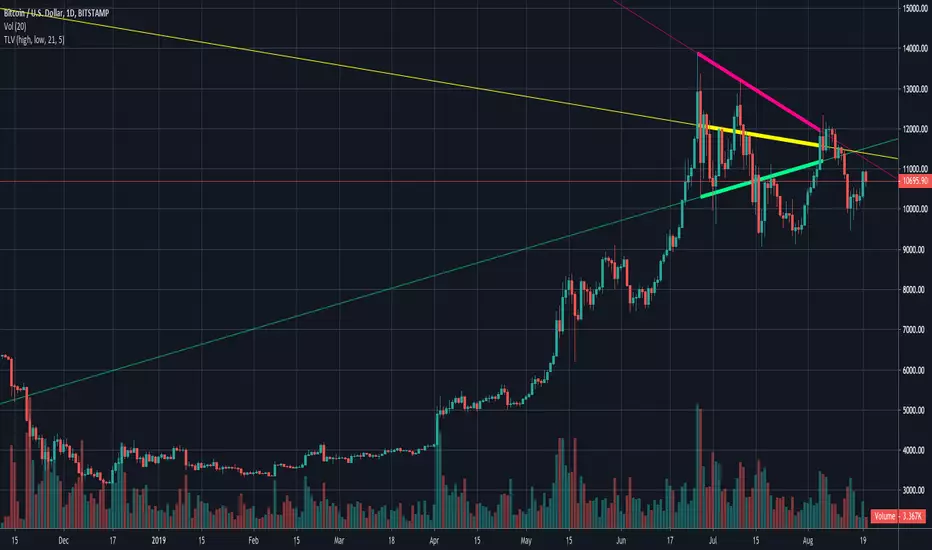
Trend Lines by VolumeA variant of the Trend Lines indicator; this one relies on volume highs and lows to dictate the trend.

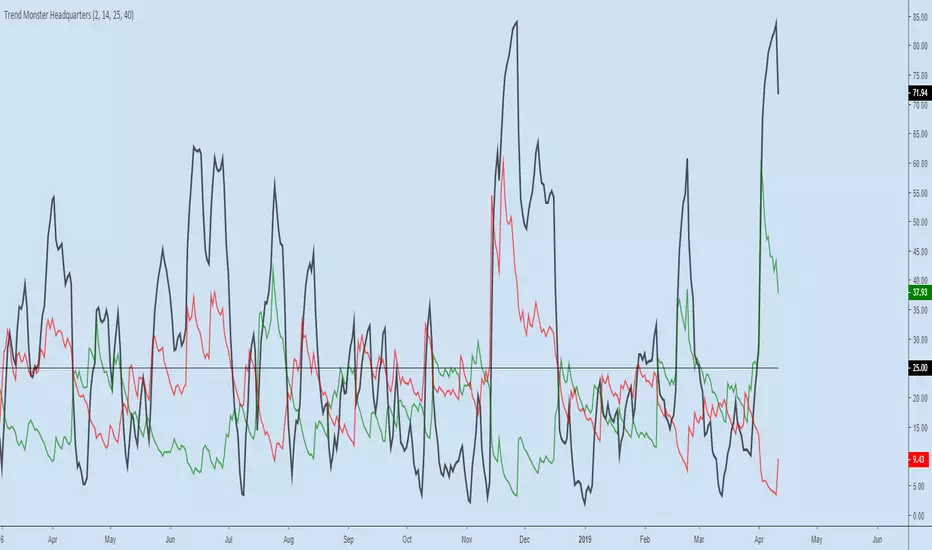
Trend Monster HeadquartersADX-DMI enhanced & modified for faster reaction
ADX (black line) above 80 = mega-trend peaked, reversal imminent, rare case scenario
ADX (black line) above 60 = trend topping out, reversal possible, depending on other indicators
ADX (black line) above 25 threshold = trend strenghening
DMI- (red line) - above 25 - bear trend strenghening
DMI+ (green line) - above 25 - bull trend strenghening
DMI- (red line) - coming off the bottom - bull trend weakening
DMI+ (green line) - coming off the bottom - bear trend weakening

Trend Follower With Help of Donchian Channels - TFWHDCThis is a simple Day Trade indicator, but can be used for swing and long term trades.
It is based on Donchian Channels to detect trend and point out resistance or support breakouts using arrows.
The bars ared colored when a breakout occurs. When a resistance breakout occurs the current and the next bars are colored green (default) and when a support breakout occurs the current and the next bars are colored red (default). This way this indicator can show if its an uptrend or a downtrend.
I hope this indicator will be useful for many traders!
Thank you!

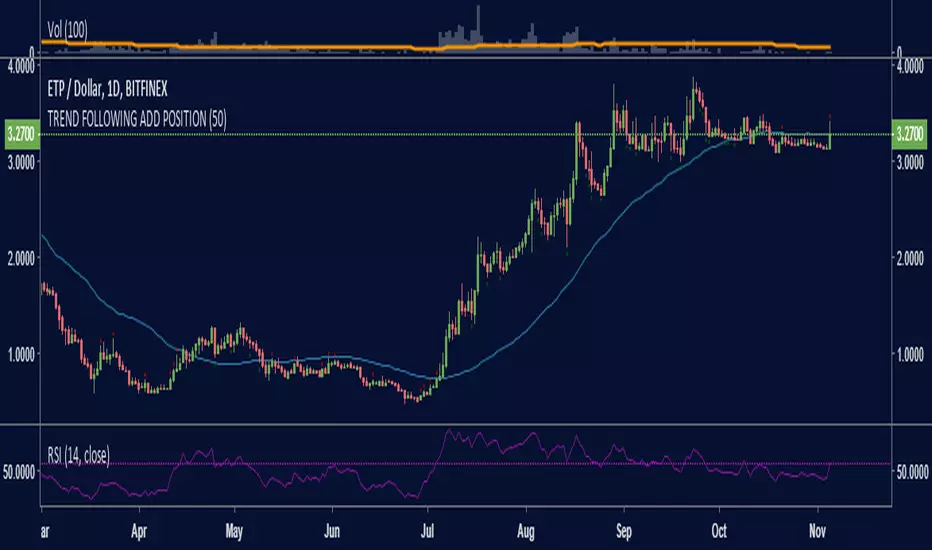
TREND FOLLOWING ADD POSITIONComplimentary to my trend following system, I am trying to easily spot the best points to add positions.
I'm using the same concept of HHHC and LLLC but when they go agains the trend withouth breaking it, in other words just a corrections with momentum which may be a good indication of oversold in and uptrend or overbought in a downtrend.
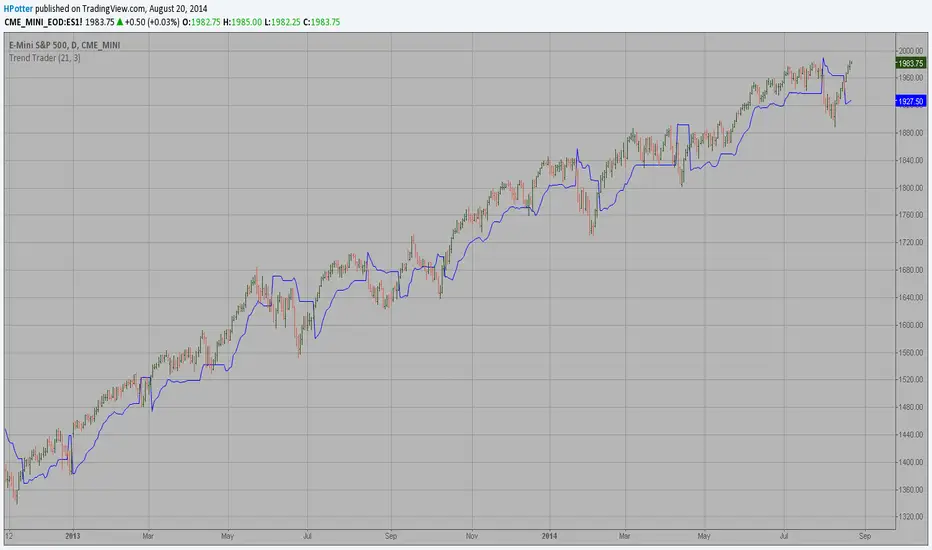
Trend Trader Bands Backtest This is plots the indicator developed by Andrew Abraham
in the Trading the Trend article of TASC September 1998
It was modified, result values wass averages.
And draw two bands above and below TT line.

Trend Trader Bands Strategy This is plots the indicator developed by Andrew Abraham
in the Trading the Trend article of TASC September 1998
It was modified, result values wass averages.
And draw two bands above and below TT line.

Trend Trader Bands This is plots the indicator developed by Andrew Abraham
in the Trading the Trend article of TASC September 1998
It was modified, result values wass averages.
And draw two bands above and below TT line.

Trend Trader AVR Backtest This is plots the indicator developed by Andrew Abraham
in the Trading the Trend article of TASC September 1998
It was modified, result values wass averages.

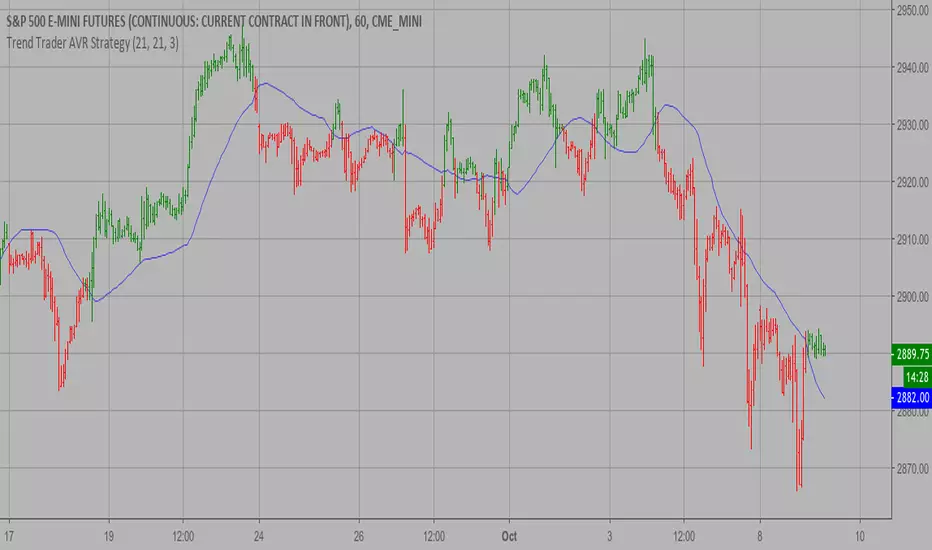
Trend Trader AVR Strategy This is plots the indicator developed by Andrew Abraham
in the Trading the Trend article of TASC September 1998
It was modified, result values wass averages.
Trend Trader AVR This is plots the indicator developed by Andrew Abraham
in the Trading the Trend article of TASC September 1998
It was modified, result values wass averages.

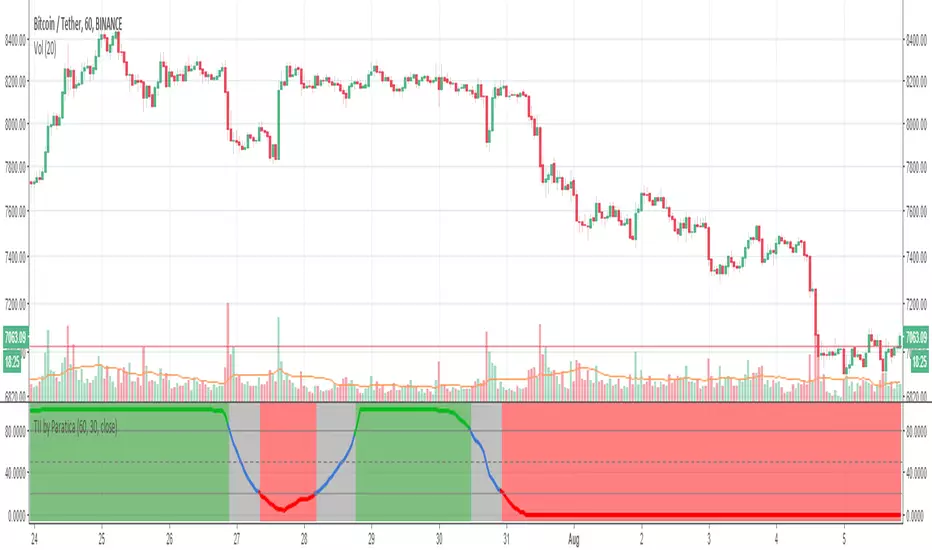
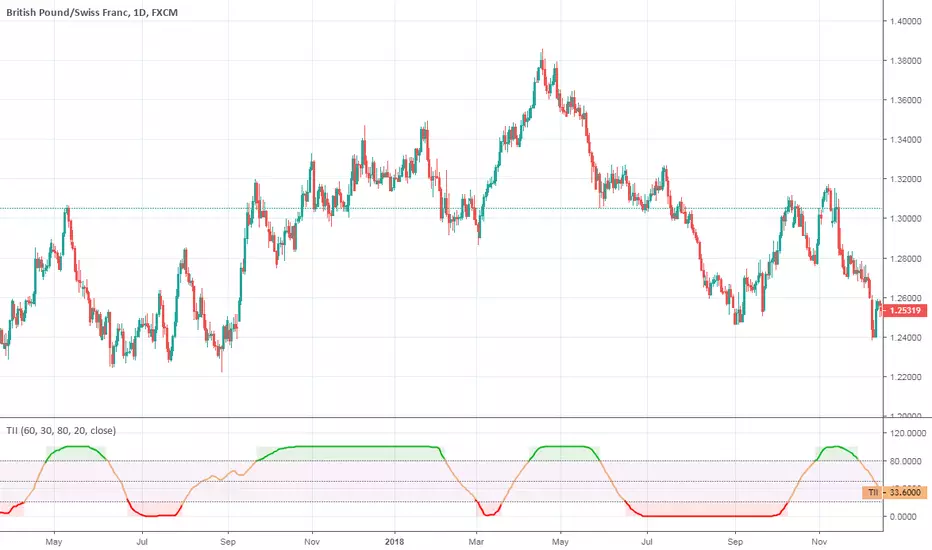
Trend Intensity Index by ParaticaTrend Intensity Index is very strong. It can see next coming trend very early
Trend Continuation FactorTrend Continuation Factor indicator script.
This indicator was originally developed by M.H. Pee (Stocks & Commodities V. 20:3 (58-64): Trend Continuation Factor).

Trend Trigger FactorTrend Trigger Factor indicator script. This indicator was originally developed by M. H. Pee (Stocks & Commodities V.22:12 (28-36): Trend Trigger Factor).

Trend Intensity IndexTrend Intensity Index indicator script. This indicator was originally developed by M. H. Pee (06/2002 issue of Stocks and Commodities Magazine)
Trend Intensity Index [DW]This study is a simple variation of M. H. Pee's Trend Intensity Index that includes two signal lines rather than one for additional trend confirmation.

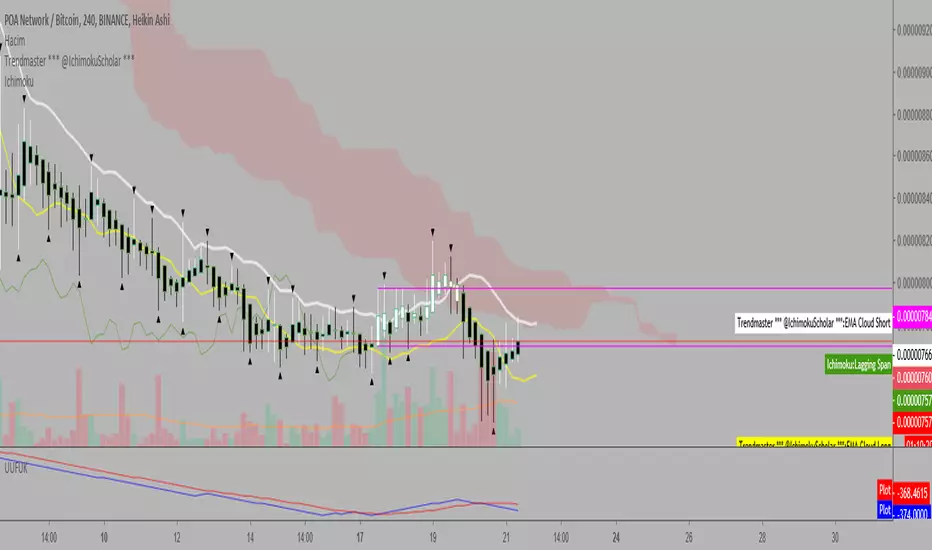
Trend Volume Accumulation R1 by JustUncleLThis simple indicator shows the Accumulated Volume within the current uptrend or downtrend. The uptrend/downtrend is detected by a change in direction of the candles which works very well with Heikin Ashi and Renko charts. Alternatively you can use a Moving average direction to indicate trend direction, which should work on any candle type.
You can select between 11 different types of moving average:
SMA = Simple Moving Average.
EMA = Exponential Moving Average.
WMA = Weighted Moving Average
VWMA = Volume Weighted Moving Average
SMMA = Smoothed Simple Moving Average.
DEMA = Double Exponential Moving Average
TEMA = Triple Exponential Moving Average.
HullMA = Hull Moving Average
SSMA = Ehlers Super Smoother Moving average
ZEMA = Near Zero Lag Exponential Moving Average.
TMA = Triangular (smoothed) Simple Moving Average.
Here is a sample chart using EMA length 6 for trend Direction:

Trend Trader Strategy Backtest This is plots the indicator developed by Andrew Abraham
in the Trading the Trend article of TASC September 1998
You can change long to short in the Input Settings
Please, use it only for learning or paper trading. Do not for real trading.

Trend, Stoch, Price Action or in short: TSPCombining the three most important factors that a trader usually needs in a single indicator.
Red = Trend
Blue = Stoch
Orange = Price Action

Trend Trader This is plots the indicator developed by Andrew Abraham
in the Trading the Trend article of TASC September 1998