UDC - Local TrendsUDC - Local Trends Indicator
Overview:
The UDC - Local Trends Indicator combines multiple moving averages to provide a clear visualization of both local and high timeframe (HTF) trends. This indicator helps traders make informed decisions by highlighting key moving averages and trend zones, making it easier to determine whether the current trend is likely to continue or reverse.
Features:
Local Trend Zone: Displays the range between the 13 and 34 EMAs, with an average line in the middle. This zone is plotted close to the price candles, offering a clear visual guide for the immediate trend on the timeframe you’re viewing.
Usage: Observe the strength of the local trend within this zone. Breaks from this zone may indicate potential moves toward the 200 moving averages, providing early signals for trend continuation or potential reversals.
Current Trend Indicators:
Tracks the broader trend using the 200 EMA and 200 SMA on the active timeframe. Choose a timeframe where these trend lines hold significance and use them alongside support and resistance for precise entries and exits.
Cross-Timeframe Trend Reference:
On all sub-daily timeframes, the daily 200 moving average is overlaid, ensuring this essential trend line is visible even on shorter timeframes, like 4H, where reclaims or rejections of the daily 200 can signal strong trading setups.
The weekly 50 moving average, a critical HTF trend line, is also displayed consistently, guiding higher timeframe swing trade setups.
Trading Strategy:
Local Timeframe Trading:
Monitor the 200 moving averages in your active timeframe to identify bounces or breakdowns. If the local trend zone (13-34 EMA range) is lost, expect a possible pullback to the 200 moving averages, offering a chance for re-entry or confirmation of trend reversal.
High Timeframe Trading (HTF):
For swing trades, observe the daily 200 and weekly 50 moving averages. Reclaiming these lines often triggers long setups, while losing them may signal further downside until they’re regained.
This indicator offers a powerful combination of localized trend tracking and high timeframe support, enabling traders to align their entries with both immediate and overarching market
Cerca negli script per "trend"

WavesLibrary "Waves"
Methods for elliot wave detection
method delete(this)
deletes the subwave drawing
Namespace types: Subwave
Parameters:
this (Subwave) : Subwave object to be deleted
Returns: deleted subwave object
method delete(this)
deletes the wave drawing and the corresponding subwaves
Namespace types: Wave
Parameters:
this (Wave) : Wave object to be deleted
Returns: deleted wave object
method createWave(pivot, lineColor, waves, limit)
Create wave object
Namespace types: zg.Pivot
Parameters:
pivot (Pivot type from Trendoscope/Zigzag/7) : pivot object where the wave needs to be created
lineColor (color) : color of the wave to be drawn
waves (array) : array of existing waves
limit (int) : max number of waves to be shown in the chart
Returns: wave object created
method createSubWaves(wave, subwavePivots)
Create sub waves for the wave
Namespace types: Wave
Parameters:
wave (Wave)
subwavePivots (array) : array of sub wave pivots
Returns: wave object created
method draw(subWave)
Draw subwave
Namespace types: Subwave
Parameters:
subWave (Subwave)
Returns: subwsubWave object
method draw(wave, limitSubwaves)
Draw Wave
Namespace types: Wave
Parameters:
wave (Wave) : Wave object to be drawn
limitSubwaves (bool) : limit the number of subwave combinations within the wave
Returns: wave object
method checkMotiveWave(prices)
based on the price array, check if there is motive wave and identify the type
Namespace types: array
Parameters:
prices (array) : float array of prices
Returns: WaveType representing the identified wave type. na otherwise
method scanMotiveWave(pivot, lastPivot, existingWaves, allowedTypes)
Scan for motive wave
Namespace types: zg.Pivot
Parameters:
pivot (Pivot type from Trendoscope/Zigzag/7) : Zigzag pivot that will be checked for motive wave
lastPivot (Pivot type from Trendoscope/Zigzag/7) : previous Zigzag pivot
existingWaves (array) : array of existing waves
allowedTypes (array) : allowed Wave types to filter them
Returns: array of subwave pivots
SubwavePivots
SubwavePivots represents the sub pivots of the main wave
Fields:
waveType (series WaveType) : Type of the Wave
indices (array) : Bar index values of sub waves
subPivots (array type from Trendoscope/Zigzag/7) : sub pivot objects of the wave
Subwave
Subwave represents the drawing of sub waves
Fields:
waves (array type from Trendoscope/Drawing/1) : array of sub wave lines
points (array type from Trendoscope/Drawing/1) : Array of subwave pivot labels
subwavePivots (SubwavePivots) : array of subwave pivots being drawn
Wave
Wave object type
Fields:
pivot (Pivot type from Trendoscope/Zigzag/7) : starting point of the wave
wave (Line type from Trendoscope/Drawing/1) : Line representing the wave
waveLabel (Label type from Trendoscope/Drawing/1) : label containing wave details
subWaves (array) : array of sub waves
EMA Trend Arrows Indicator### EMA Trend Arrows Indicator
**Description:**
The "EMA Trend Arrows Indicator" is designed to help traders identify bullish and bearish trends based on the Exponential Moving Average (EMA). This indicator plots arrows and lines on the chart, signaling potential trend changes, making it easier for users to spot entry and exit points in their trades.
**Indicator Features:**
1. **EMA Calculation:**
- The indicator calculates the Exponential Moving Average (EMA) over a user-defined period (`Length`).
- The default length is set to 50 periods but can be adjusted to suit different trading strategies.
2. **Trend Detection:**
- The indicator detects bullish trends when the EMA is falling for a specified duration (`Trend Duration`) and then starts rising.
- Conversely, it detects bearish trends when the EMA is rising for a specified duration and then starts falling.
- The default trend duration is set to 20 periods.
3. **Visual Signals:**
- **Bullish Signal:** When a bullish trend is detected, the indicator plots a blue upward arrow (▲) above the bar where the trend change is identified.
- **Bearish Signal:** When a bearish trend is detected, the indicator plots a red downward arrow (▼) below the bar where the trend change is identified.
- Additionally, lines are drawn to indicate the strength and duration of the trends. Blue lines represent bullish trends, while red lines represent bearish trends.
4. **Average True Range (ATR):**
- The indicator utilizes the Average True Range (ATR) to determine the placement of the lines and arrows, ensuring they are appropriately scaled to the price movements.
5. **EMA Plotting:**
- The EMA line is plotted on the chart in a grey color, allowing users to visualize the moving average alongside the trend signals.
6. **Chart Clarity:**
- To maintain a clear and uncluttered chart, the indicator automatically deletes past trend direction signals once a new trend is detected. This ensures that only the most relevant and current trend signals are displayed.
**User Inputs:**
- `Length`: Defines the period for EMA calculation. Default is 50.
- `Trend Duration`: Sets the duration to consider for trend changes. Default is 20.
- `Bullish`: Sets the color for bullish signals. Default is blue (#2962ff).
- `Bearish`: Sets the color for bearish signals. Default is red (#f23645).
- `MA`: Sets the color for the EMA line. Default is grey (#787b86).
**How to Use:**
- Add the "EMA Trend Arrows Indicator" to your chart.
- Configure the `Length` and `Trend Duration` based on your trading strategy.
- Observe the chart for blue upward arrows indicating potential buy signals and red downward arrows indicating potential sell signals.
- Use the plotted EMA line to gauge the overall market trend and make more informed trading decisions.
**Benefits:**
- Simplifies trend detection by providing clear visual signals.
- Helps traders identify potential entry and exit points.
- Customizable settings to fit various trading strategies.
- Maintains a clean chart by automatically removing outdated trend direction signals.
**Example:**
When applied to a daily chart, the indicator can help identify major trend reversals, providing traders with timely buy and sell signals. For instance, a blue arrow appearing after a period of EMA decline signals a potential buying opportunity as the trend shifts to bullish.
Add this indicator to your TradingView chart today to enhance your trend analysis and improve your trading performance.
Best regards Chervolino

Super Trend and RSI Strategy### Super Trend and RSI Strategy: A Brief Overview
The Super Trend and RSI (Relative Strength Index) strategy is a popular trading approach that combines the trend-following capabilities of the Super Trend indicator with the momentum analysis of the RSI. This hybrid strategy aims to provide traders with reliable entry and exit signals by confirming trends and identifying potential reversals.
#### Super Trend Indicator
The Super Trend indicator is a trend-following tool that signals the current market direction. It is calculated using the Average True Range (ATR) to identify volatility and price movement. The indicator plots lines above or below the price, signaling bullish (green) or bearish (red) trends:
- **Buy Signal**: When the price crosses above the Super Trend line and the line turns green.
- **Sell Signal**: When the price crosses below the Super Trend line and the line turns red.
#### Relative Strength Index (RSI)
The RSI is a momentum oscillator that measures the speed and change of price movements on a scale from 0 to 100. It helps identify overbought or oversold conditions:
- **Overbought Condition**: RSI value above 70, suggesting the asset may be overvalued and a correction could be imminent.
- **Oversold Condition**: RSI value below 30, suggesting the asset may be undervalued and a rebound could be imminent.
#### Strategy Implementation
1. **Trend Confirmation with Super Trend**:
- Enter a long position (buy) when the Super Trend turns green and the price closes above it.
- Enter a short position (sell) when the Super Trend turns red and the price closes below it.
2. **Momentum Confirmation with RSI**:
- For long positions, ensure the RSI is not in the overbought zone (preferably below 70).
- For short positions, ensure the RSI is not in the oversold zone (preferably above 30).
3. **Entry Signals**:
- **Buy Signal**: Super Trend turns green, price closes above the Super Trend line, and RSI is below 70.
- **Sell Signal**: Super Trend turns red, price closes below the Super Trend line, and RSI is above 30.
4. **Exit Signals**:
- Close long positions when the Super Trend turns red or the RSI enters the overbought zone.
- Close short positions when the Super Trend turns green or the RSI enters the oversold zone.
#### Advantages and Considerations
- **Advantages**:
- Combines trend-following and momentum analysis for more robust signals.
- Helps filter out false signals by requiring confirmation from both indicators.
- **Considerations**:
- Like all trading strategies, it is not foolproof and can generate false signals.
- Best used in conjunction with other analysis techniques and proper risk management.
- Performance can vary across different market conditions and timeframes.
The Super Trend and RSI strategy is a versatile tool that can enhance trading decisions by providing clearer entry and exit points, helping traders capture significant market moves while avoiding potential pitfalls of relying on a single indicator.

divergingchartpatternLibrary "divergingchartpattern"
Library having implementation of converging chart patterns
getPatternNameByType(patternType)
Returns pattern name based on type
Parameters:
patternType (int) : integer value representing pattern type
Returns: string name of the pattern
method find(this, sProperties, dProperties, patterns, ohlcArray)
find converging patterns for given zigzag
Namespace types: zg.Zigzag
Parameters:
this (Zigzag type from Trendoscope/ZigzagLite/2) : Current zigzag Object
sProperties (ScanProperties) : ScanProperties Object
dProperties (DrawingProperties type from Trendoscope/abstractchartpatterns/5) : DrawingProperties Object
patterns (array type from Trendoscope/abstractchartpatterns/5) : array of existing patterns to check for duplicates
ohlcArray (array type from Trendoscope/ohlc/1) : array of OHLC values for historical reference
Returns: string name of the pattern
ScanProperties
Object containing properties for pattern scanning
Fields:
baseProperties (ScanProperties type from Trendoscope/abstractchartpatterns/5) : Object of Base Scan Properties
convergingDistanceMultiplier (series float)
convergingpatternsLibrary "convergingpatterns"
Library having implementation of converging chart patterns
getPatternNameByType(patternType)
Returns pattern name based on type
Parameters:
patternType (int) : integer value representing pattern type
Returns: string name of the pattern
method find(this, sProperties, dProperties, patterns, ohlcArray)
find converging patterns for given zigzag
Namespace types: zg.Zigzag
Parameters:
this (Zigzag type from Trendoscope/ZigzagLite/2) : Current zigzag Object
sProperties (ScanProperties) : ScanProperties Object
dProperties (DrawingProperties type from Trendoscope/abstractchartpatterns/5) : DrawingProperties Object
patterns (array type from Trendoscope/abstractchartpatterns/5) : array of existing patterns to check for duplicates
ohlcArray (array type from Trendoscope/ohlc/1) : array of OHLC values for historical reference
Returns: string name of the pattern
ScanProperties
Object containing properties for pattern scanning
Fields:
baseProperties (ScanProperties type from Trendoscope/abstractchartpatterns/5) : Object of Base Scan Properties
convergingDistanceMultiplier (series float) : when multiplied with pattern size gets the max number of bars within which the pattern should converge
basechartpatternsLibrary "basechartpatterns"
Library having complete chart pattern implementation
getPatternNameById(id)
Returns pattern name by id
Parameters:
id (int) : pattern id
Returns: Pattern name
method find(points, properties, dProperties, ohlcArray)
Find patterns based on array of points
Namespace types: chart.point
Parameters:
points (chart.point ) : array of chart.point objects
properties (ScanProperties type from Trendoscope/abstractchartpatterns/1) : ScanProperties object
dProperties (DrawingProperties type from Trendoscope/abstractchartpatterns/1) : DrawingProperties object
ohlcArray (OHLC type from Trendoscope/ohlc/1)
Returns: Flag indicating if the pattern is valid, Current Pattern object
method find(this, properties, dProperties, patterns, ohlcArray)
Find patterns based on the currect zigzag object but will not store them in the pattern array.
Namespace types: zg.Zigzag
Parameters:
this (Zigzag type from Trendoscope/ZigzagLite/2) : Zigzag object containing pivots
properties (ScanProperties type from Trendoscope/abstractchartpatterns/1) : ScanProperties object
dProperties (DrawingProperties type from Trendoscope/abstractchartpatterns/1) : DrawingProperties object
patterns (Pattern type from Trendoscope/abstractchartpatterns/1) : Array of Pattern objects
ohlcArray (OHLC type from Trendoscope/ohlc/1)
Returns: Flag indicating if the pattern is valid, Current Pattern object
RMB - Trend AnalysisRMB - Trend Analysis Indicator
Overview:
The "RMB - Trend Analysis" indicator is a powerful tool designed for traders who need a quick and clear visual representation of the trend direction across multiple timeframes. This indicator simplifies the process of trend analysis by displaying trend direction symbols on the chart, allowing traders to make informed decisions. This indicator is usable for all instruments.
Key Features:
Multi-Timeframe Analysis: Provides trend direction for weekly, daily, 4-hour, 2-hour, 1-hour, 30-minute, and 15-minute timeframes.
Trend Direction Symbols: Utilizes intuitive arrow symbols to indicate the trend direction. An upward arrow (↑) signifies an uptrend, while a downward arrow (↓) indicates a downtrend.
Color-Coded Trends: Arrows are color-coded for enhanced visibility and quick interpretation. Green arrows represent uptrends, and red arrows denote downtrends.
Dynamic Updates: The indicator updates the trend symbols in real-time as new price data becomes available, ensuring traders are always informed of the latest trend changes.
Customizable and User-Friendly: Designed with user experience in mind, the indicator is easy to add to any chart and integrates seamlessly with TradingView's interface.
Usage:
This indicator is particularly useful for traders who employ multi-timeframe analysis in their trading strategy. By providing a snapshot of trend directions across different timeframes, it helps in identifying potential entry and exit points, confirming trend continuations, or spotting trend reversals. Whether you are a day trader, swing trader, or long-term investor, the "RMB - Trend Analysis" indicator can be a valuable addition to your trading toolkit.
How it Works:
The indicator calculates the trend direction based on a Simple Moving Average (SMA) over 14 periods. It then displays this information as arrow symbols on the chart, with each symbol corresponding to a specific timeframe. The position and color of these arrows provide an at-a-glance view of the current trend status across various timeframes, aiding in comprehensive market analysis.

Recursive Micro Zigzag🎲 Overview
Zigzag is basic building block for any pattern recognition algorithm. This indicator is a research-oriented tool that combines the concepts of Micro Zigzag and Recursive Zigzag to facilitate a comprehensive analysis of price patterns. This indicator focuses on deriving zigzag on multiple levels in more efficient and enhanced manner in order to support enhanced pattern recognition.
The Recursive Micro Zigzag Indicator utilises the Micro Zigzag as the foundation and applies the Recursive Zigzag technique to derive higher-level zigzags. By integrating these techniques, this indicator enables researchers to analyse price patterns at multiple levels and gain a deeper understanding of market behaviour.
🎲 Concept:
Micro Zigzag Base : The indicator utilises the Micro Zigzag concept to capture detailed price movements within each candle. It allows for the visualisation of the sequential price action within the candle, aiding in pattern recognition at a micro level.
Basic implementation of micro zigzag can be found in this link - Micro-Zigzag
Recursive Zigzag Expansion : Building upon the Micro Zigzag base, the indicator applies the Recursive Zigzag concept to derive higher-level zigzags. Through recursive analysis of the Micro Zigzag's pivots, the indicator uncovers intricate patterns and trends that may not be evident in single-level zigzags.
Earlier implementations of recursive zigzag can be found here:
Recursive Zigzag
Recursive Zigzag - Trendoscope
And the libraries
rZigzag
ZigzagMethods
The major differences in this implementation are
Micro Zigzag Base - Earlier implementation made use of standard zigzag as base whereas this implementation uses Micro Zigzag as base
Not cap on Pivot depth - Earlier implementation was limited by the depth of level 0 zigzag. In this implementation, we are trying to build the recursive algorithm progressively so that there is no cap on the depth of level 0 zigzag. But, if we go for higher levels, there is chance of program timing out due to pine limitations.
These algorithms are useful in automatically spotting patterns on the chart including Harmonic Patterns, Chart Patterns, Elliot Waves and many more.

Custom Trend Indicator with Reversal ArrowsThe Custom Trend Indicator with Reversal Arrows is a user-friendly script designed to help traders identify trends and trend reversals on the TradingView platform. This indicator analyzes price action and generates trend lines based on user-defined rules for uptrends, downtrends, and no-trend conditions. Additionally, it highlights trend reversal points with arrows for easy identification.
Features:
Customizable Line Offset Multiplier: Allows users to set the distance between the trend line and the candlesticks. This makes the trend lines more visually discernible.
Trend Identification:
Uptrend: The indicator plots a green line when the current high, low, and close are greater than the previous high, low, and close, respectively.
Downtrend: The indicator plots a red line when the current high, low, and close are less than the previous high, low, and close, respectively.
No Trend: The indicator plots a black line when neither an uptrend nor a downtrend is identified.
Trend Reversal Arrows: The script displays green arrows pointing upwards for bullish trend reversals and red arrows pointing downwards for bearish trend reversals.
To use this indicator, simply copy and paste the provided Pine Script into the Pine editor on TradingView, and add the indicator to your chart. This powerful and customizable tool will enhance your ability to identify trends and capitalize on trend reversals in your trading strategy.
Please note that this indicator is intended for educational purposes only and should not be considered as financial advice. Always perform your own due diligence and consult with a financial professional before making any trading decisions.

Chatterjee CorrelationThis is my first attempt on implementing a statistical method. This problem was given to me by @lejmer (who also helped me later on building more efficient code to achieve this) when we were debating on the need for higher resource allocation to run scripts so it can run longer and faster. The major problem faced by those who want to implement statistics based methods is that they run out of processing time or need to limit the data samples. My point was that such things need be implemented with an algorithm which suits pine instead of trying to port a python code directly. And yes, I am able to demonstrate that by using this implementation of Chatterjee Correlation.
🎲 What is Chatterjee Correlation?
The Chatterjee rank Correlation Coefficient (CCC) is a method developed by Sourav Chatterjee which can be used to study non linear correlation between two series.
Full documentation on the method can be found here:
arxiv.org
In short, the formula which we are implementing here is:
Algorithm can be simplified as follows:
1. Get the ranks of X
2. Get the ranks of Y
3. Sort ranks of Y in the order of X (Lets call this SortedYIndices)
4. Calculate the sum of adjacent Y ranks in SortedYIndices (Lets call it as SumOfAdjacentSortedIndices)
5. And finally the correlation coefficient can be calculated by using simple formula
CCC = 1 - (3*SumOfAdjacentSortedIndices)/(n^2 - 1)
🎲 Looks simple? What is the catch?
Mistake many people do here is that they think in Python/Java/C etc while coding in Pine. This makes code less efficient if it involves arrays and loops. And the simple code may look something like this.
var xArray = array.new()
var yArray = array.new()
array.push(xArray, x)
array.push(yArray, y)
sortX = array.sort_indices(xArray)
sortY = array.sort_indices(yArray)
SumOfAdjacentSortedIndices = 0.0
index = array.get(xSortIndices, 0)
for i=1 to n > 1? n -1 : na
indexNext = array.get(sortX, i)
SumOfAdjacentSortedIndices += math.abs(array.get(sortY, indexNext)-array.get(sortY, index))
index := indexNext
correlation := 1 - 3*SumOfAdjacentSortedIndices/(math.pow(n,2)-1)
But, problem here is the number of loops run. Remember pine executes the code on every bar. There are loops run in array.sort_indices and another loop we are running to calculate SumOfAdjacentSortedIndices. Due to this, chances of program throwing runtime errors due to script running for too long are pretty high. This limits greatly the number of samples against which we can run the study. The options to overcome are
Limit the sample size and calculate only between certain bars - this is not ideal as smaller sets are more likely to yield false or inconsistent results.
Start thinking in pine instead of python and code in such a way that it is optimised for pine. - This is exactly what we have done in the published code.
🎲 How to think in Pine?
In order to think in pine, you should try to eliminate the loops as much as possible. Specially on the data which is continuously growing.
My first thought was that sorting takes lots of time and need to find a better way to sort series - specially when it is a growing data set. Hence, I came up with this library which implements Binary Insertion Sort.
Replacing array.sort_indices with binary insertion sort will greatly reduce the number of loops run on each bar. In binary insertion sort, the array will remain sorted and any item we add, it will keep adding it in the existing sort order so that there is no need to run separate sort. This allows us to work with bigger data sets and can utilise full 20,000 bars for calculation instead of few 100s.
However, last loop where we calculate SumOfAdjacentSortedIndices is not replaceable easily. Hence, we only limit these iterations to certain bars (Even though we use complete sample size). Plots are made for only those bars where the results need to be printed.
🎲 Implementation
Current implementation is limited to few combinations of x and fixed y. But, will be converting this into library soon - which means, programmers can plug any x and y and get the correlation.
Our X here can be
Average volume
ATR
And our Y is distance of price from moving average - which identifies trend.
Thus, the indicator here helps to understand the correlation coefficient between volume and trend OR volatility and trend for given ticker and timeframe. Value closer to 1 means highly correlated and value closer to 0 means least correlated. Please note that this method will not tell how these values are correlated. That is, we will not be able to know if higher volume leads to higher trend or lower trend. But, we can say whether volume impacts trend or not.
Please note that values can differ by great extent for different timeframes. For example, if you look at 1D timeframe, you may get higher value of correlation coefficient whereas lower value for 1m timeframe. This means, volume to trend correlation is higher in 1D timeframe and lower in lower timeframes.

Crypto Volume/Strength ComparatorHello Traders,
Here is an attempt to perform comparative analysis between top cryptos based on strength (oscillator) and volume. Methodology used here is similar to Magic Number formula described in the post : Enhanced Magic Formula for fundamental analysis . But, instead of using fundamentals, we are making use of few technicals to derive similar outcome. Usage of the available stats will not be same as Magic number since we are using technicals.
⬜ Process
▶ Get crypto exchange based on prefix of instrument being used.
▶ For the given exchange, get data for all the tickers available in input fields.
▶ Calculate Oscillator, Momentum based on price for each tickers.
▶ Calculate Oscillator, Momentum based on volume for each tickers.
▶ Calculate Volatility for each tickers.
▶ Rank Price-Oscillator, Price-Momentum, Volume-Oscillator, Volume-Momentum, Volatility for each tickers.
▶ Calculate combined rank by adding up individual ranks.
▶ Calculate movement of rankings from bar to bar
▶ Sort tickers based on rank and populate them on table. Display direction of rankings.
⬜ Components
Display components are as follows:
⬜ Settings
Settings are pretty simple and straightforward
⬜ Calculations
▶ Oscillators : High values of oscillators are considered as ideal as the process is intended towards finding trend.
▶ Momentum : Momentum is calculated on the basis of Squeeze Momentum Indicator by @LazyBear.
▶ Volatility : Volatility is calculated on the basis of Williams Vix Fix by @ChrisMoody. Here too since we are in trend following mode, lower vix fix is considered ideal.
⬜ Few Notes
Tickers will show data only if selected exchange has them. Some tickers are not available in all exchanges. In that case, it will show NAN. This is kind of unavoidable as we need to have fixed size arrays for any calculations.
Indicator works only on crypto tickers which has valid exchange.
Tickers move through the rankings in real time. Background of all stats are based on gradient from green to red.
Tickers on top may not always have better long opportunity or tickers at bottom may not always be optimal for shorting. We need to consider how long the instrument may stay in the position or how fast it is moving in opposite direction. Hence, directions of the ranking movement are also shown on the table.

TrendRangeIdentifier V2This is the enhanced version of TrendRangeIdentifier:
Highlights of this version are:
Different ATR multiplier used based on trend.
Supertrend is used for trend bias for determining which ATR to use on which side
Crossover is based on option selected. It can be either high, low or close price which is determined by crossover type selected.
Remaining parameters remain same as that of original indicator.

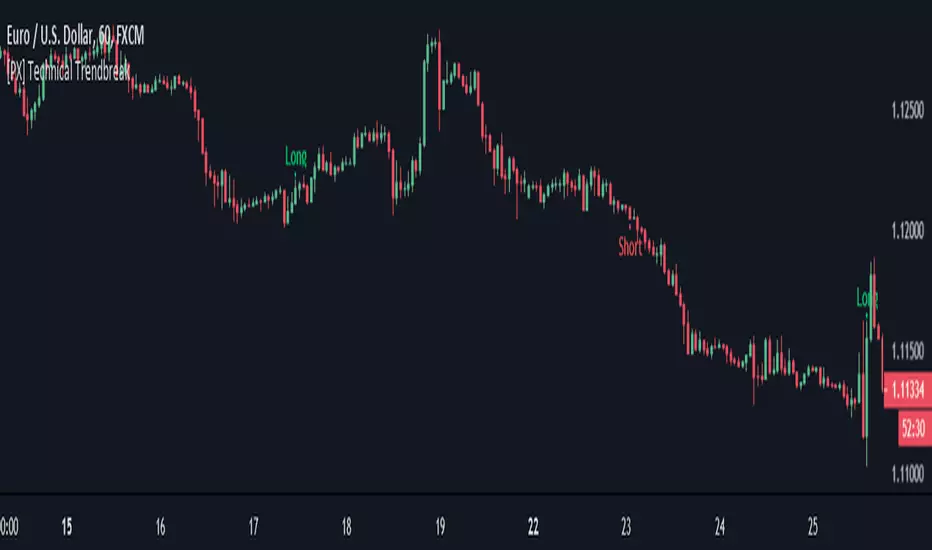
[PX] Technical TrendbreakThis script identifies a technical break of the current trend. Its shows when the swing point before the most recent extreme (high or low) is taken out. The indicator can help you to identify when the current trend is weakening or momentum is slowing down. It is not a standalone script, that you should use for automated trading. It works best when a clear trend is in progress and new extremes are made (such as all-time-high, all-time-low). It should be avoided for sideways movements.
The length parameter determines how many candles should be taken into consideration for calculation of the extremes.
If you are looking for someone to develop your own indicator or trading strategy, don't hesitate to get in touch with me here on TradingView or below.
Contact:
www.pascal-simon.de
info@pascal-simon.de
Intraday Market Context (Trend & Risk)📌 Intraday Market Context (Trend & Risk)
Overview
Intraday Market Context (Trend & Risk) is a non-signal, informational indicator designed to provide a high-level view of current market conditions. Instead of generating buy or sell signals, this tool helps traders understand what kind of market they are operating in and how cautious or aggressive they should be.The output is shown as a clean, fixed on-chart box with plain-language guidance.
What This Indicator Shows
The indicator displays three simple elements:
1️⃣ Market Type
Identifies the current market environment:
Trending Market
Sideways Market
Expanding / Breakout Market
Unclear Market
2️⃣ Risk Mode
Provides a relative assessment of market risk:
Normal Risk
Medium Risk
High Risk
This is contextual information only and does not imply trade direction.
3️⃣ What to Do
Plain-language behavioral guidance, not trade instructions:
Trend is Friend
Range is Friend
Wait for Pullback
Stay Out
These phrases are meant to guide trader behavior, not trigger trades.
How to Use
Use this indicator as a market context filter, not as a trading signal
Decide when to trade, trade cautiously, or stay out
Use your own execution tools (price action, EMAs, VWAP, structure, etc.) for entries and exits
Respect “Stay Out” conditions to avoid over-trading in unfavorable environments
This indicator works best as a decision-support overlay, especially for intraday traders.
What This Indicator Is NOT
❌ Not a buy/sell signal
❌ Not a trading strategy
❌ Not predictive
❌ Not a replacement for risk management
Important Disclaimer
This indicator is provided for educational and informational purposes only.It does not constitute financial advice, investment advice, or a recommendation to trade any instrument.Trading involves risk, and losses can exceed expectations. Always use proper risk management and make your own trading decisions.

Kira Buy Sell EMA & VWAP Trend IndicatorThis indicator provides buy and sell signals based on short-term
momentum shifts while aligning trades with the broader market
trend.
Core logic:
• Fast and slow EMAs are used to identify short-term momentum
changes
• VWAP is applied to confirm price acceptance in the trade
direction
• A higher-period EMA is used as a trend filter to reduce
counter-trend signals
Buy signals are generated when bullish momentum aligns with
VWAP positioning and the prevailing trend. Sell signals are
generated when bearish momentum aligns with VWAP and the
broader trend direction.
This approach keeps the logic simple and responsive while
helping to avoid signals during unfavorable market conditions.
Best suited for liquid stocks and indices on intraday
timeframes such as 5-minute to 1-hour charts.
This script does not repaint and is intended as a
decision-support indicator, not a standalone trading system.

KING Super Trend Hull (Multi MA)super trende ortalamalar eklendi. alexander ma degisken ortalama gibi..

SuperBuy/TrendFollowing This Pine Script indicator "SuperBuy/TrendFollowing" is a trading tool that combines trend-following and momentum strategies. Here's what it does:
**Main Functions:**
- Plots a dynamic trend line based on weighted EMA calculations
- Generates "B" buy signals when price crosses above the trend line with confirmed momentum
- Generates "S" sell signals when price crosses below the trend line with bearish confirmation
- Uses volume-weighted moving averages and price momentum filters
- Changes trend line color (green/blue) based on price position relative to the trend
**Key Features:**
- Combines multiple technical factors: price momentum, volume surges, and trend confirmation
- Includes customizable thresholds for signal sensitivity
- Provides visual alerts with triangle shapes and text labels
- Sets up alert conditions for automated notifications

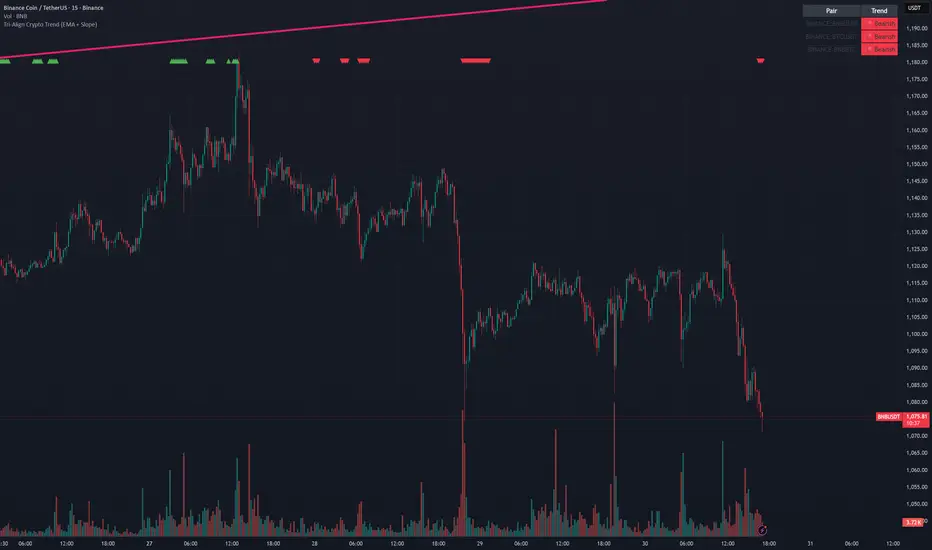
Tri-Align Crypto Trend (EMA + Slope)**Tri-Align Crypto Trend (EMA + Slope)**
Quickly see whether your coin is trending *with* Bitcoin. The indicator evaluates three pairs—**COIN/USDT**, **BTC/USDT**, and **COIN/BTC**—using a fast/slow EMA crossover plus the fast EMA’s slope. Each pair is tagged **Bullish / Bearish / Neutral** in a compact, color-coded table. Alerts fire when **all three** trends align (all bullish or all bearish).
**How to use**
1. Add the indicator to any crypto chart.
2. Set the three symbols (defaults: BNB/USDT, BTC/USDT, BNB/BTC) and optionally choose a signal timeframe.
3. Tune **Fast EMA**, **Slow EMA**, **Slope Lookback**, and **Min |Slope| %** to filter noise and require stronger momentum.
4. Create alerts: *Add alert →* choose the indicator and select **All Three Bullish**, **All Three Bearish**, or **All Three Aligned**.
**Logic**
* Bullish: `EMA_fast > EMA_slow` **and** fast EMA slope ≥ threshold
* Bearish: `EMA_fast < EMA_slow` **and** fast EMA slope ≤ −threshold
* Otherwise: Neutral
Tip: The **COIN/BTC** row reflects relative strength vs BTC—use it to avoid chasing coins that lag the benchmark. (For educational purposes; not financial advice.)
EMA Trend ScreenerThe EMA Trend Screener is a multi-symbol dashboard that quickly shows the trend direction of up to 40 cryptocurrencies (or any selected assets) based on their relationship to a chosen Exponential Moving Average (EMA).
For each symbol, the script checks whether the current price is above or below the specified EMA (default 75).
• Green = Uptrend (price above EMA)
• Red = Downtrend (price below EMA)
All results are displayed in a compact on-chart table, updating in real time for your selected timeframe.
Main benefits:
• Instantly monitor trend direction across multiple coins or markets
• Fully customizable symbol list (up to 40 assets)
• Adjustable EMA length for different trading styles
• Works on any timeframe
• Lightweight and efficient visual summary
In short:
EMA Trend Screener gives traders a fast, clean overview of which markets are trending up or down — ideal for trend following, momentum filtering, or trade selection.
Сreated with vibecoding using ChatGPT and Claude.
Multi-Timeframe Trend Table - EMA Based Trend Analysis📊 Stay Aligned with Higher Timeframe Trends While Scalping
This powerful indicator displays real-time trend direction for 1-hour and 4-hour timeframes in a clean, easy-to-read table format. Perfect for traders who want to align their short-term trades with higher timeframe momentum.
🎯 Key Features
Multi-Timeframe Analysis: Monitor 1H and 4H trends while trading on any timeframe (3min, 5min, 15min, etc.)
EMA-Based Logic: Uses proven EMA 50 and EMA 100 crossover methodology
Visual Clarity: Color-coded table with green (uptrend) and red (downtrend) indicators
Customizable Display: Toggle EMA values and adjust table position
Real-Time Updates: Automatically refreshes with each bar close
Lightweight: Minimal resource usage with efficient data requests
📈 How It Works
The indicator determines trend direction using a simple but effective rule:
UPTREND: Price is above both EMA 50 AND EMA 100
DOWNTREND: Price is below either EMA 50 OR EMA 100
🔧 Settings
Show EMA Values: Display actual EMA 50/100 values in the table
Table Position: Choose from 4 corner positions (Top Right, Top Left, Bottom Right, Bottom Left)
Plot Current EMAs: Optional display of EMA lines on your current chart
💡 Trading Applications
✅ Trend Confirmation: Ensure your trades align with higher timeframe direction
✅ Risk Management: Avoid counter-trend trades in strong directional markets
✅ Entry Timing: Use lower timeframe for entries while respecting higher timeframe bias
✅ Scalping Enhancement: Perfect for 1-5 minute scalping with higher timeframe context
🎨 Visual Design
Clean, professional table design
Intuitive color coding (Green = Up, Red = Down)
Compact size that doesn't obstruct your chart
Clear typography for quick reading
📋 Perfect For
Day traders and scalpers
Swing traders seeking trend confirmation
Multi-timeframe analysis enthusiasts
Traders who want simple, effective trend identification
🚀 Easy Setup
Add to any chart (works on all timeframes)
Customize table position and settings
Start trading with higher timeframe awareness
Watch the table update automatically
No complex configurations needed - just add and trade!
This indicator is designed for educational and informational purposes. Always combine with proper risk management and your own analysis.

Renko Trend Indicator with High/LowRenko Trend Indicator with High/Low
Version: 1.0
Pine Script Version: 5
Type: Indicator
Overlay: Yes
Description
The Renko Trend Indicator with High/Low provides a visual representation of market trends using Renko-style calculations based on either a fixed brick size or ATR (Average True Range). It helps traders identify trend direction, potential reversals, and key support/resistance levels.
The indicator plots Renko-based trend signals directly on your chart and provides a colored Renko close line, making trend analysis simpler and clearer.
Features
Customizable Renko Brick Size
Fixed brick size or dynamic ATR-based bricks.
Step input for precise control over brick size.
Trend Identification
Detects uptrend and downtrend based on Renko logic.
Plots visual signals for trend direction:
Green triangle below bars → Uptrend
Red triangle above bars → Downtrend
Renko Close Line
Shows the Renko-adjusted closing price as a line.
Line color changes with trend (green for uptrend, red for downtrend).
Inputs
Name Type Default Description
Brick Size float 50 Size of Renko bricks (price units)
Use ATR for Brick Size? bool false Enable ATR-based dynamic brick sizing
ATR Period int 14 Number of periods for ATR calculation if enabled
How It Works
The indicator calculates Renko bricks using either a fixed size or ATR.
It maintains internal variables:
renko_close → Current Renko price
renko_high → Highest point of the current trend
renko_low → Lowest point of the current trend
trend → Current trend direction (1 for uptrend, -1 for downtrend)
last_extreme → Last extreme point to detect trend reversal
When price moves above or below the Renko threshold, the trend is updated.
Trend signals are plotted on the chart for easy visualization.
Plots
Plot Name Description Color
Up Trend Triangle below bar when trend is up Green
Down Trend Triangle above bar when trend is down Red
Renko Close Line connecting Renko-adjusted close prices Green (up) / Red (down)
Usage
Add the indicator to any chart with your preferred timeframe.
Configure the brick size or enable ATR-based bricks for dynamic calculation.
Observe the trend triangles and Renko line to identify trend direction and potential reversals.
Can be used in combination with other indicators or strategies for trading decisions.
Notes
This indicator is for analysis purposes only and does not place trades automatically.
ATR-based bricks adapt to market volatility, while fixed bricks provide a static reference.
Works best on liquid markets with regular price movements.
Example Chart
Green triangles below bars signal a buying trend.
Red triangles above bars signal a selling trend.
The colored Renko line shows the trend progression visually.
Author
DB
Pine Script Version: 5
License: MIT
