MTF Trend Dashboard (PSAR, SuperTrend, 200EMA, 9/30 EMA)This script is a multi–timeframe trend dashboard designed to quickly show the market bias across several timeframes in one place.
It does not generate buy/sell signals – it is a visual decision tool to support your own strategy.
What it shows
For up to 5 selectable timeframes, the table displays:
Parabolic SAR – whether PSAR is below (bullish) or above (bearish) the candle.
Supertrend – whether the Supertrend line is below or above the price.
200 EMA status – whether price is trading above (bullish trend) or below (bearish trend) the 200 EMA.
9 / 30 EMA crossover – whether 9 EMA is above (bullish) or below (bearish) the 30 EMA.
Green cells represent bullish conditions, red cells represent bearish conditions.
How to use
Quickly check higher–timeframe trend alignment before entering trades.
Use it as a trend filter for scalping or intraday entries on lower timeframes.
Combine with your own price action / SMC / support–resistance rules for actual entries and exits.
Cerca negli script per "trend"

Breakout Signal (Trend+ATR+ADX+Score)Breakout Signal – Trend + ATR + ADX + Strength Score
This indicator detects high-quality bullish breakout conditions using a multi-filter confirmation system designed to reduce false signals and highlight only strong momentum events.
A breakout signal triggers when all core conditions align:
📌 Breakout Conditions
1. Price Breakout
Breakout occurs when the current high exceeds the previous close by X%.
This avoids noisy open-based signals and focuses on genuine upward expansion.
2. Volume Spike
Current volume must be higher than the average volume × multiplier.
This ensures the breakout is supported by real trading activity.
3. Trend Filter (MA)
Price must be trading above a moving average.
This prevents counter-trend breakouts and focuses on momentum continuation.
4. ATR Rising
ATR must be rising relative to its own moving average.
A rising ATR confirms volatility expansion — a key ingredient of valid breakouts.
5. ADX Trend Strength
ADX must exceed a user-defined threshold (default: 20).
This confirms the market is in a strong trend environment, reducing false signals.
⭐ Breakout Strength Score (0–5)
Each of the 5 filters contributes 1 point:
Trend OK
Volume Spike
ATR Rising
ADX Strong
Price Breakout
A score label appears on valid breakouts:
5/5 → Very strong breakout
4/5 → Strong breakout
3/5 → Moderate breakout
0–2 → Weak / avoided signals

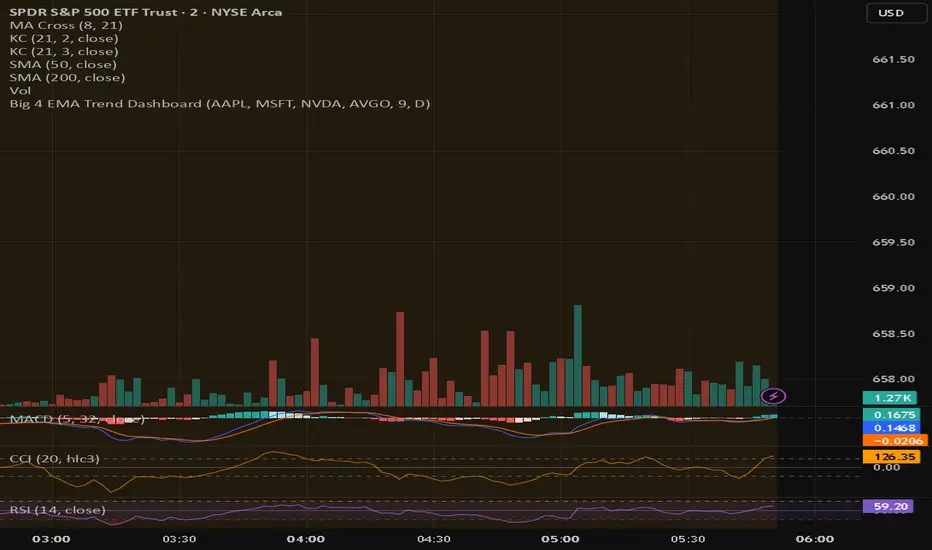
Big 4 EMA Trend DashboardQuickly see the trend direction of your top four stocks using a customizable EMA. Each stock shows as a colored tile: green if price is above the EMA, red if below. A summary label shows whether all four stocks are trending up, down, or mixed.
Key Features:
Track 4 user-defined symbols at a glance
Custom EMA length and optional timeframe override
Compact dashboard ideal for scalping and day trading
MTF Market Bias+ (Smart Multi-Timeframe Trend Dashboard)The MTF Market Bias+ indicator provides a clear, data-driven view of market direction across multiple timeframes — from scalper to swing trader level.
It automatically calculates the bullish / bearish / neutral bias for each selected timeframe using various configurable methods such as EMA slope, price vs EMA, or EMA50 vs EMA200.
This tool gives you an instant overview of market alignment and helps you identify when lower and higher timeframes are in sync — the most powerful condition for high-probability trades.
🔍 Core Features
✅ Multi-Timeframe Bias Dashboard: Visual table showing bullish/bearish sentiment across your chosen timeframes (from 3m to 1W).
⚙️ Customizable Methods: Choose between
EMA Slope (default) → detects trend direction by EMA momentum
Price vs EMA → shows short-term strength or weakness
EMA50 vs EMA200 → classic golden cross vs death cross structure
🎨 Configurable Colors, Size & Layout: Adjust background, text, and label sizes for any chart style.
📊 Summary Row: Displays the majority trend (bullish, bearish, or neutral) with real-time score.
🧩 Adaptive Background Mode (optional): Automatically colors your chart background according to overall bias.
💡 Method Info Panel: Clearly shows which method and parameters are active (e.g. “EMA Slope | EMA=50”).
📈 How to Use
Add the indicator to your chart.
Select the timeframes you want to monitor (e.g. 3m, 5m, 15m, 1h, 4h, D, W).
Watch for alignment between lower and higher timeframes:
When all turn green → strong bullish alignment → consider longs.
When all turn red → strong bearish alignment → consider shorts.
Mixed colors indicate consolidation or correction phases.
Combine it with your favorite Fair Value Gap, CHOCH/BOS, or Liquidity Sweep strategy to significantly improve trade timing and confidence.
🧩 Author’s Note
This indicator is designed for traders who want fast, visual confirmation of multi-timeframe structure without cluttering their charts.
It’s simple, lightweight, and highly adaptable — whether you’re scalping on 3-minute charts or swing trading daily candles.

[blackcat] L2 Trend LinearityOVERVIEW
The L2 Trend Linearity indicator is a sophisticated market analysis tool designed to help traders identify and visualize market trend linearity by analyzing price action relative to dynamic support and resistance zones. This powerful Pine Script indicator utilizes the Arnaud Legoux Moving Average (ALMA) algorithm to calculate weighted price calculations and generate dynamic support/resistance zones that adapt to changing market conditions. By visualizing market zones through colored candles and histograms, the indicator provides clear visual cues about market momentum and potential trading opportunities. The script generates buy/sell signals based on zone crossovers, making it an invaluable tool for both technical analysis and automated trading strategies. Whether you're a day trader, swing trader, or algorithmic trader, this indicator can help you identify market regimes, support/resistance levels, and potential entry/exit points with greater precision.
FEATURES
Dynamic Support/Resistance Zones: Calculates dynamic support (bear market zone) and resistance (bull market zone) using weighted price calculations and ALMA smoothing
Visual Market Representation: Color-coded candles and histograms provide immediate visual feedback about market conditions
Smart Signal Generation: Automatic buy/sell signals generated from zone crossovers with clear visual indicators
Customizable Parameters: Four different ALMA smoothing parameters for various timeframes and trading styles
Multi-Timeframe Compatibility: Works across different timeframes from 1-minute to weekly charts
Real-time Analysis: Provides instant feedback on market momentum and trend direction
Clear Visual Cues: Green candles indicate bullish momentum, red candles indicate bearish momentum, and white candles indicate neutral conditions
Histogram Visualization: Blue histogram shows bear market zone (below support), aqua histogram shows bull market zone (above resistance)
Signal Labels: "B" labels mark buy signals (price crosses above resistance), "S" labels mark sell signals (price crosses below support)
Overlay Functionality: Works as an overlay indicator without cluttering the chart with unnecessary elements
Highly Customizable: All parameters can be adjusted to suit different trading strategies and market conditions
HOW TO USE
Add the Indicator to Your Chart
Open TradingView and navigate to your desired trading instrument
Click on "Indicators" in the top menu and select "New"
Search for "L2 Trend Linearity" or paste the Pine Script code
Click "Add to Chart" to apply the indicator
Configure the Parameters
ALMA Length Short: Set the short-term smoothing parameter (default: 3). Lower values provide more responsive signals but may generate more false signals
ALMA Length Medium: Set the medium-term smoothing parameter (default: 5). This provides a balance between responsiveness and stability
ALMA Length Long: Set the long-term smoothing parameter (default: 13). Higher values provide more stable signals but with less responsiveness
ALMA Length Very Long: Set the very long-term smoothing parameter (default: 21). This provides the most stable support/resistance levels
Understand the Visual Elements
Green Candles: Indicate bullish momentum when price is above the bear market zone (support)
Red Candles: Indicate bearish momentum when price is below the bull market zone (resistance)
White Candles: Indicate neutral market conditions when price is between support and resistance zones
Blue Histogram: Shows bear market zone when price is below support level
Aqua Histogram: Shows bull market zone when price is above resistance level
"B" Labels: Mark buy signals when price crosses above resistance
"S" Labels: Mark sell signals when price crosses below support
Identify Market Regimes
Bullish Regime: Price consistently above resistance zone with green candles and aqua histogram
Bearish Regime: Price consistently below support zone with red candles and blue histogram
Neutral Regime: Price oscillating between support and resistance zones with white candles
Generate Trading Signals
Buy Signals: Look for price crossing above the bull market zone (resistance) with confirmation from green candles
Sell Signals: Look for price crossing below the bear market zone (support) with confirmation from red candles
Confirmation: Always wait for confirmation from candle color changes before entering trades
Optimize for Different Timeframes
Scalping: Use shorter ALMA lengths (3-5) for 1-5 minute charts
Day Trading: Use medium ALMA lengths (5-13) for 15-60 minute charts
Swing Trading: Use longer ALMA lengths (13-21) for 1-4 hour charts
Position Trading: Use very long ALMA lengths (21+) for daily and weekly charts
LIMITATIONS
Whipsaw Markets: The indicator may generate false signals in choppy, sideways markets where price oscillates rapidly between support and resistance
Lagging Nature: Like all moving average-based indicators, there is inherent lag in the calculations, which may result in delayed signals
Not a Standalone Tool: This indicator should be used in conjunction with other technical analysis tools and risk management strategies
Market Structure Dependency: Performance may vary depending on market structure and volatility conditions
Parameter Sensitivity: Different markets may require different parameter settings for optimal performance
No Volume Integration: The indicator does not incorporate volume data, which could provide additional confirmation signals
Limited Backtesting: Pine Script limitations may restrict comprehensive backtesting capabilities
Not Suitable for All Instruments: May perform differently on stocks, forex, crypto, and futures markets
Requires Confirmation: Signals should always be confirmed with other indicators or price action analysis
Not Predictive: The indicator identifies current market conditions but does not predict future price movements
NOTES
ALMA Algorithm: The indicator uses the Arnaud Legoux Moving Average (ALMA) algorithm, which is known for its excellent smoothing capabilities and reduced lag compared to traditional moving averages
Weighted Price Calculations: The bear market zone uses (2low + close) / 3, while the bull market zone uses (high + 2close) / 3, providing more weight to recent price action
Dynamic Zones: The support and resistance zones are dynamic and adapt to changing market conditions, making them more responsive than static levels
Color Psychology: The color scheme follows traditional trading psychology - green for bullish, red for bearish, and white for neutral
Signal Timing: The signals are generated on the close of each bar, ensuring they are based on complete price action
Label Positioning: Buy signals appear below the bar (red "B" label), while sell signals appear above the bar (green "S" label)
Multiple Timeframes: The indicator can be applied to multiple timeframes simultaneously for comprehensive analysis
Risk Management: Always use proper risk management techniques when trading based on indicator signals
Market Context: Consider the overall market context and trend direction when interpreting signals
Confirmation: Look for confirmation from other indicators or price action patterns before entering trades
Practice: Test the indicator on historical data before using it in live trading
Customization: Feel free to experiment with different parameter combinations to find what works best for your trading style
THANKS
Special thanks to the TradingView community and the Pine Script developers for creating such a powerful and flexible platform for technical analysis. This indicator builds upon the foundation of the ALMA algorithm and various moving average techniques developed by technical analysis pioneers. The concept of dynamic support and resistance zones has been refined over decades of market analysis, and this script represents a modern implementation of these timeless principles. We acknowledge the contributions of all traders and developers who have contributed to the evolution of technical analysis and continue to push the boundaries of what's possible with algorithmic trading tools.

[blackcat] L1 Value Trend IndicatorOVERVIEW
The L1 Value Trend Indicator is a sophisticated technical analysis tool designed for TradingView users seeking advanced market trend identification and trading signals. This comprehensive indicator combines multiple analytical techniques to provide traders with a holistic view of market dynamics, helping identify potential entry and exit points through various signal mechanisms. 📈 It features a main Value Trend line along with a lagged version, golden cross and dead cross signals, and multiple technical indicators including RSI, Williams %R, Stochastic %K/D, and Relative Strength calculations. The indicator also includes reference levels for support and resistance analysis, making it a versatile tool for both short-term and long-term trading strategies. ✅
FEATURES
📈 Primary Value Trend Line: Calculates a smoothed value trend using a combination of SMA and custom smoothing techniques
🔍 Value Trend Lag: Implements a lagged version of the main trend line for cross-over analysis
🚀 Golden Cross & Dead Cross Signals: Identifies buy/sell opportunities when the main trend line crosses its lagged version
💸 Multi-Indicator Integration: Combines multiple technical analysis tools for comprehensive market view
📊 RSI Calculations: Includes 6-period, 7-period, and 13-period RSI calculations for momentum analysis
📈 Williams %R: Provides overbought/oversold conditions using the Williams %R formula
📉 Stochastic Oscillator: Implements both Stochastic %K and %D calculations for momentum confirmation
📋 Relative Strength: Calculates relative strength based on highest highs and current price
✅ Visual Labels: Displays BUY and SELL labels on chart when crossover conditions are met
📣 Alert Conditions: Provides automated alert conditions for golden cross and dead cross events
📌 Reference Levels: Plots entry (25) and exit (75) reference lines for support/resistance analysis
HOW TO USE
Copy the Script: Copy the complete Pine Script code from the original file
Open TradingView: Navigate to TradingView website or application
Access Pine Editor: Go to the Pine Script editor (usually found in the chart toolbar)
Paste Code: Paste the copied script into the editor
Save Script: Save the script with a descriptive name like " L1 Value Trend Indicator"
Select Chart: Choose the chart where you want to apply the indicator
Add Indicator: Apply the indicator to your chart
Configure Parameters: Adjust input parameters to customize behavior
Monitor Signals: Watch for golden cross (BUY) and dead cross (SELL) signals
Use Reference Levels: Monitor entry (25) and exit (75) lines for support/resistance levels
LIMITATIONS
⚠️ Potential Repainting: The script may repaint due to lookahead bias in some calculations
📉 Lookahead Bias: Some calculations may reference future values, potentially causing repainting issues
🔄 Parameter Sensitivity: Results may vary significantly with different parameter settings
📉 Computational Complexity: May impact chart performance with heavy calculations on large datasets
📊 Resource Usage: Requires significant processing power for multiple indicator calculations
🔄 Data Sensitivity: Results may be affected by data quality and market conditions
NOTES
📈 Signal Timing: Cross-over signals may lag behind actual price movements
📉 Parameter Optimization: Optimal parameters may vary by market conditions and asset type
📋 Market Conditions: Performance may vary significantly across different market environments
📈 Multi-Indicator: Combine signals with other technical indicators for confirmation
📉 Timeframe Analysis: Use multiple timeframes for enhanced signal accuracy
📋 Volume Analysis: Incorporate volume data for additional confirmation
📈 Strategy Integration: Consider using this indicator as part of a broader trading strategy
📉 Risk Management: Use signals as part of a comprehensive risk management approach
📋 Backtesting: Test parameter combinations with historical data before live trading
THANKS
🙏 Original Creator: blackcat1402 creates the L1 Value Trend Indicator
📚 Community Contributions: Recognition to TradingView community for continuous improvements and contributions
📈 Collaborative Development: Appreciation for collaborative efforts in enhancing technical analysis tools
📉 TradingView Community: Special thanks to TradingView community members for their ongoing support and feedback
📋 Educational Resources: Recognition of educational resources that helped in understanding technical analysis principles

Jimb0ws Strategy Trending Info PanelsJimb0ws Strategy — Golden Candles + Bubble Zones
A price-action/EMA strategy built for FX scalping and intraday swings. It colors Golden Candles when strong bodies touch/skim EMA20/50 in trend (“bubble”) and optionally highlights Robin Candles (break of the prior golden body). Signals are throttled per bubble and filtered by multiple higher-timeframe conditions.
How it trades
Trend bubbles: Uses EMA20/50/100/200 alignment on the chart timeframe; also reads 1H & 4H bubbles for context.
Entries: BUY/SELL labels appear only when a golden setup aligns with fractal/structure checks and all active filters pass.
Stops/Targets (strategy mode):
• Longs: SL = EMA100 if EMA200 > EMA100, else SL = EMA200.
• Shorts: SL = EMA100 if EMA200 < EMA100, else SL = EMA200.
• TP = RR × risk (default 2R).
An on-chart SL/TP info label prints the exact prices at each signal.
Risk filter options: disable beyond 1H EMA50, proximity band around 1H EMA50, wick overdrive veto, session filter (toggle on/off), max signals per bubble.
Visuals & tools
Colored EMAs (20/50/100/200), bubble zone background.
4H info panel (state, start time, duration); Prev-Day ATR panel sits above it.
Optional 1H info panel and consolidation warning.
Fractal markers (size selectable).
Alerts
1H bubble state change (Long/Short/Consolidation).
BUY/SELL signals.
Inputs worth checking
Session & timezone, min body size, pip tolerances, proximity/WOD filters, max signals per bubble, RR, SL/TP label offset.
Notes
Best on FX pairs; pip = mintick × 10. Backtest and adjust to your instrument and session. This is not financial advice.

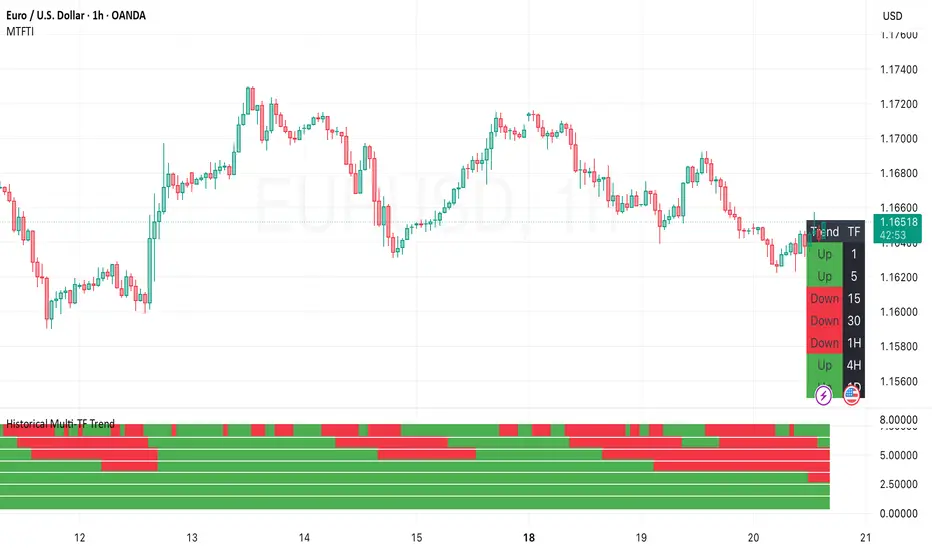
Historical MTFT Trend Multi-timeframe indicatorShows historical trend on multiple timeframes 1m, 5m, 15m, 1h, 4h, 1d. Allows to go back and see the trend.
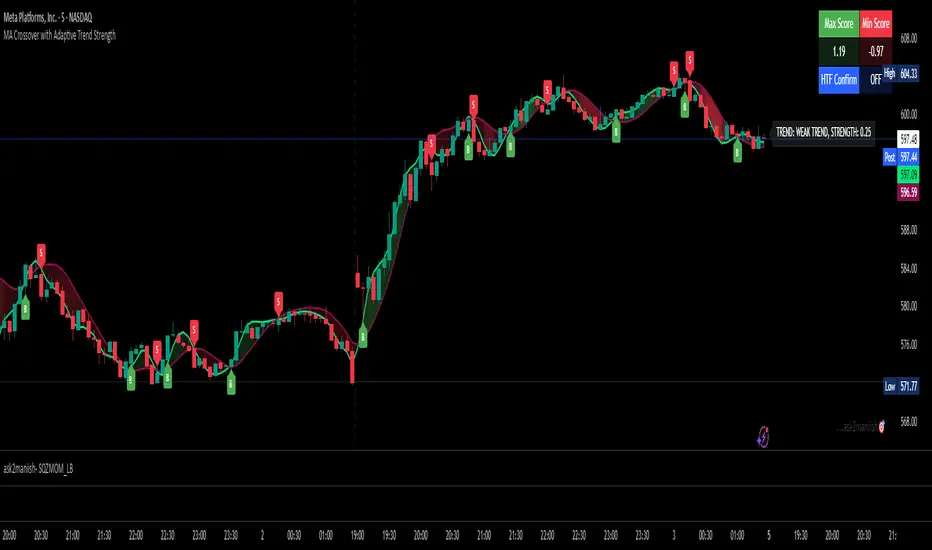
MA Crossover with Adaptive Trend Strength📘 MA Crossover with Adaptive Trend Strength —
📌 Overview
This TradingView indicator plots two moving averages (Fast & Slow) with user-selected types (T3, EMA, SMA, HMA), visual crossovers, and dynamically calculates an adaptive trend strength score using Z-scores of multiple features. Optional higher timeframe (HTF) confirmation is supported. A color-filled region between the MAs visually indicates momentum direction.
⚙️ Inputs & Controls
📈 Moving Average Settings
Fast MA Length: Length of the fast-moving average (default: 9).
Slow MA Length: Length of the slow-moving average (default: 21).
MA Type: Type of moving average used (T3, EMA, SMA, HMA).
Source: Input data source (default: close).
T3 Volume Factor: Only used when T3 is selected, controls smoothing (range: 0–1).
🎨 Visual Controls
Bullish Fill Color: Fill color when Fast MA is above Slow MA.
Bearish Fill Color: Fill color when Fast MA is below Slow MA.
Show Gradient Fill: Enable or disable the colored area between Fast & Slow MAs.
Trend Label Position: Choose where the trend strength label appears (top or bottom).
Label Update Interval: Number of bars between label updates (reduces clutter).
⏱ Multi-Timeframe Support
Higher Timeframe: Timeframe used for confirmation (default: 60 min).
Use HTF Confirmation: Enables filtering of trend score by higher timeframe trend direction.
📊 Lookback Configuration
Auto Lookback Based on Timeframe: Dynamically adapts scoring lookback period per chart timeframe.
Manual Lookback: Manual fallback lookback length when auto is off.
🧮 MA Calculation Options
T3 MA: Custom T3 function with exponential moving averages and volume factor.
EMA/SMA: Built-in Pine functions (ta.ema, ta.sma).
HMA: Hull Moving Average using WMA calculations.
📉 Trend Strength Calculation
🧠 Z-Score Inputs
Distance between MAs (zDist)
Slope of the Fast MA (zSlope)
Volume (zVol)
ATR (zATR)
📏 Choppiness & Adaptive Weighting
A Choppiness Index (based on ATR & price range) reduces score impact in sideways markets.
Dynamically adjusts Z-score weights:
W1: Distance
W2: Slope
W3: Volume
W4: ATR
🔁 HTF Confirmation
Optionally multiplies the trend score by the direction of the higher timeframe trend to filter noise.
🟩 Plot & Visual Elements
📊 MA Lines
Plots Fast and Slow MA lines in colors based on selected MA type.
🌈 Gradient Fill
Fills the area between Fast and Slow MAs with opacity proportional to their difference.
Colors based on bullish/bearish condition.
🏷️ Trend Strength Label
Updates every n bars (Label Update Interval).
Shows:
Trend Classification: Weak, Moderate, Strong
Numerical Score
Label position (top or bottom) is configurable.
🔔 Crossover Signals
Bullish Crossover ("B"): Fast MA crosses above Slow MA.
Bearish Crossover ("S"): Fast MA crosses below Slow MA.
Labels are plotted at crossover points.
Old labels are removed after a threshold (100) to reduce chart clutter.
📋 Score Summary Table
A table showing:
Max Score within the lookback period
Min Score
HTF Confirmation Status (ON / OFF)
Updates on the same user-defined interval as the trend label.
🚨 Alerts
Condition Description
Bullish MA Cross Fast MA crosses above Slow MA
Bearish MA Cross Fast MA crosses below Slow MA
These are provided via alertcondition() for use in alert creation.
📌 Customization Tips
Turn off the gradient fill for a cleaner chart.
Use HTF confirmation to reduce false positives in ranging markets.
Adjust label update frequency to prevent visual clutter on faster timeframes.
Use T3 MA with volume factor for smoother signals in volatile markets.
Buy/Sell EMA Trend Filter v6Buy/Sell EMA Trend Filter v6
This indicator provides a comprehensive trading system based on EMA crossovers with trend filtering for TradingView. It's designed to identify high-probability buy and sell signals by combining short-term crossovers with longer-term trend direction confirmation.
Key Features:
EMA Crossover System: Uses fast and slow EMAs (9 and 21 by default) to generate initial signals
Trend Filtering: Confirms signals with longer-term trend direction (50 and 200 EMAs)
Automatic TP/SL Calculation: Displays clear take profit and stop loss levels based on fixed risk points
Visual Alerts: Clear buy/sell markers at the point of signal with detailed labels
Risk Management: Pre-calculated risk-to-reward setup (default 1:2 ratio)
How It Works:
Buy Signal: When the fast EMA crosses above the slow EMA while the 50 EMA is above the 200 EMA (bullish trend)
Sell Signal: When the fast EMA crosses below the slow EMA while the 50 EMA is below the 200 EMA (bearish trend)
Customizable Parameters:
Fast EMA period (default: 9)
Slow EMA period (default: 21)
Trend EMA periods (default: 50 and 200)
Fixed risk in points (default: 20)
Reward ratio (default: 2.0)
The indicator displays clear entry points with predefined stop loss and take profit levels, making it ideal for traders looking for a systematic approach to the markets. Perfect for both day trading and swing trading timeframes.
This tool combines both trend following and momentum principles to filter out low-probability trades and focus on high-quality setups where the trend and momentum align.

Donchian Channel Trend Tracker by KellyLikesCrypto### Overview
This indicator is written in Pine Script® (version 6) and is designed to overlay on a price chart. It combines the classic Donchian Channel—a tool popular among trend-following traders—with additional trend-tracking features. By identifying when the channel’s highs and lows are making new extreme values, the indicator helps signal potential trend shifts. It is especially suited for scalpers using 1-hour charts, as it provides clear, actionable signals for rapid entry and exit decisions.
---
### Key Components & Inputs
1. **User Inputs:**
- **Length:** The period over which the indicator calculates the highest high and the lowest low (default is 27 bars). This value can be adjusted to smooth or tighten the channel based on the trader’s preference.
- **Offset:** A parameter allowing the plotted lines to be shifted left or right on the chart, providing flexibility in aligning the indicator with price action.
2. **Donchian Channel Calculations:**
- **Lower Bound (`lower`):** Calculated using `ta.lowest(length)`, it identifies the lowest low over the defined period.
- **Upper Bound (`upper`):** Determined by `ta.highest(length)`, capturing the highest high during the same period.
- **Basis:** The midline of the channel, computed as the average of the upper and lower bounds. This line can serve as an equilibrium or reference point in the trend analysis.
---
### Visual Representation
- **Plotting the Channels:**
- The **basis** is plotted in a standout orange color (#FF6D00) to make the central trend reference easily visible.
- The **upper** and **lower** bounds are plotted in blue (#2962FF), creating clear boundaries for the price action.
- The area between these two lines is filled with a semi-transparent blue, enhancing the visual context of the channel and helping traders quickly assess whether price is near an extreme or within a normal range.
---
### Trend Identification Logic
Beyond plotting the basic Donchian Channel, the indicator introduces additional logic to track short-term trend changes:
1. **Higher Highs and Higher Lows:**
- **Higher High (`higherHigh`):** This condition checks if the current upper bound is greater than the previous bar’s upper bound, signaling a potential upward push.
- **Higher Low (`higherLow`):** Similarly, it checks if the current lower bound exceeds the previous bar’s lower bound, reinforcing an upward trend if the support level is rising.
2. **Lower Highs and Lower Lows:**
- **Lower High (`lowerHigh`):** This evaluates if the current upper bound is less than that of the previous bar, indicating a possible downward shift.
- **Lower Low (`lowerLow`):** It verifies if the current lower bound is lower than the previous bar’s, further confirming a bearish tendency.
The use of the `nz()` function ensures that on the very first bar—where no previous data exists—the code handles the values gracefully without causing errors.
---
### Visual Markers for Trend Signals
To make trend signals immediately apparent:
- **Markers are Plotted on the Chart:**
- **Green Labels ("HH" and "HL"):** These are placed on the chart when the indicator detects higher highs or higher lows, suggesting bullish momentum.
- **Red Labels ("LH" and "LL"):** These markers are shown when lower highs or lower lows are detected, indicating bearish pressure.
Each label is plotted either above or below the corresponding bar, ensuring that the chart remains uncluttered and that the trend signals are clear.
---
### Scalping Strategy on 1-Hour Charts
This indicator is specifically tailored for scalping strategies on 1-hour charts. Scalping involves capturing small, rapid profits from short-term price movements, and the clear trend signals provided by this tool can help traders pinpoint optimal entry and exit points. Here’s how it integrates into a scalping strategy:
- **Quick Trend Identification:** The green markers (HH and HL) suggest bullish conditions ideal for quick long entries, while the red markers (LH and LL) signal bearish conditions suitable for short entries.
- **Timing and Precision:** On a 1-hour chart, the indicator’s sensitivity to higher highs and lower lows allows traders to make rapid decisions aligned with the prevailing trend.
- **Complementary Analysis:** While the indicator provides fast signals, it is recommended to use it alongside additional tools (like oscillators or volume analysis) and strict risk management practices, ensuring that scalpers can confirm entries and exits efficiently.
By leveraging the indicator’s visual cues within a broader scalping framework, traders can enhance their ability to capture quick moves, thus optimizing their overall strategy on 1-hour timeframes.
---
### Conclusion
The “Donchian Channel Trend Tracker by KellyLikesCrypto” is a powerful tool for visualizing price extremes and trend direction. By combining the classical Donchian Channel with additional trend-tracking markers, it offers traders a clear and immediate way to assess whether the market is gaining bullish momentum or beginning to turn bearish. Its customizable parameters and clear visual signals make it particularly effective for a scalping strategy on 1-hour charts, where rapid decision-making is crucial.
This detailed breakdown should provide a comprehensive understanding of how each component of the indicator works together and how it can be effectively integrated into a short-term scalping strategy.

ADX Green Trend, Red ChopBased on the ADX indicator. This uses the calculated slope of the ADX line to show if momentum is increasing or decreasing. Green means the slope of the ADX is positive and the trend in increasing. Red means the ADX slope is positive and momentum is decreasing.Gray or Yellow is aneutral transitional zone

Optimized Auto-Detect Strategy (MA, ATR, Trend, RSI) Overview
This script is designed for traders seeking a trend-following approach that adapts to different currency pairs (e.g., EURUSD, NZDUSD, XAUUSD). It combines moving average crossovers with ATR-based stops, optional trend filters, and RSI filters to help reduce false signals and capture larger moves.
Key Features
1. Auto-Detect Logic
- Automatically applies different moving average periods and ATR multipliers based on the symbol (e.g., XAUUSD, EURUSD, NZDUSD).
- Makes it easy to switch charts without manually adjusting parameters each time.
2. ATR-Based Stop
- Uses the Average True Range (ATR) to set dynamic stop-loss levels, adapting to each market’s volatility.
3. Optional Trend Filter
- Filters out trades if price is below the 200 SMA for longs (and above for shorts), aiming to avoid choppy, range-bound markets.
4. Optional RSI Filter
- Only enters long if RSI is above a certain threshold (e.g., 50), or short if below another threshold, reducing entries during low momentum.
5. Partial Exit & Trailing/Break-Even
- Locks in partial profit at a chosen R:R (e.g., 1:1), then either trails the remaining position or moves the stop to break-even.
- This helps capture additional gains if the trend extends beyond the initial target.
6. Customizable Parameters
- You can toggle on/off each filter (Trend, RSI) and adjust the ATR multiplier, MA periods, partial exit levels, etc.
- Allows easy optimization for different pairs or timeframes.
How to Use
1. Add to Chart: Click “Add to chart” in the Pine Editor.
2. Configure Inputs: In the script’s settings, toggle the filters you want (Trend Filter, RSI Filter, etc.) and set your desired ATR multiplier, RSI thresholds, partial exit ratio, etc.
3. Strategy Tester: Check the performance under the “Strategy Tester” tab. Adjust parameters if needed.
4. Realistic Settings: Consider adding spreads/commissions in the “Properties” tab for more accurate backtests, especially if you trade pairs with higher spreads (like XAUUSD).
Disclaimer
No Guarantee: This script does not guarantee profits. Markets are unpredictable, and results may vary with market conditions.
For Educational Purposes: Always do your own research and forward testing. Past performance does not indicate future results.

[MAD] Weighted Trend Detector--> Purpose
The Weighted Trend Detector evaluates market direction by combining multiple technical indicators (RSI, MACD, Moving Averages, ADX, and Volume) across up to three different timeframes.
It calculates an overall trend score to help visualize whether conditions are bullish, bearish, or neutral.
--> Scaling & Weightings
Each component indicator contributes a score between -1.0 and +1.0. User-defined weights (e.g., 0.2 for RSI, 0.3 for MACD) determine how much each indicator influences the final score. An adaptive scaling mechanism ensures extreme values remain in view by dynamically setting the minimum and maximum of the score range over a specified lookback period.
--> Basic Parameters of Individual Indicators
RSI Period: Number of bars for the Relative Strength Index calculation; higher values smooth out noise but may lag.
MACD Fast/Slow/Signal: EMA-based periods to identify momentum shifts. A shorter “Fast” length reacts quickly, while a longer “Slow” length is smoother.
Moving Averages (Short & Long Lengths): Simple Moving Averages used to gauge shorter- vs. longer-term price direction.
ADX Length: Defines how many bars are considered when measuring trend strength. Higher values produce smoother ADX lines.
Volume MA Length: Period over which the average volume is calculated to compare against current volume.
--> Colors & How They Are Mixed
The background color scales from a negative color (for lower scores) to a positive color (for higher scores).
Near the highest or lowest parts of the score range, additional blending occurs if the slope (change in score) reverses:
Turning Down: Mixes with a user-chosen “warning” color if the score is high but moving lower.
Turning Up: Mixes with a user-chosen “recovery” color if the score is low but moving higher.
All colors (including line and label text) can be adjusted in the script’s inputs to suit personal preferences.colors are customizable via inputs.
Have fun :-)

Channel Trend and 3 EMA Stratgy MHG-V.6.1.4Dear Traders..
This Startgy use the 3 tools
1- Trend Detection
2- draw the Ascending and Descending channels
3- Use the 3 Moving average for take the acceptant for position entry.
If ascending channel and make the buy signal, then watch the EMA 2 if the price above the 2 EMA you can open the Long position.
SL alittle under the 2 EMA Curve.
for short position riverce the above manual...

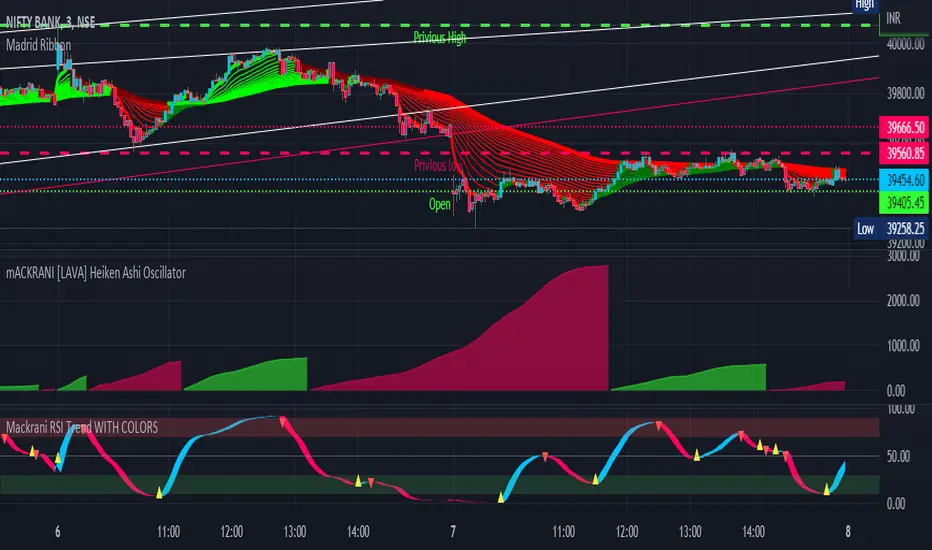
Mackrani RSI Trend WITH COLORSMACKRANI RSI WITH COLORS
Hull Trend is a hybrid indicator with RSI of HULL Signal. The Hull MA is combined with RSI to see if the Hull MA Buy/Sell Signal is in overbought or oversold condition. Buy Sell Signals are plotted based on settings of OB/OS or RSI .
This indicator is very useful to see if the Trend is in Exhaustion or Beginning of a Trend. Entry and Exit conditions can be more precise based on OB/OS condition of price action. In addition normal RSI trend is plotted with trend color from Hull MA. Best Performance with Heiken Ashi Candle
:- OB/OS Settings provided
:- Hull Buy/Sell Signals plotted
:- Double RSI FAST and DEFAULT signal with crossover
:- Bar Color applied based on Hull RSI Trend
:- Hull Trend + RSI + Price Action
Too Many Cooks trend indicatorToo many Cooks in The Kitchen
You have probably heard the adage "Too many cooks spoils the broth" before. The meaning behind it is obviously that when to many people are trying to work on the same task at once it simply devolves into a fight for control and creates a mess of the situation. But is this true for indicators is the question I had and thus I made this indicator, a simple combination of 8 random trend finding indicators I assembled (A list of these indicators and their authors will be available at the bottom of this page) . Is it any good though ? In short yes, it is a decent trend finding indicator and could likely be used in your strategy in the place of your current trend finding indicator if you so wish. However much of the versatility of the individual indicators IS lost and would not be possible to get back in this big mess of a broth, so this indicator will not be the be all end all of trend indicators nor will it be a free money machine like you may be expecting looking at the list of included indicators so the adage was correct to a degree.
List of Authors and their included indicators
Trading View defaults:
MACD (Modified by me)
Stochastic RSI (Modified by me)
Lazy Bear:
Wavetrend Oscilator (Modified by me)
Traders Dynamic Index (Modified by me)
HACOLT (Modified by me)
Algokid
AK Trend
Racer8
Average Force
KivancOzbilgic
Average Sentiment Osclilator
[JL] Trend or RangeJust want to make an easy indicator to show trend or range.
ToR idea is based on the simple concept:
Range will have more cross than trend
So I calculate difference of two moving average
Then divide ATR to get how many virtual bars in the difference
Calculate sum of virtual bars during the period.
So more virtual bars, more chance to be trend.
will make a table to compare many pairs on one chart.

FX TrendFX Trend Indicator by request of S.C. in The Trading Journal Discord.
Original Meta Trader Indicator at www.mql5.com
FXT = K * ((Close-L1) / (D1*Small range)+(Close-L2) / (D2*Middle range)+(Close-L3) / (D3*Big range))
Where:
D1 = H1 - L1
D2 = H2 - L2
D3 = H3 - L3
L1, H1 - the lowest and the highest prices in the Small range
L2, H2 - the lowest and the highest prices in the Middle range
L3, H3 - the lowest and the highest prices in the Big range
K = 100.0 / (1/Small range+1 / Middle range+1 / Big range)
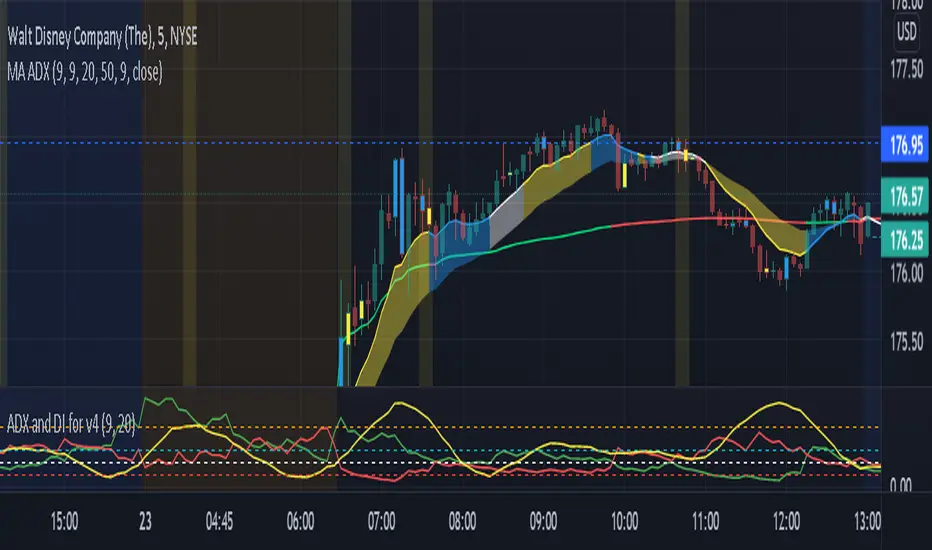
ADX and DI EMA Trend LineADX: The average directional index (ADX) is a technical analysis indicator used by some traders to determine the strength of a trend.
DI: The directional movement index (DMI) is an indicator developed by J. Welles Wilder in 1978 that identifies in which direction the price of an asset is moving. ... Conversely, if -DI is above +DI, then there is more downward pressure on the price. This indicator may help traders assess the trend direction.
EMA: The exponential moving average (EMA) is a technical chart indicator that tracks the price of an investment (like a stock or commodity) over time. The EMA is a type of weighted moving average (WMA) that gives more weighting or importance to recent price data.
UPDATE: This current indicator has been changed from MA and EMA trend lines the 9 and the 50, and also added Inside & Outside bars...You can toggle anything Off or On
The code in this indicator calculates the value of each ADX and DI (+/-) value to give a green color for DI + trend and a red color for DI - trend, and lastly white for no direction...The nice part of this code is the 50 EMA will be your bull or bear transition level. The colors heading to the ema will tell you if we are still bull or bear heading to the EMA.
I also changed the ADX to become the 9 EMA with Yellow showing a ADX positive rate of change, Blue showing a negative rate of change, and white to show that the trend has no direction.
Open settings to adjust how big or small you want the ema lines to be and adjust colors for what works for you. Hopefully you enjoy this update
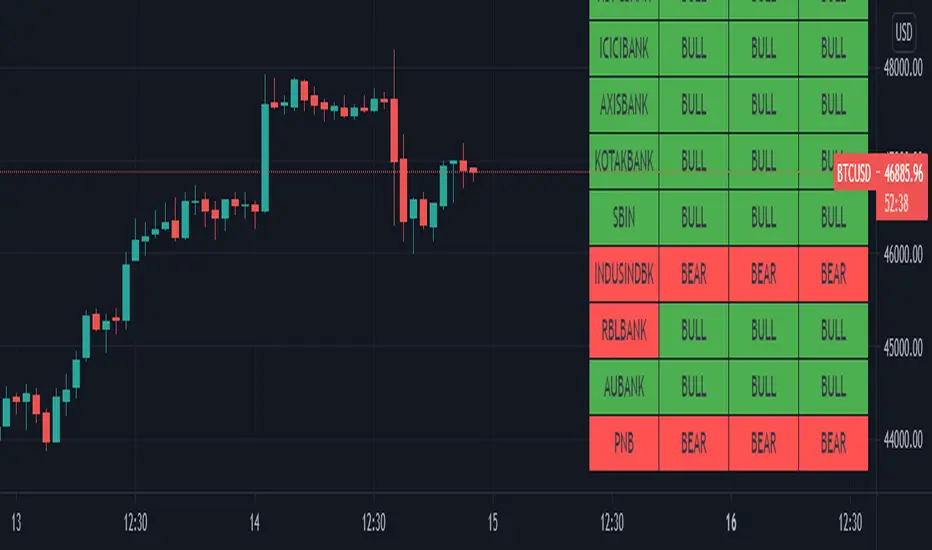
BANK NIFTY list of stocks with their multi timeframe EMA trend This script gives you an overview of banknifty and its underlying heavy weight stocks.
You can view the trend in single chart in 3 different time frames.
Color indication green for bullish and red for bearish trend
Symbol name shows green if the current day change is positive. Else red color
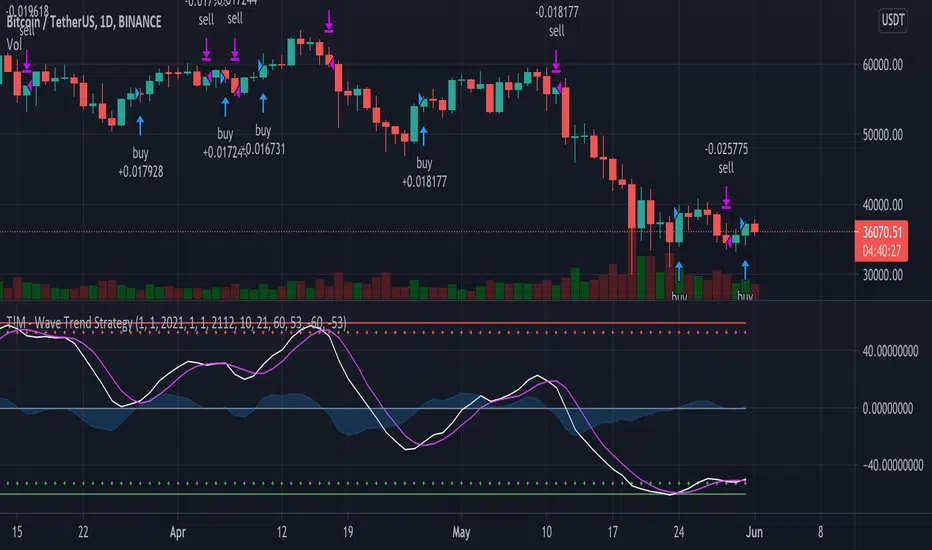
T!M - Wave Trend Strategy with DatesUsing Lazy Bear's original Wave Trend script but I added dates to it to make it easier to backtest.