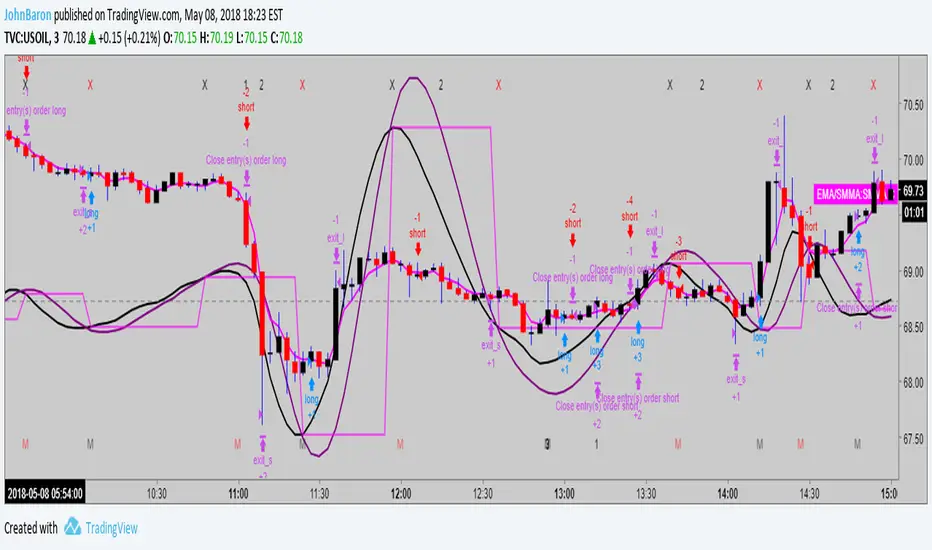
LazyBear's Wave Trend Strategy by SDMFHello.
This is a strategy using the Lazy Bears Wave Trend indicator which he was so nice to release for free.
I heavily modified it and added a huge amount of options for the indicator as well as for the strategy.
Unfortunately it's locked with a passcode for now so my friends can use it
The results above are nit picked for oil 15 minute chart.
using 40% of our equity per trade on 50x leverage.
these are not 100% realistic altho shouldn't be too far from the truth.
Have not tried it on crypto.
Script is in Beta version and will get upgraded plenty in the near future.
Cerca negli script per "trend"


Trend-Following Trade SignalsThis is a script that gives entries and exits for bitcoin, ran on 15 minute timeframe, backtested for position sizes of 1x initial capital. This script is not available to the public. Feel free to message me with inquires.

Power Penguin - Trend Trading Script BacktesterPower Penguin is a script that detects a trend and determines entry into the market based on the strength and price action.
Thanks to all my early backers for believing in my work!
This script is optimal for use in any market at this time.
To request a trial for this script, please PM me.
-----------------
Power Penguin V1.0.0
- Initial release

Trend Hunter [BETA]This is in BETA now. Im reaching out to coders for some assistance on my "take profit" targets. As you can see, these are obviously plotshapes, How would I go about setting take profits for backtesting purposes? Thanks in advance

Marker bullish trending momentum swing trade strategyLooking for bullish trending upward momentum, then selling at the top. Stop losses and max drawdown configurable based risk profile and stock/ETF. Please follow me if you like this signal strategy.

Cyatophilum Trend Indicator [BACKTEST][STRATEGY]HOW IT WORKS
Based on my Cyatophilum Trend Indicator, this Strategy performs simple Buy and Sell orders when an alert from the Indicator triggers. The goal is to find the best Time Frame and Trend Parameter in order to make the most profit. The indicator turns the candles green for a Long trade/Buy and red for a Short trade/Sell.
ABOUT THE STRATEGY
The Net Profit (Gross profit - Gross loss) is calculated with a commission of 0.05% on each order.
Each trade is made with 1 BTC : The backtest buys 1 BTC and sells 1 BTC.
It clearly outperforms the Buy & Hold line, meaning it is more profitable to use this strategy than to just hold Bitcoin.
If you decided to Short or Long, profits can be higher, but trade at your own risk.
To use this strategy on a BTC market (for trading altcoins), change the default Order Size from 1 Contract to 100% of Equity.
MY PERSONNAL ADVICE
This is a Trend Indicator, meaning the least profitable trades are made during flat markets. Keep an eye on News and Volume to indentify a possible breakout and avoid trades during those flat periods. Do not trade during a Triangle since the commissions will rekt you.
Get This Indicator Today!
Purchase at blockchainfiesta.com
NOTE
If you purchase the Indicator you will get both the Alert Setup and the Backtest Strategy.
Find, discuss and request more backtesting on my discord!
discord.gg

Wave & Trend Accompanying Backtesting StrategyVersion 1.0
Purpose
This backtesting strategy indicator is a accompanying tool for use with my popular trading and alert indicator: Wave & Trend Autoview Advanced Indicator & Alerts
Reference Indicator Link:
Features
This strategy has been programmed to act exactly how the accompanying indicator would be used with an automated strategy such as Autoview or through manual trading
Has identical coloured signals with correct icons for reference with the indicators standard alert conditions (BUY/SELL)
The ability to toggle on or off all the logic and UI presets you could previously use to enhance the standard indicator
No short / longs for the most accurate representation of buys and sells, The strategy will keep buying on every optimal signal (+1 order quantity each time) and then sell all assets on a met sell condition (-all quantity), matching exactly how the reference indicator is used to buy/sell on eg. Binance and also give the most accurate statistics.
Fully customisable in the settings regarding trading strategy to match exactly how you have the reference indicator set up with alerts or how you are trading manually with it.
Ability to choose a timeframe, want to ignore the crypto boom at the latter stages of 2017? Sure you can, change the time frames in the settings to see a more recent representation of your trades.
Access
This indicator is free for existing owners of my Wave & Trend Indicator linked above as an accompanying tool to improve their strategy and net more profit. If you would like access to any of my indicators or would like to know more please find me on my community discord channel where you can find indicator details/documentation and general help:
Discord Link: discord.gg
Thank you for the immense support everyone, happy trading!
- Falco

Volume Trend Following V0.1Simple test of volume based trend following strategy
Version: 0.1
Monthly profit: ~20%
Commission not considered
-----------------------------------------------------------
Support is welcomed:
BTC Donation: 15VfVrpK7WFfqHVqudiv1ygRqCZyeSEs5D


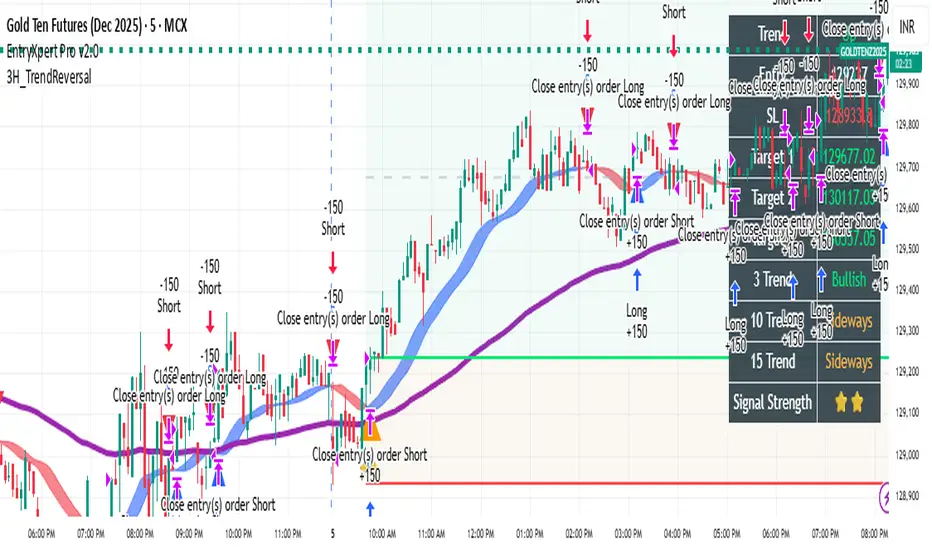
TrendReversalStrategy Description
This is a noise-filtered, intraday reversal strategy that uses advanced Hull Moving Average (HULL) crossovers to generate fast and reliable trade signals with minimal false breakouts.
Key Features:
Core Logic: The strategy employs a Hull Moving Average (HULL) calculated using three selectable MA modes—HMA, EHMA, or THMA. It generates buy signals when the signal line (SHULL) crosses below the main HULL line, and sell signals when SHULL crosses above HULL. This crossover approach identifies momentum reversals with reduced repainting.
Noise Filtering: Built-in cooldown mechanism prevents consecutive same-side signals, reducing whipsaws. Users can adjust the minimum bars between same-side signals (default: 2 bars) to customize signal frequency and filter noise.
Trend Filter (Optional): An optional EMA(100) trend filter allows traders to only take long trades above the 100-period EMA and short trades below it, adding directional bias and improving win rate on trending days.
Customizable Inputs:
MA Mode: Choose between HMA, EHMA, or THMA
Length: Default 16 (adjustable 1+)
Length Multiplier: Fine-tune HULL sensitivity
Cooldown Bars: Control signal frequency (1–50 bars)
Band Visualization: Toggle HULL band display for visual support/resistance
Trend Filter: Optional EMA(100) directional bias
Position Management: Reversal-style entries close opposing positions before entering new trades. Position sizing defaults to 10% of equity per trade (adjustable).
Ideal For: Intraday traders, scalpers, and swing traders seeking a clean, signal-based system with minimal false entries on volatile instruments.
Note: This strategy performs best on high-volatility assets and intraday timeframes (5m–60m). Backtest and paper trade before live deployment.
Multi-EMA Crossover StrategyMulti-EMA Crossover Strategy
This strategy uses multiple exponential moving average (EMA) crossovers to identify bullish trends and execute long trades. The approach involves progressively stronger signals as different EMA pairs cross, indicating increasing bullish momentum. Each crossover triggers a long entry, and the intensity of bullish sentiment is reflected in the color of the bars on the chart. Conversely, bearish trends are represented by red bars.
Strategy Logic:
First Long Entry: When the 1-day EMA crosses above the 5-day EMA, it signals initial bullish momentum.
Second Long Entry: When the 3-day EMA crosses above the 10-day EMA, it confirms stronger bullish sentiment.
Third Long Entry: When the 5-day EMA crosses above the 20-day EMA, it indicates further trend strength.
Fourth Long Entry: When the 10-day EMA crosses above the 40-day EMA, it suggests robust long-term bullish momentum.
The bar colors reflect these conditions:
More blue bars indicate stronger bullish sentiment as more short-term EMAs are above their longer-term counterparts.
Red bars represent bearish conditions when short-term EMAs are below longer-term ones.
Example: Bitcoin Trading on a Daily Timeframe
Bullish Scenario:
Imagine Bitcoin is trading at $30,000 on March 31, 2025:
First Signal: The 1-day EMA crosses above the 5-day EMA at $30,000. This suggests initial upward momentum, prompting a small long entry.
Second Signal: A few days later, the 3-day EMA crosses above the 10-day EMA at $31,000. This confirms strengthening bullish sentiment; another long position is added.
Third Signal: The 5-day EMA crosses above the 20-day EMA at $32,500, indicating further upward trend development; a third long entry is executed.
Fourth Signal: Finally, the 10-day EMA crosses above the 40-day EMA at $34,000. This signals robust long-term bullish momentum; a fourth long position is entered.
Bearish Scenario:
Suppose Bitcoin reverses from $34,000 to $28,000:
The 1-day EMA crosses below the 5-day EMA at $33,500.
The 3-day EMA dips below the 10-day EMA at $32,000.
The 5-day EMA falls below the 20-day EMA at $30,000.
The final bearish signal occurs when the 10-day EMA drops below the 40-day EMA at $28,000.
The bars turn increasingly red as bearish conditions strengthen.
Advantages of This Strategy:
Progressive Confirmation: Multiple crossovers provide layered confirmation of trend strength.
Visual Feedback: Bar colors help traders quickly assess market sentiment and adjust positions accordingly.
Flexibility: Suitable for trending markets like Bitcoin during strong rallies or downturns.
Limitations:
Lagging Signals: EMAs are lagging indicators and may react slowly to sudden price changes.
False Breakouts: Crossovers in choppy markets can lead to whipsaws or false signals.
This strategy works best in trending markets and should be combined with additional risk management techniques, e.g., stop loss or optimal position sizes (Kelly Criterion).

Vortex Sniper XVortex Sniper X – Trend-Following Strategy
🔹 Purpose
Vortex Sniper X is a trend-following strategy designed to identify strong market trends and enter trades in the direction of momentum. By combining multiple technical indicators, this strategy helps traders filter out false signals and only take trades with high confidence.
🔹 Indicator Breakdown
1️⃣ Vortex Indicator (Trend Direction & Strength)
Identifies the trend direction based on the relationship between VI+ and VI-.
Bullish Signal: VI+ crosses above VI-.
Bearish Signal: VI- crosses above VI+.
The wider the gap between VI+ and VI-, the stronger the trend’s momentum.
2️⃣ Relative Momentum Index (RMI – Momentum Confirmation)
Confirms whether price momentum supports the trend direction.
Long confirmation: RMI is rising and above the threshold.
Short confirmation: RMI is falling and below the threshold.
Filters out weak trends that lack sufficient momentum.
3️⃣ McGinley Dynamic (Trend Baseline Filter)
A dynamic moving average that adjusts to market volatility for smoother trend identification.
Long trades only if price is above the McGinley Dynamic.
Short trades only if price is below the McGinley Dynamic.
Prevents trading in choppy or sideways markets.
🔹 Strategy Logic & Trade Execution
✅ Entry Conditions
A trade is executed only when all three indicators confirm alignment:
Trend Confirmation: McGinley Dynamic defines the trend direction.
Vortex Signal: VI+ > VI- (bullish) or VI- > VI+ (bearish).
Momentum Confirmation: RMI must agree with the trend direction.
✅ Exit Conditions
Trend Reversal: If the opposite trade condition is met, the current position is closed.
Trend Weakness: If the trend weakens (detected via trend shifts), the position is exited.
🔹 Take-Profit System
The strategy follows a multi-stage profit-taking approach to secure gains:
Take Profit 1 (TP1): 50% of the position is closed at the first target.
Take Profit 2 (TP2): The remaining 50% is closed at the second target.
🔹 Risk Management (Important Notice)
🔴 This strategy does NOT include a stop-loss by default.
Trades rely on trend reversals or early exits to close positions.
Users should manually configure a stop-loss if risk management is required.
💡 Suggested risk management options:
Set a stop-loss at a recent swing high/low or an important support/resistance level.
Adjust position sizing according to personal risk tolerance.
🔹 Default Backtest Settings
To ensure realistic backtesting, the following settings are used:
Initial Capital: $1,000
Position Sizing: 10% of equity per trade
Commission: 0.05%
Slippage: 1 pip
Date Range: Can be adjusted for different market conditions
🔹 How to Use This Strategy
📌 To get the best results, follow these steps:
Apply the strategy to any TradingView chart.
Backtest before using it in live conditions.
Adjust the indicator settings as needed.
Set a manual stop-loss if required for your trading style.
Use this strategy in trending markets—avoid sideways conditions.
⚠️ Disclaimer
🚨 Trading involves risk. This strategy is for educational purposes only and should not be considered financial advice.
Past performance does not guarantee future results.
Users are responsible for managing their own risk.
Always backtest strategies before applying them in live trading.
🚀 Final Notes
Vortex Sniper X provides a structured approach to trend-following trading, ensuring:
✔ Multi-indicator confirmation for higher accuracy.
✔ Momentum-backed entries to avoid weak trends.
✔ Take-profit targets to secure gains.
✔ No repainting—historical performance aligns with live execution.
This strategy does not include a stop-loss, so users must apply their own risk management methods.

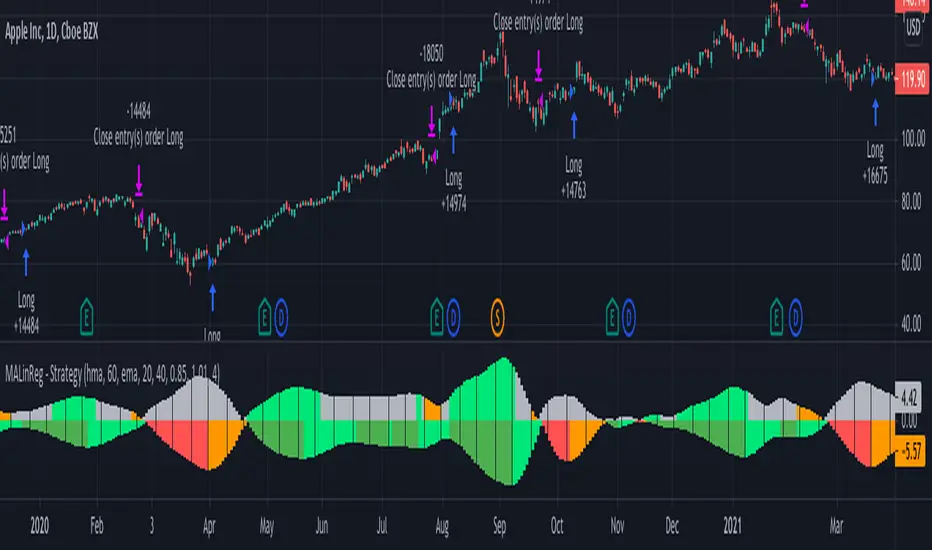
MACandles-LinearRegression-StrategyThis is combination of multiple indicators and strategies. Mainly useful for indexes and to time the entry and exits of indexes. No stoploss used - makes it less desirable for leveraged trades or trading individual stocks.
Let us rewind and look back at some of the indicators/strategies published earlier.
1. Moving Average Candles - this is one of my favourite tool for general trend filtering. Applying supertrend on moving average candles is one of the easiest ways to find reversal in trending market without exiting positions too early. Few scripts published on this basis are:
MA Candles Supertrend
MA Candles Supertrend Strategy
2. VixFix and Linear Regression - this itself is combination of two indicators.
Williams-Vix-Fix-Finds-Market-Bottoms - by @ChrisMoody
Squeeze-Momentum-Indicator - by @LazyBear
I have combined these two indicators to derive VIX-Fix linear regression to find absolute market bottoms. More description here:
VixFixLinReg-Strategy
VixFixLinReg-Indicator
Now, in this strategy, we combine all these together.
Derive moving average candles
Derive momentum of moving average candles
Derive Linear regression on momentum
Optionally, also calculate VIX Fix and Linear regression on VixFix momentum
To find market bottom:
There are two options
1. Use when momentum of MA candles hit bottom (red) and slowly turn up (orange). In aggressiveLong mode, signals are also generated when momentum starts going positive from negative.
2. Use Vix Fix linear regression of MA candles as described in the original script of VixFixLinReg-Strategy
To find market top
Here only Ma candles momentum decreasing is used as signal. If looking for longTrades , exit signal is generated only when momentum is turning negative extreme(orange). Or else, exit signal is generated when momentum has turned neutral.
At this stage, it is very much experimental - use it with caution :)
Multiband - Market TimerThis strategy is made for market timing in the bull markets. Hence, more ideal to use it with index ETFs or high conviction large caps.
This makes use of different custom indicators:
Multi Band Channel - Overbought/Oversold Oscillator
VixFix Linear regression
Regular Linear Regression.
Multi Band Oscillator is used for identifying overbought/oversold state of the instrument. This is used in conjunction with VIXFix Linear Regression to to find market bottoms for entry conditions.
Few parameters are explained below:
CheckBandDistance - If checked checks for narrow bands and ignore signals when crossover happens in narrow bands.
ConsiderOversoldDaysCounter/ConsiderOverboughtDaysCounter - If checked, considers oversold and overbought crossovers only if instrument stays in oversold/overbought state for that many bars.
UseLinearRegressionToOpen/UseLinearRegressionToClose - If checked, combines linear regression along with overbought/oversold condition for entry and exits.
UseVixFixToOpen - Uses VixFixLinear regression to identify market bottom and this condition will be combined with oversold/overbought state. When using VixFixLinearRegression signal, we can allow generating entry signals during non crossover bars. Vix Fix Entry Range sets the max bar for multi band state to be for generating signal. For example, if Vix Fix Entry Range is set to oversold, signal is generated based on VixFix if price is below oversold.
ExitStrategy - This can be trailing/reversal or combined. If set to reversal, exit will happen on state moving out of oversold region. If set to Trailing, stop will be based on trailing stops. Indicator shows what is the present stop value. If set to combined, exit will happen on stages. 30% of the remaining position gets closed upon reversals. State may go into oversold and return back many times before having full exit. If this happens, each time, 30% of the position will be closed. Full position closure happens on hitting training stop.
Candles are colored based on linear regression.
Green -> positive and moving up
Lime -> Positive moving down
Orange -> Negative moving up
Red -> Negative moving down
Purple -> Possible VixFix peak - aka Market bottom
Another snapshot of the script along with Linear regression and VIXFix-LinReg indicators:
Related scripts are found here:
I have not put additional indicators to identify trend. But, can be combined with higher timeframe trend filters to generate better signals. Making this as invite only script as I find it very lucrative to time index ETFs. Please PM me if you want to try this script.

RSI-Adaptive T3 & SAR Strategy [PrimeAutomation]⯁ OVERVIEW
The RSI-Adaptive T3 and SAR Confluence Strategy combines adaptive smoothing with dynamic trend confirmation to identify precise trend reversals and continuation opportunities. It fuses the power of an RSI-based adaptive T3 moving average with the Parabolic SAR filter , aiming to trade in harmony with dominant momentum shifts while maintaining tight control through automatic stop-loss placement.
The RSI-Adaptive T3 is a precision trend-following tool built around the legendary T3 smoothing algorithm developed by Tim Tillson, designed to enhance responsiveness while reducing lag compared to traditional moving averages. Current implementation takes it a step further by dynamically adapting the smoothing length based on real-time RSI conditions — allowing the T3 to “breathe” with market volatility. This dynamic length makes the curve faster in trending moves and smoother during consolidations.
To help traders visualize volatility and directional momentum, adaptive volatility bands are plotted around the T3 line, with visual crossover markers and a dynamic info panel on the chart. It’s ideal for identifying trend shifts, spotting momentum surges, and adapting strategy execution to the pace of the market.
⯁ LOGIC
The T3 moving average length dynamically adjusts based on RSI values — when RSI is high, the smoothing period shortens to react faster; when RSI is low, the period increases for stability in slow markets.
A Parabolic SAR filter confirms directional bias, ensuring trades only occur in alignment with the broader market trend.
Long Entries: Trigger when the T3 curve crosses upward while the current price remains above the SAR — signaling bullish momentum alignment.
Short Entries: Trigger when the T3 crosses downward while the price remains below the SAR — confirming bearish trend alignment.
Stops: Dynamic stops are placed using the highest or lowest price over a set lookback period, adapting automatically to market volatility.
⯁ FEATURES
RSI-Adaptive T3 Filter: Adjusts smoothing in real time to market conditions, blending responsiveness with noise reduction.
SAR Confluence Check: Prevents counter-trend entries by confirming momentum direction via the Parabolic SAR.
Automatic Stop Placement: Uses recent highs or lows as stop-loss anchors, minimizing risk exposure.
Color-coded Visualization: The T3 line dynamically changes color based on slope direction, making momentum shifts visually intuitive.
Smoothed Trend Structure: Reduces market noise, allowing cleaner, more reliable trend recognition across different assets.
⯁ CONCLUSION
The RSI-Adaptive T3 and SAR Confluence Strategy delivers an advanced fusion of adaptive smoothing and structural confirmation. By combining RSI-driven reactivity with Parabolic SAR trend validation, this strategy offers a balanced approach to identifying sustainable momentum reversals while maintaining strong risk management through automatic stop levels. Ideal for traders who seek precision entries aligned with adaptive trend dynamics.

HermesHERMES STRATEGY - TRADINGVIEW DESCRIPTION
OVERVIEW
Hermes is an adaptive trend-following strategy that uses dual ALMA (Arnaud Legoux Moving Average) filters to identify high-quality entry and exit points. It's designed for swing and position traders who want smooth, low-lag signals with minimal whipsaws.
Unlike traditional moving averages that operate on price, Hermes analyzes price returns (percentage changes) to create signals that work consistently across any asset class and price range.
HOW IT WORKS
DUAL ALMA SYSTEM
The strategy uses two ALMA lines applied to price returns:
• Fast ALMA (Blue Line): Short-term trend signal (default: 80 periods)
• Slow ALMA (Black Line): Long-term baseline trend (default: 250 periods)
ALMA is superior to simple or exponential moving averages because it provides:
• Smoother curves with less noise
• Significantly reduced lag
• Natural resistance to outliers and flash crashes
TRADING LOGIC
BUY SIGNAL:
• Fast ALMA crosses above Slow ALMA (bullish regime)
• Price makes new N-bar high (momentum confirmation)
• Optional: Price above 200 EMA (macro trend filter)
• Optional: ALMA lines sufficiently separated (strength filter)
SELL SIGNAL:
• Fast ALMA crosses below Slow ALMA (bearish regime)
• Optional: Price makes new N-bar low (momentum confirmation)
The strategy stays in position during the entire bullish regime, allowing you to ride trends for weeks or months.
VISUAL INDICATORS
LINES:
• Blue Line: Fast ALMA (short-term signal)
• Black Line: Slow ALMA (long-term baseline)
TRADE MARKERS:
• Green Triangle Up: Buy executed
• Red Triangle Down: Sell executed
• Orange "M": Buy blocked by momentum filter
• Purple "W": Buy blocked by weak crossover strength
KEY PARAMETERS
ALMA SETTINGS:
• Short Period (default: 30) - Fast signal responsiveness
• Long Period (default: 250) - Baseline stability
• ALMA Offset (default: 0.90) - Balance between lag and smoothness
• ALMA Sigma (default: 7.5) - Gaussian curve width
ENTRY/EXIT FILTERS:
• Buy Lookback (default: 7) - Bars for momentum confirmation (required)
• Sell Lookback (default: 0) - Exit momentum bars (0 = disabled for faster exits)
• Min Crossover Strength (default: 0.0) - Required ALMA separation (0 = disabled)
• Use Macro Filter (default: true) - Only enter above 200 EMA
BEST PRACTICES
RECOMMENDED ASSETS - Works well on:
• Cryptocurrencies (Bitcoin, Ethereum, etc.)
• Major indices (S&P 500, Nasdaq)
• Large-cap stocks
• Commodities (Gold, Oil)
RECOMMENDED TIMEFRAMES:
• Daily: Primary timeframe for swing trading
• 4-Hour: More active trading (increase trade frequency)
• Weekly: Long-term position trading
PARAMETER TUNING:
• More trades: Lower Short Period (60-80)
• Fewer trades: Raise Short Period (100-120)
• Faster exits: Set Sell Lookback = 0
• Safer entries: Enable Macro Filter (Use Macro Filter = true)
STRATEGY ADVANTAGES
1. Low Lag - ALMA provides faster signals than traditional moving averages
2. Smooth Signals - Minimal whipsaws compared to crossover strategies
3. Asset Agnostic - Same parameters work across different markets
4. Trend Capture - Stays positioned during entire bullish regimes
5. Risk Management - Multiple filters prevent poor entries
6. Visual Clarity - Easy to interpret regime and filter states
WHEN TO USE HERMES
BEST FOR:
• Trending markets (crypto bull runs, equity uptrends)
• Swing trading (hold days to weeks)
• Position trading (hold weeks to months)
• Clear trend identification
• Risk-managed exposure
NOT SUITABLE FOR:
• Ranging/sideways markets
• Scalping or day trading
• High-frequency trading
• Mean reversion strategies
RISK DISCLAIMER
This indicator is for educational purposes only. Past performance does not guarantee future results. Always use proper position sizing and risk management. Test thoroughly on historical data before live trading.
CREDITS
Inspired by Giovanni Santostasi's Power Law Volatility Indicator, generalized for universal application across all assets using adaptive ALMA filtering.
Strategy by Hermes Trading Systems
QUICK START
1. Add indicator to chart
2. Use on daily timeframe for best results
3. Look for green buy signals when blue line crosses above black line
4. Exit on red sell signals when blue line crosses below black line
5. Adjust parameters based on your trading style:
• Conservative: Enable Macro Filter, increase Buy Lookback to 10
• Aggressive: Disable Macro Filter, lower Short Period to 60
• Default settings work well for most assets

Supertrend - SSL Strategy with Toggle [AlPashaTrader]📈 Overview of the Supertrend - SSL Strategy with Toggle Indicator
This strategy combines two powerful technical tools—Supertrend and SSL Channel—to deliver precise and reliable trading signals, designed for traders who value confirmation and risk management. 🎯
⚙️ How This Indicator Was Created
The strategy was meticulously crafted to harness the complementary strengths of:
Supertrend Indicator: A trend-following tool based on Average True Range (ATR) and a multiplier factor, it detects bullish or bearish trends by calculating dynamic support and resistance levels. 📊
SSL Channel: A channel indicator built using two Simple Moving Averages (SMA) of the highs and lows over a set period. It cleverly determines trend direction by comparing price action relative to these moving averages. 🔄
These two indicators are merged into one cohesive strategy with an optional toggle feature allowing the trader to choose whether to require confirmation from both indicators before taking a position or to act on signals from either. 🎚️
The script includes user-friendly controls for:
Defining a custom trading date range 📅, useful for backtesting or restricting trading to specific market conditions.
Setting the ATR length and multiplier for Supertrend sensitivity ⚙️.
Adjusting the SSL channel period for responsiveness to price changes ⏱️.
Choosing whether to require dual confirmation (both Supertrend and SSL signals) for more conservative trading or a single indicator trigger for a more aggressive approach 🛡️ vs ⚔️.
🔍 How This Indicator Works
Signal Generation:
Supertrend analyzes market volatility and trend direction, signaling a potential buy when the trend turns bullish 📈 and a sell when bearish 📉.
SSL Channel tracks price relative to its high and low moving averages to identify uptrends and downtrends. A crossover of the SSL Up and SSL Down lines generates buy or sell signals 🔔.
Confirmation Logic:
When confirmation is enabled, the strategy waits for agreement between both indicators before entering a trade ✅, reducing false signals.
When confirmation is disabled, it trades based on signals from either indicator ⚡, allowing more frequent entries but potentially higher risk.
Entry and Exit Rules:
Entry occurs when the indicator(s) signal a new trend direction 🚀 for long, or decline for short.
Exit happens when opposing signals appear 🛑, closing existing positions to lock in profits or cut losses.
Visual Aids:
The SSL Channel lines are plotted directly on the chart with distinct colors to intuitively show trend shifts 🎨.
The system respects the specified date range ⏳, ensuring trades only occur within user-defined periods.
🎯 How to Use This Strategy Effectively
Set Your Preferences: Adjust ATR length, factor, and SSL period to your style. More sensitive? Decrease lengths. Smoother? Increase them ⚙️.
Choose Confirmation Mode: Use the toggle depending on your risk appetite:
Confirmation ON ✅: For conservative traders wanting high-probability setups.
Confirmation OFF ⚡: For aggressive traders who want more signals.
Apply Date Filters: Focus your trading or backtesting on specific periods 📅.
Monitor Entry/Exit Signals: Watch crossovers and Supertrend changes closely 👀.
Risk Management: The strategy uses position sizing as a percentage of equity (default 15%) 💰. Adjust accordingly.
Combine with Other Tools: Enhance results by combining this with volume, price action, or fundamentals 🔧.
📝 Summary
This Supertrend - SSL Strategy with Toggle is a dynamic and flexible trading tool blending volatility-based trend detection with moving-average channel insights. It empowers traders to customize confirmation strictness, control trading periods, and efficiently capture trending opportunities while managing risk smartly.
By integrating proven indicators in a user-friendly, visually intuitive package, this strategy stands as a sophisticated tool suitable for various markets and trading styles. 🚀📊

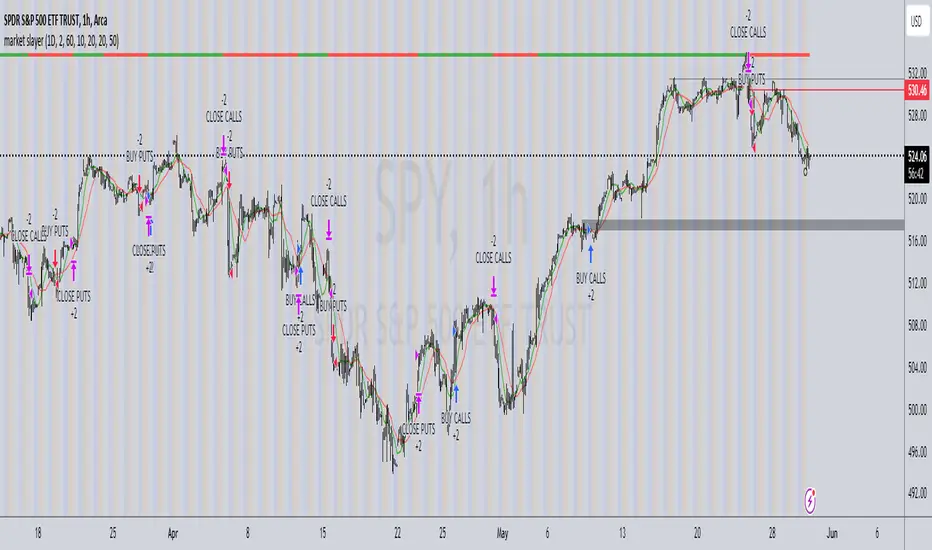
market slayerInput Parameters:
Various input parameters allow customization of the strategy, including options to show trend confirmation, specify trend timeframes and values, set SMA lengths, enable take profit and stop loss, and define their respective values.
Calculations:
Simple Moving Averages (SMAs) are calculated based on the specified lengths.
Buy and sell signals are generated based on the crossover and crossunder of the short and long SMAs.
Confirmation Bars:
Functions are defined to determine bullish or bearish confirmation bars based on certain conditions.
These confirmation bars are used to confirm trend direction and generate additional signals.
Plotting:
SMAs are plotted on the chart.
Trend labels and signal markers are plotted based on the calculated conditions.
Trade Signals:
Buy and sell conditions are defined based on the crossover/crossunder of SMAs and confirmation of trend direction.
Strategy entries and exits are executed accordingly.
Take Profit and Stop Loss:
Optional take profit and stop loss functionality is included.
Trades are automatically closed when profit or loss thresholds are reached.
Closing Trades:
Trades are also closed based on changes in trend confirmation bars to ensure alignment with the overall market direction.
Alerts:
Alert conditions are defined for opening and closing trades, providing notifications when certain conditions are met.
Overall, this script aims to provide a systematic approach to trading by combining moving average crossovers with trend confirmation bars, along with options for risk management through take profit and stop loss orders. Users can customize various parameters to adapt the strategy to different market conditions and trading preferences.
The script uses the request.security() function with the lookahead parameter set to barmerge.lookahead_on to access data from a higher timeframe within the Pine Script on TradingView. Let's break down why it's used:
Higher Timeframe Analysis:
By default, Pine Script operates on the timeframe of the chart it's applied to. However, in trading strategies, it's common to incorporate signals or data from higher timeframes to confirm or validate signals generated on lower timeframes. This helps traders to align their trades with the broader market trend.
Trend Confirmation:
In this script, the confirmationTrendTimeframe parameter allows users to specify a higher timeframe for trend confirmation. The request.security() function fetches the data from this higher timeframe and applies the defined conditions to confirm the trend direction.
Lookahead Behavior:
The lookahead parameter set to barmerge.lookahead_on ensures that the script considers the most up-to-date information available on the higher timeframe when making trading decisions on the lower timeframe. This prevents the script from lagging behind or using outdated data, enhancing the accuracy of trend confirmation.
Usage in confirmationTrendBullish and confirmationTrendBearish:
These variables are assigned the values returned by the request.security() function, which represents the bullish or bearish trend confirmation based on the conditions applied to the data from the higher timeframe.
TrendShift Pro v1.1TrendShift uses a unique series of moving average calculations to signal shifts in trend direction that goes above and beyond what is possible with common moving average trading techniques like simple moving average crosses.
What makes TrendShift different :
Unique moving average calculations - The unique calculations allow signals of shifts in trend direction to occur quickly but also avoid the chop and frequent flipflops that are common with standard moving average trading technique.
Trading filtering - A clear method of trade confirmation and additional trade filtering using popular indicators like the Ichimoku Cloud and Parabolic SAR which work synergistically with the unique moving average calculations and add additional layers of caution and refinement to filter out unreliable signals.
Dynamic trailing stoploss – A dynamically adjusted fractal stop which provides a unique and effective method of managing risk while capturing the duration of a trending move.
Strict trading criteria – Unambiguous and clearly signaled entries along with a comprehensive risk management framework and robust back-testing tools which are design to reduce discretion and subjective input as much as possible.
Features :
Clearly signaled shifts in trend direction.
Built in optimization for different trading instruments.
Custom inputs for self-optimization.
Adjustable methods of confirming trend shift signals.
Trading filtering using popular trend indicators.
Key support and resistance level displays.
Customizable display options.
Risk management using customizable adjustable trailing stop loss and position size management tools.
Customizable backtesting tools.
Customizable alert messages.
Settings :
Entry Settings:
Entry Type : for entering trades via signal candle or signal candle confirmation.
Trade type : for long only, short only, or long and short trading.
Trend Optimization : contains optimized settings for Bitcoin , Ether, and Altcoins as well as the ability to customize your own settings.
Trading Filters : allows refining signal strength by using EMAs, Ichimoku Cloud , and Parabolic SAR to filter trades.
Support and Resistance : displays traditional and DM based pivots on various time frames.
Risk Management:
Bars to Form Stoploss : allows for adjustment of bars necessary to dynamically adjust stoploss.
Risk Type : allows for backtesting calculations using % risk to account or leverage.
Display options : allows for displaying trade entry and stop loss levels either near candles or in a table.
Backtesting:
Session : allows filtering by trading session hours.
Day of Week Filter : allows filtering trading by specific day of the week.
Backtesting Time : allows adjustments to backtesting dates.
Alerts : allows for customized alert messages.
Usage :
The indicator is optimized for the 4 hour timeframe. A green bullish or red bearish signal candle indicates there has been a meaningful shift towards the respective trend direction. When a long/short entry signal is given, that means the signal candle has been confirmed and a trade can be entered accordingly.
Once a signal has been generated, a dynamically adjust stoploss will appear and self-adjust every 24-48 hours. Your stoploss should be trailed accordingly.
NOTE: Displayed back-testing results are on Binance:ADAUSDT default settings, from 2018-2023, using 3% risk, and 0.075% commission.

BURST AlgorithmBURST is a trend catching system that uses a combination of time series data and current price to decide when to buy or sell. It colors bars green when it concludes that an uptrend is in effect and red on down trends. The bar coloring differs from the actual buy and sell signals the algorithm produces due to added features for optimization, however it can be used to aid manual trading. BURST was created to capture trend in digital assets and works best on the major coins, such as Bitcoin and Ethereum, on the 30min chart.
This is a long-only strategy.
Performance Summary is calculated using 80% of total equity, with fees and slippage accounted for.
If purchased, please do not use leverage. Past performance does not guarantee future results and high leverage can turn a profitable strategy into a losing one.

Auto Harmonic Patterns - Long only StrategyThis is long only strategy where entry and exits are generated based on Harmonic Patterns.
Logic used for generation of harmonic patterns is same as the below script (Double top and bottom are removed in this script):
Now to generate entry and exit signals, following rules are used:
If there is bullish pattern:
Entry : If X is between Point B and D, then use X as entry point. Else use B as entry point. Entries are managed via stop limit orders.
StopLoss : D - ( atrMult times atr)
If there is bearish pattern and useReverseTradeOnBearishPattern is selected:
Entry : D + ( atrMult times atr)
StopLoss : If X is between Point B and D, then use X as stoploss. Else use B as stoploss
If there is any existing trade while new patterns are formed, then existing stoploss and target levels are updated accordingly instead of placing new order.
Optional Profit Targets : When takeInitialProfitOnTargets is selected, minimal profit (20% of open positions) is taken based on harmonic pattern profit targets. These targets are set only based on bullish pattern recognition
First Target : Lower of A and C
Second Target : Higher of A and C
Third Target: 1.618 times AD
Example of XABCD points are shown in below picture:
Other logic involved:
Apart from stoploss generated by patterns, there is also trailing stoploss which is simply based on trailingStopAtrMult times ATR
Stoplosses, entry points and target levels are updated only if new stoploss generated either by ATR or by harmonic patterns are higher than present stoploss. If not, previous stoplosses are used.
Happy trading. Let me know your views.
