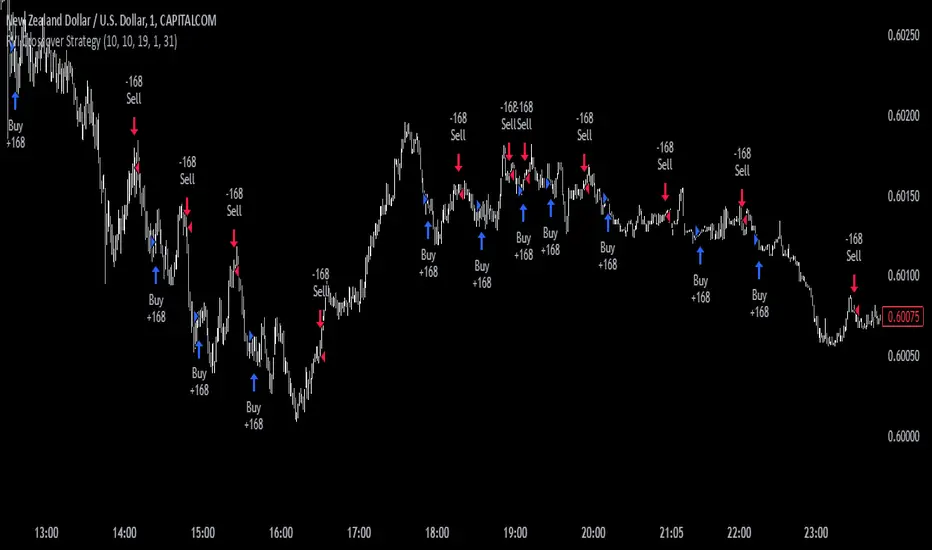
GRASS Purple Cloud [MMD] MTFThis Pine Script code is a trading strategy designed for use on the TradingView platform. It implements a multi-timeframe (MTF) strategy called "GRASS Purple Cloud " that utilizes various technical indicators to generate buy and sell signals. Below is a breakdown of the key components of the script:
Key Components of the Strategy
Inputs:
HTF (Higher Time Frame): Allows the user to select a higher time frame for analysis.
ATR and Supertrend Parameters: Inputs for the Average True Range (ATR) and Supertrend indicator, which are used to determine market volatility and trend direction.
Buying and Selling Pressure Thresholds: These thresholds help define conditions for entering trades based on buying and selling pressure.
Backtest Date Range: Users can specify a date range for backtesting the strategy.
HTF Logic:
The htfLogic function calculates various values based on the selected higher time frame, including buying and selling conditions, which are then used to generate signals.
Signal State Tracking:
The script tracks the state of buy and sell signals using a variable xs, which changes based on the conditions defined in the htfLogic function.
Coloring and Labels:
The bars on the chart are colored green for buy signals and red for sell signals. Additionally, labels are plotted to indicate strong buy and sell signals.
EMA Plotting:
The script includes optional plotting of Exponential Moving Averages (EMAs) for 20, 50, and 200 periods, which can help traders identify trends.
Trade Management:
The strategy includes parameters for take profit (TP) and stop loss (SL) levels, allowing for risk management. The user can specify the percentage for TP and SL, as well as the number of units to sell at each level.
Entries and Exits:
The script defines conditions for entering long and short positions based on the buy and sell signals. It also manages exits based on TP and SL levels.
Trendline Logic:
The script identifies the last two significant highs to draw a trendline, which can help visualize market structure.
TP/SL Plotting:
The script plots the TP and SL levels on the chart for visual reference.
Reset After Exit:
After a trade is closed, the script resets the relevant variables to prepare for the next trade.
Usage
To use this strategy:
Adjust the input parameters as needed for your trading preferences.
Add the strategy to a chart to visualize the signals and performance.
Considerations
As with any trading strategy, it's essential to backtest and validate the performance over historical data before using it in live trading.
Market conditions can change, and past performance is not indicative of future results. Always use risk management practices when trading.
Cerca negli script per "trend"

Hyperion Crypto Matrix: Ultimate Market Sentinel
// 🔰 HYPERION CRYPTO MATRIX: ULTIMATE MARKET SENTINEL
// ─────────────────────────────────────────────────────────────────────────────
/*
The **Hyperion Crypto Matrix** is an advanced crypto trend-following strategy built from the ground up for precision, not just performance. Unlike traditional “mashups” of indicators, this system was **engineered around synergy**—each module is purpose-driven and non-redundant, delivering fast, filtered, high-probability signals in volatile crypto markets.
─────────────────────────────────────────────────────────────
📌 STRATEGY PURPOSE
─────────────────────────────────────────────────────────────
Hyperion is built for **1-hour crypto trading** and optimizes for:
- High Win Rate
- Early Exits on Trend Weakness
- Partial Position Scaling (TP1/TP2)
- Real-time trade performance tracking
It is ideal for traders who want **real-time trade logic** with:
- No repainting
- No overfitting
- Realistic entry/exit structure
- No same-bar entry & exit (enforces 1-bar delay)
─────────────────────────────────────────────────────────────
🧠 WHAT MAKES IT ORIGINAL
─────────────────────────────────────────────────────────────
Each component is **custom-integrated** with strict role separation:
- **Trend Direction:** Enhanced Wave Oscillator (EWO) with adaptive band filtering
- **Trend Strength Memory:** Relative Momentum Index (RMI) with threshold locking
- **Volume Confirmation:** Historical relative volume spike filter using SMA multiplier
- **Momentum Weakness Exit:** Combined ROC and CCI to detect early reversal before price turns
- **Position Tracking:** TP1 (50% exit), TP2 (100% close) with cooldown to prevent whipsaws
- **Dynamic Dashboard:** Real-time stats including win rate, PnL efficiency, and TP hit status
These aren’t just “plugged in” indicators—they are synchronized to **filter, confirm, and adapt** to price action with timing logic that prevents premature entries or late exits.
─────────────────────────────────────────────────────────────
📊 INDICATOR LOGIC OVERVIEW
─────────────────────────────────────────────────────────────
1. **📈 Enhanced Wave Oscillator (EWO):**
- Calculates the delta between a fast and slow EMA (5 vs. 34 by default)
- Uses a dynamic banding system to detect peaks/troughs and prevent entries during exhaustion
- Filters only active, accelerating trends — reducing false positives
2. **🧠 Relative Momentum Index (RMI):**
- Similar to RSI but with a forward-looking momentum comparison
- Confirms trend *persistence* over time, preventing entries on short-term flips
- Long entries only allowed when RMI > threshold (default 55), short if RMI < 45
3. **🔊 Volume Spike Filter:**
- Uses 20-bar SMA of volume and a multiplier (1.5x default) to detect **relative volume breakouts**
- Prevents trades in low-liquidity environments (e.g., chop, overnight sessions)
4. **📉 Weak Trend Close Logic:**
- Combines Rate of Change (ROC) and Commodity Channel Index (CCI)
- Detects early signs of momentum deterioration, often before the trend visually reverses
- Triggers exit before price falls into sideways zones
5. **🎯 Take Profit System (TP1/TP2):**
- TP1: 50% position closed at +2% (default)
- TP2: Full close at +4% (default)
- Uses `strategy.exit()` with limit orders based on entry price
6. **⏱️ Reentry Cooldown:**
- After TP2 or weak trend exit, system enforces a 1-bar delay before reentry
- Avoids frequent churn in flat or noisy environments
7. **📋 Real-Time Dashboard (Optional):**
- Displays live trade status, PnL metrics, TP1/TP2 hit status, bars since entry, win rate %, and profit factor
- Color-coded background to highlight active trade direction (green for long, red for short)
─────────────────────────────────────────────────────────────
⚙️ HOW TO USE
─────────────────────────────────────────────────────────────
1. Load on a 1H chart of a crypto asset with good liquidity (e.g., BTC, ETH, LINK)
2. Toggle between \"Long Only\", \"Short Only\", or \"Both\" in the settings
3. Use default TP1/TP2 percentages, or tune them for the asset’s volatility
4. Observe trade execution and live stats on the optional dashboard
5. Review the bar coloring for EWO trend bias confirmation
> Stop-loss logic is not included. This strategy assumes exits occur at TP2 or on trend/momentum failure.
─────────────────────────────────────────────────────────────
⚖️ TRADINGVIEW COMPLIANCE & USAGE DISCLAIMER
─────────────────────────────────────────────────────────────
This strategy does **not repaint**, is fully compatible with **TradingView backtesting**, and adheres to all known Pine Script execution rules.
⚠️ **Disclaimer:** This script is for educational purposes only and does not constitute financial advice. Trading cryptocurrencies involves significant risk. Always test strategies on a demo account and consult with a financial advisor before live trading.
─────────────────────────────────────────────────────────────
🧪 CONCLUSION
─────────────────────────────────────────────────────────────
The **Hyperion Crypto Matrix** is not a mashup—it’s a **modular, optimized, logic-driven system** crafted for real-world crypto trading. Every component has been tuned for function, not fluff. Whether you're backtesting or live trading, this system is designed to give you **structured, actionable edge** with live feedback every step of the way.
*/

Follow Line Strategy Version 2.5 (React HTF)Follow Line Strategy v2.5 (React HTF) - TradingView Script Usage
This strategy utilizes a "Follow Line" concept based on Bollinger Bands and ATR to identify potential trading opportunities. It includes advanced features like optional working hours filtering, higher timeframe (HTF) trend confirmation, and improved trend-following entry/exit logic. Version 2.5 introduces reactivity to HTF trend changes for more adaptive trading.
Key Features:
Follow Line: The core of the strategy. It dynamically adjusts based on price breakouts beyond Bollinger Bands, using either the low/high or ATR-adjusted levels.
Bollinger Bands: Uses a standard Bollinger Bands setup to identify overbought/oversold conditions.
ATR Filter: Optionally uses the Average True Range (ATR) to adjust the Follow Line offset, providing a more dynamic and volatility-adjusted entry point.
Optional Trading Session Filter: Allows you to restrict trading to specific hours of the day.
Higher Timeframe (HTF) Confirmation: A significant feature that allows you to confirm trade signals with the trend on a higher timeframe. This can help to filter out false signals and improve the overall win rate.
HTF Selection Method: Choose between Auto and Manual HTF selection:
Auto: The script automatically determines the appropriate HTF based on the current chart timeframe (e.g., 1min -> 15min, 5min -> 4h, 1h -> 1D, Daily -> Monthly).
Manual: Allows you to select a specific HTF using the Manual Higher Timeframe input.
Trend-Following Entries/Exits: The strategy aims to enter trades in the direction of the established trend, using the Follow Line to define the trend.
Reactive HTF Trend Changes: v2.5 exits positions not only based on the trade timeframe (TTF) trend changing, but also when the higher timeframe trend reverses against the position. This makes the strategy more responsive to larger market movements.
Alerts: Provides buy and sell alerts for convenient trading signal notifications.
Visualizations: Plots the Follow Line for both the trade timeframe and the higher timeframe (optional), making it easy to understand the strategy's logic.
How to Use:
Add to Chart: Add the "Follow Line Strategy Version 2.5 (React HTF)" script to your TradingView chart.
Configure Settings: Customize the strategy's settings to match your trading style and preferences. Here's a breakdown of the key settings:
Indicator Settings:
ATR Period: The period used to calculate the ATR. A smaller period is more sensitive to recent price changes.
Bollinger Bands Period: The period used for the Bollinger Bands calculation. A longer period results in smoother bands.
Bollinger Bands Deviation: The number of standard deviations from the moving average that the Bollinger Bands are plotted. Higher deviations create wider bands.
Use ATR for Follow Line Offset?: Enable to use ATR to calculate the Follow Line offset. Disable to use the simple high/low.
Show Trade Signals on Chart?: Enable to show BUY/SELL labels on the chart.
Time Filter:
Use Trading Session Filter?: Enable to restrict trading to specific hours of the day.
Trading Session: The trading session to use (e.g., 0930-1600 for regular US stock market hours). Use 0000-2400 for all hours.
Higher Timeframe Confirmation:
Enable HTF Confirmation?: Enable to use the HTF trend to filter trade signals. If enabled, only trades in the direction of the HTF trend will be taken.
HTF Selection Method: Choose between "Auto" and "Manual" HTF selection.
Manual Higher Timeframe: If "Manual" is selected, choose the specific HTF (e.g., 240 for 4 hours, D for daily).
Show HTF Follow Line?: Enable to plot the HTF Follow Line on the chart.
Understanding the Signals:
Buy Signal: The price breaks above the upper Bollinger Band, and the HTF (if enabled) confirms the uptrend.
Sell Signal: The price breaks below the lower Bollinger Band, and the HTF (if enabled) confirms the downtrend.
Exit Long: The trade timeframe trend changes to downtrend or the higher timeframe trend changes to downtrend.
Exit Short: The trade timeframe trend changes to uptrend or the higher timeframe trend changes to uptrend.
Alerts:
The script includes alert conditions for buy and sell signals. To set up alerts, click the "Alerts" button in TradingView and select the desired alert condition from the script. The alert message provides the ticker and interval.
Backtesting and Optimization:
Use TradingView's Strategy Tester to backtest the strategy on different assets and timeframes.
Experiment with different settings to optimize the strategy for your specific trading style and risk tolerance. Pay close attention to the ATR Period, Bollinger Bands settings, and the HTF confirmation options.
Tips and Considerations:
HTF Confirmation: The HTF confirmation can significantly improve the strategy's performance by filtering out false signals. However, it can also reduce the number of trades.
Risk Management: Always use proper risk management techniques, such as stop-loss orders and position sizing, when trading any strategy.
Market Conditions: The strategy may perform differently in different market conditions. It's important to backtest and optimize the strategy for the specific markets you are trading.
Customization: Feel free to modify the script to suit your specific needs. For example, you could add additional filters or entry/exit conditions.
Pyramiding: The pyramiding = 0 setting prevents multiple entries in the same direction, ensuring the strategy doesn't compound losses. You can adjust this value if you prefer to pyramid into winning positions, but be cautious.
Lookahead: The lookahead = barmerge.lookahead_off setting ensures that the HTF data is calculated based on the current bar's closed data, preventing potential future peeking bias.
Trend Determination: The logic for determining the HTF trend and reacting to changes is critical. Carefully review the f_calculateHTFData function and the conditions for exiting positions to ensure you understand how the strategy responds to different market scenarios.
Disclaimer:
This script is for informational and educational purposes only. It is not financial advice, and you should not trade based solely on the signals generated by this script. Always do your own research and consult with a qualified financial advisor before making any trading decisions. The author is not responsible for any losses incurred as a result of using this script.

Uptrick X PineIndicators: Z-Score Flow StrategyThis strategy is based on the Z-Score Flow Indicator developed by Uptrick. Full credit for the original concept and logic goes to Uptrick.
The Z-Score Flow Strategy combines statistical mean-reversion logic with trend filtering, RSI confirmation, and multi-mode trade execution, offering a flexible and structured approach to trading both reversals and trend continuations.
Core Concepts Behind Z-Score Flow
1. Z-Score Mean Reversion Logic
The Z-score measures how far current price deviates from its statistical mean, in standard deviations.
A high positive Z-score (e.g. > 2) suggests price is overbought and may revert downward.
A low negative Z-score (e.g. < -2) suggests price is oversold and may revert upward.
The strategy uses Z-score thresholds to trigger signals when price deviates far enough from its mean.
2. Trend Filtering with EMA
To prevent counter-trend entries, the strategy includes a trend filter based on a 50-period EMA:
Only allows long entries if price is below EMA (mean-reversion in downtrends).
Only allows short entries if price is above EMA (mean-reversion in uptrends).
3. RSI Confirmation and Lockout System
An RSI smoothing mechanism helps confirm signals and avoid whipsaws:
RSI must be below 30 and rising to allow buys.
RSI must be above 70 and falling to allow sells.
Once a signal occurs, it is "locked out" until RSI re-enters the neutral zone (30–70).
This avoids multiple signals in overextended zones and reduces overtrading.
Entry Signal Logic
A buy or sell is triggered when:
Z-score crosses below (buy) or above (sell) the threshold.
RSI smoothed condition is met (oversold and rising / overbought and falling).
The trend condition (EMA filter) aligns.
A cooldown period has passed since the last opposite trade.
This layered approach helps ensure signal quality and timing precision.
Trade Modes
The strategy includes three distinct trade modes to adapt to various market behaviors:
1. Standard Mode
Trades are opened using the Z-score + RSI + trend filter logic.
Each signal must pass all layered conditions.
2. Zero Cross Mode
Trades are based on the Z-score crossing zero.
This mode is useful in trend continuation setups, rather than mean reversion.
3. Trend Reversal Mode
Trades occur when the mean slope direction changes, i.e., basis line changes color.
Helps capture early trend shifts with less lag.
Each mode can be customized for long-only, short-only, or long & short execution.
Visual Components
1. Z-Score Mean Line
The basis (mean) line is colored based on slope direction.
Green = bullish slope, Purple = bearish slope, Gray = flat.
A wide shadow band underneath reflects current trend momentum.
2. Gradient Fill to Price
A gradient zone between price and the mean reflects:
Price above mean = bearish zone with purple overlay.
Price below mean = bullish zone with teal overlay.
This visual aid quickly reveals market positioning relative to equilibrium.
3. Signal Markers
"𝓤𝓹" labels appear for buy signals.
"𝓓𝓸𝔀𝓷" labels appear for sell signals.
These are colored and positioned according to trend context.
Customization Options
Z-Score Period & Thresholds: Define sensitivity to price deviations.
EMA Trend Filter Length: Filter entries with long-term bias.
RSI & Smoothing Periods: Fine-tune RSI confirmation conditions.
Cooldown Period: Prevent signal spam and enforce timing gaps.
Slope Index: Adjust how far back to compare mean slope.
Visual Settings: Toggle mean lines, gradients, and more.
Use Cases & Strategy Strengths
1. Mean-Reversion Trading
Ideal for catching pullbacks in trending markets or fading overextended price moves.
2. Trend Continuation or Reversal
With multiple trade modes, traders can choose between fading price extremes or trading slope momentum.
3. Signal Clarity and Risk Control
The combination of Z-score, RSI, EMA trend, and cooldown logic provides high-confidence signals with built-in filters.
Conclusion
The Z-Score Flow Strategy by Uptrick X PineIndicators is a versatile and structured trading system that:
Fuses statistical deviation (Z-score) with technical filters.
Provides both mean-reversion and trend-based entry logic.
Uses visual overlays and signal labels for clarity.
Prevents noise-driven trades via cooldown and lockout systems.
This strategy is well-suited for traders seeking a data-driven, multi-condition entry framework that can adapt to various market types.
Full credit for the original concept and indicator goes to Uptrick.

EMA 10/55/200 - LONG ONLY MTF (4h with 1D & 1W confirmation)Title: EMA 10/55/200 - Long Only Multi-Timeframe Strategy (4h with 1D & 1W confirmation)
Description:
This strategy is designed for trend-following long entries using a combination of exponential moving averages (EMAs) on the 4-hour chart, confirmed by higher timeframe trends from the daily (1D) and weekly (1W) charts.
🔍 How It Works
🔹 Entry Conditions (4h chart):
EMA 10 crosses above EMA 55 and price is above EMA 55
OR
EMA 55 crosses above EMA 200
OR
EMA 10 crosses above EMA 500
These entries indicate short-term momentum aligning with medium/long-term trend strength.
🔹 Confirmation (multi-timeframe alignment):
Daily (1D): EMA 55 is above EMA 200
Weekly (1W): EMA 55 is above EMA 200
This ensures that we only enter long trades when the higher timeframes support an uptrend, reducing false signals during sideways or bearish markets.
🛑 Exit Conditions
Bearish crossover of EMA 10 below EMA 200 or EMA 500
Stop Loss: 5% below entry price
⚙️ Backtest Settings
Capital allocation per trade: 10% of equity
Commission: 0.1%
Slippage: 2 ticks
These are realistic conditions for crypto, forex, and stocks.
📈 Best Used On
Timeframe: 4h
Instruments: Trending markets like BTC/ETH, FX majors, or growth stocks
Works best in volatile or trending environments
⚠️ Disclaimer
This is a backtest tool and educational resource. Always validate on demo accounts before applying to real capital. Do your own due diligence.

Non-Repainting Renko Emulation Strategy [PineIndicators]Introduction: The Repainting Problem in Renko Strategies
Renko charts are widely used in technical analysis for their ability to filter out market noise and emphasize price trends. Unlike traditional candlestick charts, which are based on fixed time intervals, Renko charts construct bricks only when price moves by a predefined amount. This makes them useful for trend identification while reducing small fluctuations.
However, Renko-based trading strategies often fail in live trading due to a fundamental issue: repainting .
Why Do Renko Strategies Repaint?
Most trading platforms, including TradingView, generate Renko charts retrospectively based on historical price data. This leads to the following issues:
Renko bricks can change or disappear when new data arrives.
Backtesting results do not reflect real market conditions. Strategies may appear highly profitable in backtests because historical data is recalculated with hindsight.
Live trading produces different results than backtesting. Traders cannot know in advance whether a new Renko brick will form until price moves far enough.
Objective of the Renko Emulator
This script simulates Renko behavior on a standard time-based chart without repainting. Instead of using TradingView’s built-in Renko charting, which recalculates past bricks, this approach ensures that once a Renko brick is formed, it remains unchanged .
Key benefits:
No past bricks are recalculated or removed.
Trading strategies can execute reliably without false signals.
Renko-based logic can be applied on a time-based chart.
How the Renko Emulator Works
1. Parameter Configuration & Initialization
The script defines key user inputs and variables:
brickSize : Defines the Renko brick size in price points, adjustable by the user.
renkoPrice : Stores the closing price of the last completed Renko brick.
prevRenkoPrice : Stores the price level of the previous Renko brick.
brickDir : Tracks the direction of Renko bricks (1 = up, -1 = down).
newBrick : A boolean flag that indicates whether a new Renko brick has been formed.
brickStart : Stores the bar index at which the current Renko brick started.
2. Identifying Renko Brick Formation Without Repainting
To ensure that the strategy does not repaint, Renko calculations are performed only on confirmed bars.
The script calculates the difference between the current price and the last Renko brick level.
If the absolute price difference meets or exceeds the brick size, a new Renko brick is formed.
The new Renko price level is updated based on the number of bricks that would fit within the price movement.
The direction (brickDir) is updated , and a flag ( newBrick ) is set to indicate that a new brick has been formed.
3. Visualizing Renko Bricks on a Time-Based Chart
Since TradingView does not support live Renko charts without repainting, the script uses graphical elements to draw Renko-style bricks on a standard chart.
Each time a new Renko brick forms, a colored rectangle (box) is drawn:
Green boxes → Represent bullish Renko bricks.
Red boxes → Represent bearish Renko bricks.
This allows traders to see Renko-like formations on a time-based chart, while ensuring that past bricks do not change.
Trading Strategy Implementation
Since the Renko emulator provides a stable price structure, it is possible to apply a consistent trading strategy that would otherwise fail on a traditional Renko chart.
1. Entry Conditions
A long trade is entered when:
The previous Renko brick was bearish .
The new Renko brick confirms an upward trend .
There is no existing long position .
A short trade is entered when:
The previous Renko brick was bullish .
The new Renko brick confirms a downward trend .
There is no existing short position .
2. Exit Conditions
Trades are closed when a trend reversal is detected:
Long trades are closed when a new bearish brick forms.
Short trades are closed when a new bullish brick forms.
Key Characteristics of This Approach
1. No Historical Recalculation
Once a Renko brick forms, it remains fixed and does not change.
Past price action does not shift based on future data.
2. Trading Strategies Operate Consistently
Since the Renko structure is stable, strategies can execute without unexpected changes in signals.
Live trading results align more closely with backtesting performance.
3. Allows Renko Analysis Without Switching Chart Types
Traders can apply Renko logic without leaving a standard time-based chart.
This enables integration with indicators that normally cannot be used on traditional Renko charts.
Considerations When Using This Strategy
Trade execution may be delayed compared to standard Renko charts. Since new bricks are only confirmed on closed bars, entries may occur slightly later.
Brick size selection is important. A smaller brickSize results in more frequent trades, while a larger brickSize reduces signals.
Conclusion
This Renko Emulation Strategy provides a method for using Renko-based trading strategies on a time-based chart without repainting. By ensuring that bricks do not change once formed, it allows traders to use stable Renko logic while avoiding the issues associated with traditional Renko charts.
This approach enables accurate backtesting and reliable live execution, making it suitable for trend-following and swing trading strategies that rely on Renko price action.

Neon Momentum Waves StrategyIntroduction
The Neon Momentum Waves Strategy is a momentum-based indicator designed to help traders visualize potential shifts in market direction. It builds upon a MACD-style calculation while incorporating an enhanced visual representation of momentum waves. This approach may assist traders in identifying areas of increasing or decreasing momentum, potentially aligning with market trends or reversals.
How It Works
This strategy is based on a modified MACD (Moving Average Convergence Divergence) method, calculating the difference between two Exponential Moving Averages (EMAs). The momentum wave represents this difference, while an additional smoothing line (signal line) helps highlight potential momentum shifts.
Key Components:
Momentum Calculation:
Uses a fast EMA (12-period) and a slow EMA (26-period) to measure short-term and long-term momentum.
A signal line (20-period EMA of the MACD difference) smooths fluctuations.
The histogram (momentum wave) represents the divergence between the MACD value and the signal line.
Interpreting Momentum Changes:
Momentum Increasing: When the histogram rises above the zero line, it may indicate strengthening upward movement.
Momentum Decreasing: When the histogram moves below the zero line, it may signal a weakening trend or downward momentum.
Potential Exhaustion Points: Users can define custom threshold levels (default: ±10) to highlight when momentum is significantly strong or weak.
Visual Enhancements:
The neon glow effect is created by layering multiple plots with decreasing opacity, enhancing the clarity of momentum shifts.
Aqua-colored waves highlight upward momentum, while purple waves represent downward momentum.
Horizontal reference lines mark the zero line and user-defined thresholds to improve interpretability.
How It Differs from Traditional Indicators
Improved Visualization: Unlike standard MACD histograms, this approach provides clearer visual cues using a neon-style wave format.
Customizable Thresholds: Rather than relying solely on MACD crossovers, users can adjust sensitivity settings to better suit their trading style.
Momentum-Based Approach: The strategy is focused on visualizing shifts in momentum strength, rather than predicting price movements.
Potential Use Cases
Momentum Trend Awareness: Helps traders identify periods where momentum appears to be strengthening or fading.
Market Structure Analysis: May complement other indicators to assess whether price action aligns with momentum changes.
Flexible Timeframe Application: Can be used across different timeframes, depending on the trader’s strategy.
Important Considerations
This strategy is purely momentum-based and does not incorporate volume, fundamental factors, or price action confirmation.
Momentum shifts do not guarantee price direction changes—they should be considered alongside broader market context.
The strategy may perform differently in trending vs. ranging markets, so adjustments in sensitivity may be needed.
Risk management is essential—traders should apply proper stop-losses and position sizing techniques in line with their risk tolerance.
Conclusion
The Neon Momentum Waves Strategy provides a visually enhanced method of tracking momentum, allowing traders to observe potential changes in market strength. While not a predictive tool, it serves as a complementary indicator that may help traders in momentum-based decision-making. As with any technical tool, it should be used as part of a broader strategy that considers multiple factors in market analysis.

4 Bar Momentum Reversal strategy█ STRATEGY DESCRIPTION
The "4 Bar Momentum Reversal Strategy" is a mean-reversion strategy designed to identify price reversals following a sustained downward move. It enters a long position when a reversal condition is met and exits when the price shows strength by exceeding the previous bar's high. This strategy is optimized for indices and stocks on the daily timeframe.
█ WHAT IS THE REFERENCE CLOSE?
The Reference Close is the closing price from X bars ago, where X is determined by the Lookback period. Think of it as a moving benchmark that helps the strategy assess whether prices are trending upwards or downwards relative to past performance. For example, if the Lookback is set to 4, the Reference Close is the closing price 4 bars ago (`close `).
█ SIGNAL GENERATION
1. LONG ENTRY
A Buy Signal is triggered when:
The close price has been lower than the Reference Close for at least `Buy Threshold` consecutive bars. This indicates a sustained downward move, suggesting a potential reversal.
The signal occurs within the specified time window (between `Start Time` and `End Time`).
2. EXIT CONDITION
A Sell Signal is generated when the current closing price exceeds the high of the previous bar (`close > high `). This indicates that the price has shown strength, potentially confirming the reversal and prompting the strategy to exit the position.
█ ADDITIONAL SETTINGS
Buy Threshold: The number of consecutive bearish bars needed to trigger a Buy Signal. Default is 4.
Lookback: The number of bars ago used to calculate the Reference Close. Default is 4.
Start Time and End Time: The time window during which the strategy is allowed to execute trades.
█ PERFORMANCE OVERVIEW
This strategy is designed for trending markets with frequent reversals.
It performs best in volatile conditions where price movements are significant.
Backtesting results should be analysed to optimize the Buy Threshold and Lookback parameters for specific instruments.

Fibonacci Retracement Strategy for CryptoThe Enhanced Fibonacci Retracement Strategy is designed to help traders capitalize on key Fibonacci levels for both long and short trades. This script automatically identifies significant swing highs and lows within a customizable lookback period and dynamically plots Fibonacci retracement levels (0%, 23.6%, 38.2%, 50%, 61.8%, 78.6%, and 100%) as support and resistance levels.
Key Features:
Automatic Fibonacci Levels:
The script identifies the highest high and lowest low over a user-defined lookback period to calculate Fibonacci retracement levels.
Dual-Directional Trading:
Long Trades: Triggered when the price crosses above the 61.8% retracement level, anticipating a reversal.
Short Trades: Triggered when the price crosses below the 38.2% retracement level, capturing potential downward movement.
Compact Line Option:
Users can toggle "Compact Fibonacci Lines" to reduce visual clutter on the chart, making the lines shorter and easier to interpret.
Dynamic Alerts:
Alerts are embedded directly into the strategy logic for entry and exit points.
Long Entry: Triggered when the price bounces above the 61.8% level.
Long Exit: Triggered when the price reaches the 23.6% level.
Short Entry: Triggered when the price crosses below the 38.2% level.
Short Exit: Triggered when the price reaches the 78.6% level.
Clear Visualization:
Fibonacci levels are plotted with distinct colors and dashed lines (optional compact view),
providing traders with clear and actionable levels to make decisions.
Inputs:
Lookback Period: Number of candles to calculate swing highs and lows.
Plot Fibonacci Levels: Toggle to enable/disable plotting levels.
Compact Fibonacci Lines: Reduce the length of Fibonacci lines for a cleaner chart.
How It Works:
The strategy identifies a high-low range within the lookback period.
Fibonacci levels are calculated based on the range and plotted on the chart.
Long Trade Example:
Enter when the price crosses above the 61.8% level.
Exit when the price reaches the 23.6% level.
Short Trade Example:
Enter when the price crosses below the 38.2% level.
Exit when the price reaches the 78.6% level.
Best Use Cases:
Trending Markets: Use retracements to time entries in the direction of the trend.
Range-Bound Markets: Identify and trade reversals near key Fibonacci levels.
Important Notes:
This strategy is not financial advice and should be backtested thoroughly before live trading.
Risk management is crucial! Consider using stop-loss orders for protection.
Customize inputs to suit your preferred timeframe and trading style.

RVI Crossover Strategy[Kopottaja]Overview of the RVI Crossover Strategy
Strategy Name: RVI Crossover Strategy
Purpose: The RVI Crossover Strategy is based on the crossover signals between the Relative Vigor Index (RVI) and its moving average signal line. This strategy aims to identify potential buy and sell signals by evaluating the market’s directional trend.
Key Indicator Features
Relative Vigor Index (RVI): This indicator measures the momentum of price changes over a specified period and helps identify the market’s current trend. The RVI is based on the idea that prices generally close higher than they open in an uptrend (and lower in a downtrend). The RVI helps provide an indication of the strength and direction of a trend.
Signal Line: A moving average (e.g., SMA) is applied to the RVI values, creating a "signal line." When the RVI crosses above or below this line, it signals a potential trading opportunity.
Calculations and Settings
Calculating the RVI: The RVI is calculated by comparing the difference between the close and open prices to the difference between high and low prices. This provides information about the direction and momentum of price movement:
RVI= Sum(SWMA(high−low))Sum(SWMA(close−open))
where SWMA is a smoothed weighted moving average over a specified period.
Signal Line Calculation: The RVI value is smoothed by applying a simple moving average (SMA) to create the signal line. This signal line helps filter crossover signals for improved accuracy.
Buy and Sell Conditions: Buy and sell conditions are identified based on crossovers between the RVI and its signal line.
Buy Signal: A buy condition is triggered when the RVI crosses above the signal line, provided that the "Bearish" condition (trend confirmation) is met.
Sell Signal: A sell condition occurs when the RVI crosses below the signal line, alongside the "Bullish" trend confirmation.
Volume-Weighted Moving Averages (VWMA): VWMA indicators are used to assess price-volume relationships over different timeframes:
Fast VWMA: A short-period volume-weighted moving average.
Slow VWMA: A longer-period volume-weighted moving average. These values are used to strengthen the buy and sell conditions by confirming trend directions (Bullish or Bearish).
Disclaimer: This is an educational and informational tool. Past performance is not indicative of future results. Always backtest before using in live markets
Trend Confirmation and ASO-based StrategyStrategy Name: Trend Confirmation with EMA, ASO, and ATR Bands Auto-Trading
Purpose:
This strategy aims to enhance trend confirmation and entry point precision by combining multiple technical indicators. Specifically, it uses the 200 EMA for trend confirmation, the Average Sentiment Oscillator (ASO) to capture market sentiment, and ATR bands for risk management. This provides a comprehensive approach to capturing trade opportunities. The strategy emphasizes trend-following trades, reducing noise while keeping risk management simple.
Uniqueness and Usefulness:
Uniqueness:
This strategy stands out because it integrates multiple elements that complement each other for increased effectiveness and originality. Instead of relying on a single indicator, it generates more accurate trading signals by allowing each indicator to work synergistically.
200 EMA: Used to confirm the long-term trend, providing clarity on the trend direction and ensuring trades align with the dominant market trend.
Average Sentiment Oscillator (ASO): Measures market sentiment based on the crossover between the bull and bear lines. Signals are generated only when ASO detects a trend shift, filtering out price fluctuations and noise.
ATR Bands: Evaluates market volatility and sets stop-loss levels upon entry. By using ATR bands, the strategy supports traders in maintaining a fixed stop-loss for risk management.
Each component analyzes the market from a different perspective, and together, they generate reliable signals for trend-following trades. These indicators are not simply combined but are clearly defined in their roles to improve signal quality.
Usefulness:
This strategy is suitable for medium to long-term traders who focus on trend-following. It emphasizes entry during the early stages of a trend and focuses on risk management by offering reliable signals with minimal noise. The combination of ASO and ATR bands allows traders to assess market volatility while setting take profit levels based on a risk-reward ratio. This helps avoid overreacting to short-term price fluctuations and supports sustainable trading practices.
Entry Conditions:
Long Entry:
Condition: Price is above the 200 EMA, and the ASO bull line crosses above the bear line while also exceeding the 50 level.
Signal: A buy signal is generated, indicating the start of an uptrend.
Short Entry:
Condition: Price is below the 200 EMA, and the ASO bear line crosses above the bull line while also exceeding the 50 level.
Signal: A sell signal is generated, indicating the start of a downtrend.
Exit Conditions:
Exit Strategy:
While this strategy automates both entries and exits, it is recommended that traders manually manage their positions for risk control when necessary. The stop-loss is set based on ATR bands at the time of entry, and a take-profit is set with a risk-reward ratio of 1:1.5.
Risk Management:
This strategy incorporates a fixed stop-loss mechanism, where the stop-loss is set at entry based on the ATR band value. Once set, the stop-loss remains fixed, ensuring that trades stay within a predetermined risk range. The take-profit is based on a risk-reward ratio of 1:1.5, increasing the potential reward relative to the risk.
Account Size: ¥100,000
Commissions and Slippage: Assumed commission of 94 pips per trade and slippage of 1 pip.
Risk per Trade: 10% of account equity (adjustable based on risk tolerance).
Configurable Options:
ASO Period: Period setting for the Average Sentiment Oscillator (default is 32).
ATR Multiplier: Multiplier for ATR band calculation (default is 2.0).
EMA Period: Settings for the 200 EMA.
Signal Display Control: Option to toggle entry signal visibility on or off.
Adequate Sample Size:
To verify the effectiveness of this strategy, it is recommended to conduct extensive backtesting over a long period, covering different market conditions, including both high and low volatility environments.
Credits:
Acknowledgments:
This strategy integrates technical approaches based on the Average Sentiment Oscillator, 200 EMA, and ATR bands, drawing insights from the broader trading community.
Clean Chart Description:
Chart Appearance:
This strategy maintains a clean chart display by offering a toggle to switch the visibility of the ASO, EMA, and entry signals on or off. This helps reduce visual clutter and enhances effective trend analysis.
Addressing the House Rule Violations:
Omissions and Unrealistic Claims:
This strategy makes no exaggerated claims or guarantees about performance. All signals are provided for educational purposes, and it is emphasized that past performance does not guarantee future results. Proper risk management is essential, and the importance of this is highlighted throughout the strategy.
Fine-Tune Inputs: Fourier Smoothed Hybrid Volume Spread AnalysisUse this Strategy to Fine-tune inputs for the HSHVSA Indicator.
Strategy allows you to fine-tune the indicator for 1 TimeFrame at a time; cross Timeframe Input fine-tuning is done manually after exporting the chart data.
I suggest using " Close all " input False when fine-tuning Inputs for 1 TimeFrame. When you export data to Excel/Numbers/GSheets I suggest using " Close all " input as True , except for the lowest TimeFrame.
MEANINGFUL DESCRIPTION:
The Fourier Smoothed Hybrid Volume Spread Analysis (FSHVSA) Strategy/Indicator is an innovative trading tool designed to fuse volume analysis with trend detection capabilities, offering traders a comprehensive view of market dynamics.
This Strategy/Indicator stands apart by integrating the principles of the Discrete Fourier Transform (DFT) and volume spread analysis, enhanced with a layer of Fourier smoothing to distill market noise and highlight trend directions with unprecedented clarity.
This smoothing process allows traders to discern the true underlying patterns in volume and price action, stripped of the distractions of short-term fluctuations and noise.
The core functionality of the FSHVSA revolves around the innovative combination of volume change analysis, spread determination (calculated from the open and close price difference), and the strategic use of the EMA (default 10) to fine-tune the analysis of spread by incorporating volume changes.
Trend direction is validated through a moving average (MA) of the histogram, which acts analogously to the Volume MA found in traditional volume indicators. This MA serves as a pivotal reference point, enabling traders to confidently engage with the market when the histogram's movement concurs with the trend direction, particularly when it crosses the Trend MA line, signalling optimal entry points.
It returns 0 when MA of the histogram and EMA of the Price Spread are not align.
WHAT IS FSHVSA INDICATOR:
The FSHVSA plots a positive trend when a positive Volume smoothed Spread and EMA of Volume smoothed price is above 0, and a negative when negative Volume smoothed Spread and EMA of Volume smoothed price is below 0. When this conditions are not met it plots 0.
HOW TO USE THE STRATEGY:
Here you fine-tune the inputs until you find a combination that works well on all Timeframes you will use when creating your Automated Trade Algorithmic Strategy. I suggest 4h, 12h, 1D, 2D, 3D, 4D, 5D, 6D, W and M.
ORIGINALITY & USEFULNESS:
The FSHVSA Strategy is unique because it applies DFT for data smoothing, effectively filtering out the minor fluctuations and leaving traders with a clear picture of the market's true movements. The DFT's ability to break down market signals into constituent frequencies offers a granular view of market dynamics, highlighting the amplitude and phase of each frequency component. This, combined with the strategic application of Ehler's Universal Oscillator principles via a histogram, furnishes traders with a nuanced understanding of market volatility and noise levels, thereby facilitating more informed trading decisions.
DETAILED DESCRIPTION:
My detailed description of the indicator and use cases which I find very valuable.
What is the meaning of price spread?
In finance, a spread refers to the difference between two prices, rates, or yields. One of the most common types is the bid-ask spread, which refers to the gap between the bid (from buyers) and the ask (from sellers) prices of a security or asset.
We are going to use Open-Close spread.
What is Volume spread analysis?
Volume spread analysis (VSA) is a method of technical analysis that compares the volume per candle, range spread, and closing price to determine price direction.
What does this mean?
We need to have a positive Volume Price Spread and a positive Moving average of Volume price spread for a positive trend. OR via versa a negative Volume Price Spread and a negative Moving average of Volume price spread for a negative trend.
What if we have a positive Volume Price Spread and a negative Moving average of Volume Price Spread?
It results in a neutral, not trending price action.
Thus the Indicator/Strategy returns 0 and Closes all long and short positions.
In the next Image you can see that trend is negative on 4h, we just move Negative on 12h and Positive on 1D. That means trend/Strategy flipped negative .
I am sorry, the chart is a bit messy. The idea is to use the indicator/strategy over more than 1 Timeframe.
Use this Strategy to fine-tune inputs for the HSHVSA Indicator.
(Strategy allows you to fine-tune the indicator for 1 TimeFrame at a time; cross Timeframe Input fine-tuning is done manually after exporting the chart data)
I suggest using " Close all " input False when fine-tuning Inputs for 1 TimeFrame. When you export data to Excel/Numbers/GSheets I suggest using " Close all " input as True , except for the lowest TimeFrame. I suggest using 100% equity as your default quantity for fine-tune purposes. I have to mention that 100% equity may lead to unrealistic backtesting results. Be avare. When backtesting for trading purposes use Contracts or USDT.

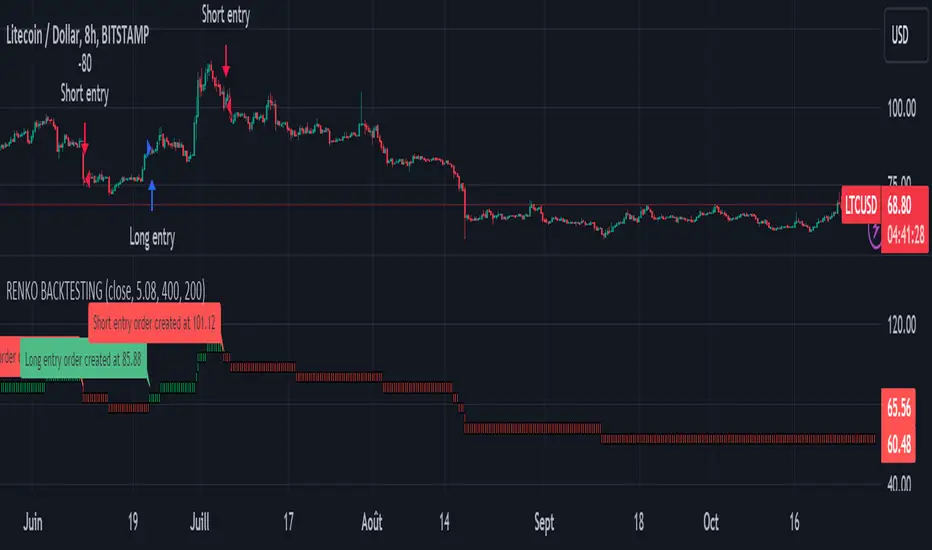
Renko StrategyRENKO STRATEGY
CAUTION : This strategy must be applied to a candlestick chart (not a Renko chart).
INTRODUCTION :
The Traditional Renko chart has been reproduced and is plotted according to the evolution of the price. It will enable us to receive buy or sell signals and follow major trends. This is a medium/long term strategy and depends a lot on the box size chosen in the parameters. There's also a money management method allowing us to reinvest part of the profits or reduce the size of orders in the event of substantial losses.
RENKO CHART :
Renko chart construction methodology :
The user must first choose the box size. The minimum is 0.00001 and there is no maximum. The default is 10. The user must then choose the source that will define the data on which the calculations will be based (high, low, open, close). By default, close is selected. The first candle on the chart is used to draw the first box with its high and low.
Each time the price changes by the amount of the box size relative to the high or low of the last box, a new box is added above or below the previous one. If price variations are less than the box size, the same box is added next to the previous one. If price variations are N (integer number) times greater than box size, N boxes are added above or below the previous one. Each box added above the previous one is a green box, while each box added below the previous one is a red box.
Conditions for drawing a green box above the previous one :
(source - high_of_the_last_box) / box_size > 1
Condition for drawing a red box below the previous one :
(low_of_the_last_box - source) / box_size > 1
If neither condition is triggered, the same box is drawn next to the previous one.
Example :
The last candle has drawn a box with low 12 and high 14. The box size is therefore 2. The strategy will look at the value of the close each time a candle ends. The current candle closes with a close equal to 15.5. As the variation from the previous high is only 1.5 (which is less than the box size), the same box is added next to the previous one. The next candle closes at 16.2. The price variation is therefore 2.2 compared with the previous high. We can now add a new green box just above the previous one, with a low of 14 and a high of 16. The same process applies if the candle's close is at least one box size below the low of the last box. In this case, a new red box is placed below the previous one.
PARAMETERS :
Source : Allows you to specify which data will be taken into account by the strategy when performing calculations. The default is close.
Box size : Size of Renko graph boxes. This is a very important parameter to choose carefully, as it has a strong impact on the strategy's performance. Defaults to 10.
Fixed Ratio : This is the amount of gain or loss at which the order quantity is changed. The default is 400, meaning that for each $400 gain or loss, the order size is increased or decreased by a user-selected amount.
Increasing Order Amount : This is the amount to be added to or subtracted from orders when the fixed ratio is reached. The default is $200, which means that for every $400 gain, $200 is reinvested in the strategy. On the other hand, for every $400 loss, the order size is reduced by $200.
Initial capital : $1000
Fees : Interactive Broker fees apply to this strategy. They are set at 0.18% of the trade value.
Slippage : 3 ticks or $0.03 per trade. Corresponds to the latency time between the moment the signal is received and the moment the order is executed by the broker.
Important : A bot has been used to test all possible box sizes to find out which one generates the highest return on BITSTAMP:LTCUSD while limiting the drawdown. This strategy is the most optimal with a box size equal to 5.08 in 8h timeframe.
BUY AND SHORT SIGNALS :
As the aim of this strategy is to follow major trends based on price movements, we need to be on the right side of price fluctuation. We trade every box reversal, i.e. we are LONG when the boxes are green indicating an uptrend and SHORT when they are red indicating a downtrend.
RISK MANAGEMENT :
This strategy can incur losses. The size of the box is decisive, as it is used to plot the RENKO chart and thus trigger buy or sell signals. It's also what allows us to manage risk. For every trade, we risk a maximum amount equal to 2 times the size of the box, i.e. :(5.08*2*nb_contract)/trade_value.
MONEY MANAGEMENT :
The fixed ratio method has been used to manage our gains and losses. For each gain of an amount equal to the value of the fixed ratio, we increase the order size by a value defined by the user in the "Increasing order amount" parameter. Similarly, each time we lose an amount equal to the value of the fixed ratio, we decrease the order size by the same user-defined value. This strategy not only increases our performance, but also our drawdown.
Enjoy the strategy and don't forget to take the trade :)
Trend Confirmation StrategyThe profitability and uniqueness of a trading strategy depend on various factors including market conditions, risk management, and the strategy's ability to capitalize on price movements. I'll describe the strategy provided and highlight its potential benefits and differences compared to other strategies:
Strategy Overview:
The provided strategy combines three technical indicators: Supertrend, MACD, and VWAP. It aims to identify potential entry and exit points by confirming trend direction and considering the proximity to the VWAP level. The strategy also incorporates stop-loss and take-profit mechanisms, as well as a trailing stop.
Unique Aspects and Potential Benefits:
Trend Confirmation: The strategy uses both Supertrend and MACD to confirm the trend direction. This dual confirmation can increase the likelihood of accurate trend identification and filter out false signals.
VWAP Confirmation: The strategy considers the proximity of the price to the VWAP level. This dynamic level can act as a support or resistance and provide additional context for entry decisions.
Adaptive Stop Loss: The strategy sets a stop-loss range, which helps provide some tolerance for minor price fluctuations. This adaptive approach considers market volatility and helps prevent premature stop-loss triggers.
Trailing Stop: The strategy incorporates a trailing stop mechanism to lock in profits as the trade moves in the desired direction. This can potentially enhance profitability during strong trends.
Partial Profit Booking: While not explicitly implemented in the provided code, you could consider booking partial profits when the MACD shows a crossover in the opposite direction. This aspect could help secure gains while still keeping exposure to potential further price movements.
Key Differences from Other Strategies:
Dual Indicator Confirmation: The combination of Supertrend and MACD for trend confirmation is a unique aspect of this strategy. It adds an extra layer of filtering to enhance the accuracy of entry signals.
Dynamic VWAP: Incorporating the VWAP level into the decision-making process adds a dynamic element to the strategy. VWAP is often used by institutional traders, and its inclusion can provide insights into the market sentiment.
Adaptive Stop Loss and Trailing: The strategy's use of an adaptive stop-loss range and a trailing stop can help manage risk and protect profits more effectively during changing market conditions.
Partial Profit Booking: The suggestion to consider partial profit booking upon MACD crossovers in the opposite direction is a practical approach to secure gains while staying in the trade.
Caution and Considerations:
Backtesting: Before deploying any strategy in real trading, it's crucial to thoroughly backtest it on historical data to understand its performance under various market conditions.
Risk Management: While the strategy has built-in risk management mechanisms, it's essential to carefully manage position sizes and overall portfolio risk.
Market Conditions: No strategy works well in all market conditions. It's important to be flexible and adjust the strategy or refrain from trading during particularly volatile or unpredictable periods.
Continuous Monitoring: Even though the strategy includes automated components, continuous monitoring of the trades and market conditions is necessary.
Adaptability: Markets can change over time. Traders need to be prepared to adapt the strategy as necessary to stay aligned with evolving market dynamics.

Quantitative Trend Strategy- Uptrend longTrend Strategy #1
Indicators:
1. SMA
2. Pivot high/low functions derived from SMA
3. Step lines to plot support and resistance based on the pivot points
4. If the close is over the resistance line, green arrows plot above, and vice versa for red arrows below support.
Strategy:
1. Long Only
2. Mutable 2% TP/1.5% SL
3. 0.01% commission
4. When the close is greater than the pivot point of the sma pivot high, and the close is greater than the resistance step line, a long position is opened.
*At times, the 2% take profit may not trigger IF; the conditions for reentry are met at the time of candle closure + no exit conditions have been triggered.
5. If the position is in the green and the support step line crosses over the resistance step line, positions are exited.
How to use it and what makes it unique:
Use this strategy to trade an up-trending market using a simple moving average to determine the trend. This strategy is meant to capture a good risk/reward in a bullish market while staying active in an appropriate fashion. This strategy is unique due to it's inclusion of the step line function with statistics derived from myself.
This description tells the indicators combined to create a new strategy, with commissions and take profit/stop loss conditions included, and the process of strategy execution with a description on how to use it. If you have any questions feel free to PM me and boost if you enjoyed it. Thank you, pineUSERS!

Volume-Weighted Supertrend Strategy [wbburgin]This is a script that can be used as a strategy or a standalone indicator.
The Volume-Weighted Supertrend is a supertrend based on a rolling VWAP, instead of a normal price source. The strategy has two components - a supertrend based off of this VWAP (shown on the chart) and a supertrend from volume itself (not plotted on the chart directly). The supertrend from volume is an example of my "Supertrend Any Source" indicator, where a custom ATR is created from non-OHLC data; this is available as both a separate public script and also in my "wbburgin_utils" library for you to use in your own script creation.
The supertrend from volume acts as a confirmation filter for the VWAP-supertrend shown on-chart. If the volume supertrend is trending up and the VWAP-based supertrend is also trending up, a buy signal is generated. Likewise, if the volume supertrend is trending down and the VWAP-supertrend is trending down, a sell signal is generated. The colors are based off of whether both supertrends are trending up or down: green for both up, blue for only price up, orange for only price down, and red for both down.
The settings enable you to change the volume length and the ATR length separately, as well as the multiplier and the source for the price supertrend. If you load the indicator for the first time and see no entries and exits, this is because "Show Strategy Entries and Exits" is disabled in the settings. This is if you plan on using the strategy as an indicator and don't want to be bothered by the entry and exit symbols on the chart. Additionally, for those who like clean charts (like me), you can turn all the labels off in the settings, as well as the highlighting.
My default strategy settings for the strategy results shown below are as follows: 5% equity per trade, 5 degrees of pyramiding, commissions of 0.08% per trade. This strategy doesn't come with stops yet, so please be aware of that before using it to trade - I highly suggest you create your own stops based off of your R/R ratio and personal risk tolerance. Additionally, it works best on trending assets (b/c of the supertrends) with high volume. This might mean it does not work as well on lower timeframes.

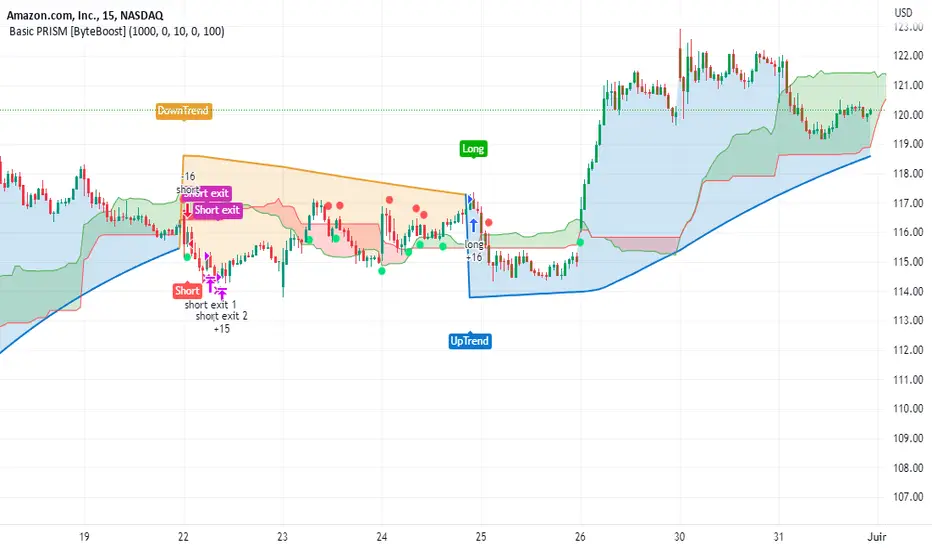
Basic PRISM Algorithm [ByteBoost]The Basic ByteBoost PRISM strategy is designed to operate in various market conditions by leveraging the concept of brownian motion theory, which refers to the unpredictable movement of particles suspended in a fluid. This characteristic of random motion can be effectively utilized for analyzing time series data, such as market candles. Based on this notion, we are making the following assumptions regarding the market.
The stock price exhibits characteristics of Brownian motion.
The stock price is distributed in a log-normal pattern.
Volatility remains constant over time.
Options can only be exercised upon expiration.
Risk-free interest does not fluctuate over time.
There are no random or arbitrary opportunities present in the market.
Development Notes
This Strategy was developed with the PineScript language, version 5. This indicator, and most of the descriptions below, were derived largely from the TradingView reference manual. Feedback and suggestions for improvement are more than welcome, as well as recommended input settings and best practices to assist and guide new users effectively.
Features
The ByteBoost PRISM indicator is capable of analyzing multiple aspects of market behavior simultaneously such as:
Detection of potential trend reversals.
Assessment of trend strength and market sentiment.
Identification of stop loss levels.
Discovery of potential entry and exit points.
Ensuring compatibility and effectiveness with other indicators.
Visualization of strategy using historical data.
Strategy Description
PRISM is an all in one strategy that allows the visualization of entry and exit points as well as the historical performance for every set of parameters. PRISM is a slow paced indicator recommended for the 1h timeframe, because it operates on the belief that markets move in a Brownian motion, for which it leaves enough space and time for the market to decide a trend and catch it at the right time as well as finding appropriate exits given the trend.
PRISM can exist in either an uptrend or downtrend state, but it does not necessarily imply that it reflects the true trend being observed. Instead, it emphasizes capturing significant movements and capitalizing on them by utilizing oscillator levels and exit points calculated based on oversold or overbought values, along with the volatility associated with these movements.
Usage
To use this strategy it is first needed to select a correct set of inputs that correspond to the market you are using, the extra, win difference and oscillator length are dependent on the current market and the average price it manages, so these inputs need to be modified for every pair of assets used.
The long and short tags signify the opportune moment to initiate a new position in the market, whether it's a long or short position, respectively. The exit tags indicate when these positions should be closed. If no exits occur before a new long or short position emerges, it is essential to conclude the existing position and commence a new one in the opposite direction.
Regarding exits, up to two exits can be executed for each movement. The user has the flexibility to determine how these exits are utilized. In the input section, a specific percentage of equity can be selected to be sold during the first exit. If set to 100%, only a single exit will be presented. Otherwise, the remaining equity will be sold during the second exit or at the next trend reversal depending on which action occurs first.
In case the user requires additional exits beyond the initial two, the alternative exits option can be activated in the inputs. This will provide access to supplementary exits, although they may be less advisable compared to the primary exits.
Inputs / Settings
Capital - If using any leverage multiply the amount of money to invest by the leverage, else input the amount to be invested in every trade.
Start date - The date from which the strategy should begin its analysis. Leave unchanged to start from the earliest available date based on your account's plan.
End date - The date until which the strategy should conduct its analysis. Leave unchanged to continue until the current date.
Extra - The minimum gain required in the market to trigger an exit opportunity. It can be a negative number to allow exits at a loss, potentially minimizing losses.
First exit % - If an exit is decided to be partial, it is very likely that there will be a second exit, this parameter determines the percentage of equity to be sold at the first exit. Note that a second exit may not always be applicable.
Win difference - The minimum difference between the entry point and the first exit to determine whether it should be a full exit or a partial exit, as the exit price approaches the entry price, the probability of a trend reversal increases, a full exit is beneficial.
Oscillator - Enables or disables the main oscillator, which helps determine entry points. Not all assets may benefit from this parameter.
Oscillator length - Specifies the number of candles considered for the entry points oscillator.
Highlighter - Applies a light color between the trend and average price of each bar.
Labels - Displays all the labels on the chart indicating trends, positions and exits.
Candle color - Color codes the inside of the candles with the current signal.
Oscillator points - Adds visual dots to indicate when the oscillator has changed its trend.
Color uptrend - Determines the color scheme for identifying uptrend movements.
Color downtrend - Determines the color scheme for identifying downtrend movements.
Color long - Sets the color scheme for a new long position.
Color short - Sets the color scheme for a new short position.
Color exit - Decides the color scheme for the exit tag and cross shown.
Indicator Visuals
The strategy plots the direction of the trend on the chart and changes its color based on this. It also plots shapes on the chart to denote potential buy (Long) and sell (Short) points, where the signals of short and long will appear as well as exit points which can be found as three different,
Exit 1 - A partial exit which sells the previously selected percentage of equity.
Exit 2 - A second exit that can only happen after an Exit 1 has happened, and sell the remaining amount of equity.
Exit Full - A full exit is executed when the price at the exit point is lower than the entry price plus the win difference value. This condition indicates that it is more advantageous to take a single exit rather than waiting for a second exit.
Strategy Alerts
The strategy does not include built-in alerts. However, alerts can be added using the TradingView interface based on the strategy's buy and sell conditions. This way you will be able to receive notifications on your computer or phone when a new signal goes out.
Details
Repainting: It is important to mention that the strategy can mark false long or short signals, as the oscillator is allowed to repaint on the same candle. So users must make sure the candle has closed on buy/sell conditions.
Excessive capital issue: If you configure the strategy with a big amount of capital (+$1,000,000 for example) it is possible that it will completely stop calculating exit signals, as they will be too big for TradingView’s engine to process.
Conclusion
The ByteBoost PRISM strategy empowers traders by providing comprehensive market analysis, clear entry and exit signals, and the ability to visualize strategy performance using historical data. It is a superior algorithm that maximizes profit potential and minimizes risks, making it the preferred choice for traders seeking a competitive edge in the financial markets.
Disclaimer
This strategy is provided as-is, with no guarantee of profits or responsibility for losses. Trading involves risk, and you should only trade with money you can afford to lose. Always conduct your own research and consider your financial situation before engaging in trading.
Premium PRISM Algorithm [ByteBoost]The ByteBoost PRISM strategy is designed to operate in various market conditions by leveraging the concept of brownian motion theory, which refers to the unpredictable movement of particles suspended in a fluid. This characteristic of random motion can be effectively utilized for analyzing time series data, such as market candles. Based on this notion, we are making the following assumptions regarding the market.
The stock price exhibits characteristics of Brownian motion.
The stock price is distributed in a log-normal pattern.
Volatility remains constant over time.
Options can only be exercised upon expiration.
Risk-free interest does not fluctuate over time.
There are no random or arbitrary opportunities present in the market.
Development Notes
This Strategy was developed with the PineScript language, version 5. This indicator, and most of the descriptions below, were derived largely from the TradingView reference manual. Feedback and suggestions for improvement are more than welcome, as well as recommended input settings and best practices to assist and guide new users effectively.
Features
The ByteBoost PRISM indicator is capable of analyzing multiple aspects of market behavior simultaneously such as:
Detection of potential trend reversals.
Assessment of trend strength and market sentiment.
Identification of stop loss levels.
Discovery of potential entry and exit points.
Ensuring compatibility and effectiveness with other indicators.
Visualization of strategy using historical data.
Customization options available.
Strategy Description
PRISM is an all in one strategy that allows the visualization of entry and exit points as well as the historical performance for every set of parameters. PRISM is a slow paced indicator recommended for the 1h timeframe, because it operates on the belief that markets move in a Brownian motion, for which it leaves enough space and time for the market to decide a trend and catch it at the right time as well as finding appropriate exits given the trend.
PRISM can exist in either an uptrend or downtrend state, but it does not necessarily imply that it reflects the true trend being observed. Instead, it emphasizes capturing significant movements and capitalizing on them by utilizing oscillator levels and exit points calculated based on oversold or overbought values, along with the volatility associated with these movements.
Usage
To use this strategy it is first needed to select a correct set of inputs that correspond to the market you are using, the extra, win difference and oscillator length are dependent on the current market and the average price it manages, so these inputs need to be modified for every pair of assets used.
The long and short tags signify the opportune moment to initiate a new position in the market, whether it's a long or short position, respectively. The exit tags indicate when these positions should be closed. If no exits occur before a new long or short position emerges, it is essential to conclude the existing position and commence a new one in the opposite direction.
Regarding exits, up to two exits can be executed for each movement. The user has the flexibility to determine how these exits are utilized. In the input section, a specific percentage of equity can be selected to be sold during the first exit. If set to 100%, only a single exit will be presented. Otherwise, the remaining equity will be sold during the second exit or at the next trend reversal depending on which action occurs first.
In case the user requires additional exits beyond the initial two, the alternative exits option can be activated in the inputs. This will provide access to supplementary exits, although they may be less advisable compared to the primary exits.
Inputs / Settings
Capital - If using any leverage multiply the amount of money to invest by the leverage, else input the amount to be invested in every trade.
Start date - The date from which the strategy should begin its analysis. Leave unchanged to start from the earliest available date based on your account's plan.
End date - The date until which the strategy should conduct its analysis. Leave unchanged to continue until the current date.
Extra - The minimum gain required in the market to trigger an exit opportunity. It can be a negative number to allow exits at a loss, potentially minimizing losses.
First exit % - If an exit is decided to be partial, it is very likely that there will be a second exit, this parameter determines the percentage of equity to be sold at the first exit. Note that a second exit may not always be applicable.
Win difference - The minimum difference between the entry point and the first exit to determine whether it should be a full exit or a partial exit, as the exit price approaches the entry price, the probability of a trend reversal increases, a full exit is beneficial.
Limit length - Specifies the number of candles to consider for the overbought and oversold market calculation.
Low limit - Sets the minimum value of the limit to decide a short exit.
High limit - Sets the maximum value of the limit to decide a long exit.
Band length - Determines the number of candles to consider for the volatility analysis.
Band height - Sets the multiplication factor of the band to set the maximum and minimum height.
Increment - Determines the rate at which trend reversals occur. A higher value brings the line closer to the current price faster.
Candles exit - Specifies the minimum number of candles required to pass for an exit to become available after initiating a new position.
Oscillator - Enables or disables the main oscillator, which helps determine entry points. Not all assets may benefit from this parameter.
Oscillator length - Specifies the number of candles considered for the entry points oscillator.
Highlighter - Applies a light color between the trend and average price of each bar.
Trend Labels - Displays labels indicating an uptrend or downtrend.
Signal Labels - View the labels indicating a new long or short position.
Exit Labels - Displays the labels indicating exit points.
Candle color - Color codes the inside of the candles with the current signal.
Cloud - Visualize the average price cloud to determine trend direction.
Oscillator points - Adds visual dots to indicate when the oscillator has changed its trend.
Oscillator line - Displays the values of the oscillator to indicate upcoming trend changes.
Alternative exits - Shows additional exits to the ones we recommend, useful if the user missed an exit or needs to have more than two.
Color uptrend - Determines the color scheme for identifying uptrend movements.
Color downtrend - Determines the color scheme for identifying downtrend movements.
Color long - Sets the color scheme for a new long position.
Color short - Sets the color scheme for a new short position.
Color exit - Decides the color scheme for the exit tag and cross shown.
Color alternative exit - Changes the color scheme for the alternative exit cross.
Color oscillator line - Determines the color scheme used for the oscillator line.
Indicator Visuals
The strategy plots the direction of the trend on the chart and changes its color based on this. It also plots shapes on the chart to denote potential buy (Long) and sell (Short) points, where the signals of short and long will appear as well as exit points which can be found as three different,
Exit 1 - A partial exit which sells the previously selected percentage of equity.
Exit 2 - A second exit that can only happen after an Exit 1 has happened, and sell the remaining amount of equity.
Exit Full - A full exit is executed when the price at the exit point is lower than the entry price plus the win difference value. This condition indicates that it is more advantageous to take a single exit rather than waiting for a second exit.
Strategy Alerts
The strategy does not include built-in alerts. However, alerts can be added using the TradingView interface based on the strategy's buy and sell conditions. This way you will be able to receive notifications on your computer or phone when a new signal goes out.
Details
Repainting: It is important to mention that the strategy can mark false long or short signals, as the oscillator is allowed to repaint on the same candle. So users must make sure the candle has closed on buy/sell conditions.
Excessive capital issue: If you configure the strategy with a big amount of capital (+$1,000,000 for example) it is possible that it will completely stop calculating exit signals, as they will be too big for TradingView’s engine to process.
Conclusion
The ByteBoost PRISM strategy empowers traders by providing comprehensive market analysis, clear entry and exit signals, and the ability to visualize strategy performance using historical data. It is a superior algorithm that maximizes profit potential and minimizes risks, making it the preferred choice for traders seeking a competitive edge in the financial markets.
Disclaimer
This strategy is provided as-is, with no guarantee of profits or responsibility for losses. Trading involves risk, and you should only trade with money you can afford to lose. Always conduct your own research and consider your financial situation before engaging in trading.

BTC 4h bot 2.0 StrategyThis is Strategy version of BTC 4h bot 2.0.
Optimized for pairs BTC vs stablecoins, 4h timeframe.
HOW IT WORKS:
Script is based on the fact that there are certain phases of the market when there is a greater probability that BTC will go to one side or the other. To evaluate which phase we are in, the script uses "Main trend" and "Confirmation signals".
Main trend
- Is composed of a combination of several supertrends and moving averages. A Supertrend is a trend following indicator that helps in identifying whether we are in an uptrend or a downtrend. A higher factor is used to capture the main trend and not just small movements. In case the market goes sideways, the Supertrend does not work well, so it is a combination of multiple supertrends along with moving averages to differentiate a real strong trend from a range.
- It can be seen on the graph as a thick solid line.
- In an uptrend is green, in a downtrend red, gray represents the neutral zone.
Confirmation signals
- Are several script-evaluated indicators such as RSI , MACD , ADX and others, which serve to confirm the trend. In this case, it is the opposite way to the Main trend. Confirmation signals are used here to detect small movements. They are trying to capture bullish and bearish price momentum.
- On the graph they are seen as dashed lines above or below the Main trend (in the gray zone they are in the middle).
- It indicates only two signals, green for buy and red for sell.
HOW TO USE IT:
if the Main trend and Confirmation signals are of the same color, it will send a buy or sell signal, depending on which phase of the trend it is in. If the Main trend is e.g. in an uptrend and the market is going up, Confirmation signals should generate a lot of signals. But if the market starts to go in the opposite direction, Confirmation signals should generate fewer signals or none at all, thus reducing the number of wrong trades. In the gray zone of the Main trend it does not open positions.
To close position is possible to use stop loss and take profit or alternative could be to set very high TP value, thereby letting the script close the positions by itself.
The default setting is:
TP: 3.9%
SL: 4.7%.
In this case, it is a strategy to find out how the script worked in the past period. The longest period in which it is possible to test BTCUSD is on the Bitstamp exchange. The script works consistently well over a long period of time, using past probabilities, but this does not guarantee future results.

TUE Argentum Algo V1This algorithm is designed to look trend for opening conditions, apply various filters including volume and volatility, then determine stop outs, break evens, and take profits.
The algorithm uses proprietary math based on the concepts of volatility, standard deviations, average true ranges, and volume to help determine trend. You can filter based on cumulative volume delta, volatility, and moving average based trend. It includes settings for either trend following or contrarian trades, and the ability to go long, short, or both.
The take profit areas are based on proprietary math that help find peaks and valleys. You can adjust the size of the take profits as a percentage of the position, change to static take profits (i.e. take profit in 16 ticks), or use both. You can also disable them and use the natural closing conditions of the trades (detection of trend change in the opposite direction).
Our algo works in any market and will allow user to adjust input settings to be used on any ticker they'd like. It is built as a strategy so you can back test on any ticker to find the exact right settings to dial it in and then switch to live trading mode to see signals. Can be used for day trades or swing trades.
Automated Trading
This algo has been tested and certified to work for automated trading.
Works on Forex
It's confirmed to work on forex so you can trade that market.
Gets you into long successful trades, and gets out of poor ones quickly
It keeps you in the long trades taking small profits along the way, but cuts losers quickly in comparison. This style leads to a high profit factor.
It looks at many variables so you don't have to
- Uses trend analysis for opening/closing conditions.
- It measures the strength of trends to help determine if it should enter or not.
- It uses volume, if the user wants, to help filter entries. The volume calculation is based off of my proprietary cumulative volume delta indicator and helps find if the volume is moving long or short.
- It uses proprietary take profit math to help find peaks and valleys to peel off profits. It is based on the changes in momentum of the underlying.
- It allows for stop outs and break evens based on volatility so they'll always adjust with the movement of the underlying ticker (see the blue lines above and below the opening in the chart).
- It allows for offset break evens to keep a portion of the profit.
Strategy for the Algo
Included so you can understand how to trade with it.
ONE: After loading this strategy onto a ticker turn off volume if it's a ticker with no volume , set the dates at the bottom to when the stock is active (you want to start backtesting when a stock started trading like it trades currently).
TWO: From there adjust the short term trend settings to find the highest win rate and profit factor.
THREE: Then adjust the volume length to find the highest win rate and profit factor. It's important while doing these that you pay attention to a smooth upward equity curve.
FOUR: After this has been done now adjust the long and short risk multipliers. This determines your stop out.
FIVE: Then adjust breakeven multipliers - this is the level at which it changes to a breakeven stop out instead of the previous one. You can also set an offset to keep a small part of the profit.
SIX: Finally adjust the take profit sizes.
SEVEN: Once this is all done go back through the list and adjust up and down by one or two clicks and see if a better curve can be obtained. Very frequently long and short trades have different settings.
EIGHT: When you are finished save the settings in a custom indicator template and put it with it's own chart.
Additional
The settings shown on screen are not the default settings, but are settings chosen for this ticker and timeframe based on the process above. Nearly every ticker and timeframe will require adjustment from default, that's why the algorithm is built to be highly flexible. It can fit any ticker and timeframe, as well as market environment.
This particular setup has the algo running a scalping program on ES 3 min with a 16 tick static target. This algorithm can be set up as a scalper, or used to day trade more regularly. It can also swing trade.
As shown here the algo includes $1.25 of commissions and 1 tick of slippage on all orders (about our average for automated trading on ES).

The Flower - Multiple Strategy Options in OneStrategy Overview
This strategy code currently includes four separate strategies to be used to either aid in discretionary trading or to be used algorithmically through the third-party system Profitview (profitview.app). Support for Pineconnector for use with MetaTrader 4 is in the works. The strategies have been designed with cryptocurrency trading in mind, however, the fundamentals apply to other assets.
The four strategies currently included are labeled “TSI Cross” (the default setting), “Oscillator Bands”, “Scalping”, and “McG/MA Cross”. Detailed information for each independent strategy can be found below, including sample settings configurations for each. A dropdown menu to select the strategy can be found under the “Strategy Options” set of settings under the Input tab of the strategy settings menu.
Additionally, the option to receive only long or short signals can be found alongside the Strategy Choice menu.
Take profit, stop loss, and trailing percentages are also included, found at the bottom of the Input tab under “TT and TTP” as well as “Stop Loss”. Make sure to understand the TP/SL ratio that you desire before use, as the desired hit rate/profitability percentage will be affected accordingly.
The only visuals associated with the strategy are two McGinley Dynamic lines, red (slow length) and green (fast length). These are relevant to the McGinley Cross strategy, but can be used alongside the other strategies if desired.
When viewing the backtesting data in the TradingView Strategy Tester, ensure that “use bar magnifier” is activated. This option can be found in the Properties tab of the strategy settings menu.
Profitview Settings
If you wish to utilize Profitview’s automation system, find the included “Profitview Settings” under the Input tab of the strategy settings menu. If not, skip this section entirely as it can be left blank. Options will be “OPEN LONG TITLE”, “OPEN SHORT TITLE”, “CLOSE LONG TITLE”, and “CLOSE SHORT TITLE”. If you wished to trade SOL, for example, you would put “SOL LONG”, “SOL SHORT”, “SOL CLOSE LONG”, and “SOL CLOSE SHORT” in these areas. Within your Profitview extension, ensure that your Alerts all match these titles. A sample of our Profitview syntax can be found below.
To set an alert for use with Profitview, go to the “Alerts” tab in TradingView, then create an alert. Make sure that your desired asset and timeframe are currently displayed on your screen when creating the alert. Under the “Condition” option of the alert, select the strategy, then select the expiration time. If using TradingView Premium, this can be open-ended. Otherwise, select your desired expiration time and date. This can be updated whenever desired to ensure the strategy does not expire. Under “Alert actions”, nothing necessarily needs to be selected unless so desired. Leave the “Alert name” option empty. For the “Message”, delete the generated message and replace it with {{strategy.order.alert_message}} and nothing else.
Strategy Choices
As mentioned above, this strategy code contains four separate strategy options. A detailed breakdown of each follows below:
Total Strength Index (TSI) Cross
This strategy option is the default choice. The main signal involved in this strategy is a crossover or crossunder of the TSI value line and TSI signal line, however, there are a few other signals involved in the creation of a long or short entry. In addition to the TSI, the strategy includes an Average Directional Index (ADX) threshold value, Jurik Volatility Bands (JVB), a Stoch RSI threshold, and an oscillator of choice in conjunction with a threshold of 0. This oscillator choice can be selected under the “Signal Options” menu in the Input tab of the strategy settings. The default oscillator is the Detrended Price Oscillator (DPO), though the option for Chande Momentum (CMO) or Rate of Change (RoC) are both viable for this strategy.
Individual settings for these can be found in the Input tab under “Oscillator Settings” (TSI, Stoch RSI, DPO, CMO, ROC), “Band/Channel Settings” (Jurik Volatility Bands Length/Smoothing), and “Directional Settings” (ADX Smoothing Long, DI Length Short, ADX Threshold).
Sample settings for SOLUSDT using the 20M timeframe:
- Oscillator Settings -- DPO Length (21), DPO *not* centered, RSI (Stoch) Length (4), Stochastic Length (4), TSI Long Length (25), TSI Short Length (13), TSI Signal Length (13), K (3), D (3)
- Band/Channel Settings -- Jurik Volatility Bands Length (25), Jurik Volatility Bands Smoothing (5)
- Directional Settings – JVB Price Threshold (0), ADX Smoothing Long (5), DI Length Short (5), ADX Threshold (23)
- Take Profit/Stop Loss – 0.85% TP, 0.005% TTP, 1.3% SL
Oscillator Bands
This strategy involves the usage of bands or channels that use oscillators as a source input. The main signal for this strategy derives from a cross of the band or channel and a hline of 0. Additionally, this includes a “Directional Filter” and a “MA Filter”. The selections for all of these can be found in the “Signal Options” section of the Input tab.
First option is for Oscillator Choice and includes DPO, CMO, ROC, RSI, TSI, and the Jurik price line. The individual settings for these can be found in the “Oscillator Settings” section. Different channels can be selected for the upper or lower bands, though it is not necessary for them to differ. These current options include Bollinger Bands and Jurik Volatility Bands, the individual settings for each found in the “Band/Channel Settings” section. Next is the MA Filter, of which you can select SMA, EMA, SMMA, WMA, VWMA, KAMA, JMA, or McGinley Dynamic. All options for these settings can be found in the “MA Filter Settings” section. Lastly, the Directional Filters can be selected for either direction like the upper/lower band selection. These filters include the ADX, Bull-Bear Power (BBP), Parabolic SAR (PSAR), or Jurik.
Sample settings for WAVESUSDT using the 20M timeframe:
- Oscillator Choice – DPO (Length – 30, uncentered)
- Upper and Lower Band – JVB Upper/Lower (Jurik Volatility Bands Length – 25; Smoothing – 10)
- MA Filter – VWMA – (MA Length – 40; Source – Open)
- Directional Filter – ADX (ADX Smoothing Long – 14; DI Length Short – 5; ADX Threshold – 22)
- Take Profit/Stop Loss – 0.85% TP, 0.005% TTP, 1.3% SL
Scalping
This strategy heavily relies on the usage of Parabolic SAR, accompanied by a “Directional Filter” (as discussed in the previous section) other than PSAR. This strategy can provide a higher frequency of trades as opposed to the other strategies available, however, it comes with slightly higher risk inherently. A riskier take profit/stop loss spread is recommended here, though risk should always be managed. The settings required for this strategy are all found under the “Directional Settings” section of the strategy inputs.
Sample settings for NEARUSDT using the 20M timeframe:
- Directional Filter set to ADX
- Directional Settings – ADX Smoothing Long (5), DI Length Short (5), ADX Threshold (22), PSAR Start Value (0.02), PSAR Increment (0.005), PSAR Max Value (0.15), PSAR Source (Close)
- Take Profit/Stop Loss – 0.75% TP, 0.005% TTP, 1.5% SL
McGinley Cross
This strategy revolves around the crossing of two McGinley Dynamic lines of varying lengths alongside an ADX filter as well as a DPO filter. McGinley is used as opposed to a standard moving average cross strategy as it adjusts for shifts in market speed and can better gauge market trends. The McGinley length settings can be found with the “MA Filter” settings, labeled as Fast Length and Slow Length. The fast length number should be smaller than the slow length.
Sample settings for SOLUSDT using the 20M timeframe:
- Oscillator Settings – DPO Length (30), uncentered
- MA Filter Settings – McGinley Fast Length (4), McGinley Slow Length (21)
- Take Profit/Stop Loss – 0.85% TP, 0.005% TTP, 1.4% SL
Comprehensive Settings List
Date and Time: From date and to date, adjustable for backtesting purposes.
Signal Options:
Oscillator Choices: Chande Momentum Oscillator (CMO), Detrended Price Oscillator (DPO), Rate of Change (ROC), Relative Strength Index (RSI), True Strength Index (TSI), Jurik Volatility Bands Priceline (JVB) – *** for use with TSI Cross or Oscillator Bands strategies only ***
Upper and Lower Band/Channel Choices: Bollinger Bands (BB) or Jurik Volatility Bands (JVB) -- *** for use with Oscillator Bands strategy only ***
MA/McG Filter: SMA, EMA, RMA, WMA, VWMA, Kaufmann MA, Jurik MA, McGinley Dynamic -- *** for use with Oscillator Bands strategy only ***
Directional Filter Long/Short: Average Directional Index (ADX), Bull/Bear Power (BBP), Parabolic SAR (PSAR), Jurik -- *** for use with Oscillator Bands strategy only ***
Profitview Settings: *** For use with ProfitView extension only, otherwise ignore ***
Oscillator Settings: *** For use with TSI Cross, Oscillator Bands, and McGinley Cross strategies ***
CMO Length, CMO Source – for Chande Momentum Oscillator
DPO Length, DPO Centered – for Detrended Price Oscillator
RoC Length, RoC Source – for Rate of Change
RSI Length, RSI MA Length – for Relative Strength Index
RSI (Stoch) Length, Stochastic Length, Stoch RSI Source, K, D – for Stochastic RSI
TSI Long Length, TSI Short Length, TSI Signal Length – for True Strength Index
Band/Channel Settings: *** For use with Oscillator Bands strategy ***
Jurik Volatility Bands Length, Jurik Volatility Bands Smoothing – for Jurik Volatility Bands
Bollinger Band Length, Bollinger Band Multiplier – for Bollinger Bands
Directional Settings: *** For use with Scalping and Oscillator Bands strategies ***
JVB Price Threshold – for Jurik Volatility as a directional setting
ADX Smoothing Long, DI Length Short, ADX Threshold – for Average Directional Index
PSAR Start Value, PSAR Increment, PSAR Max Value, PSAR Source – for Parabolic SAR
MA Filter Settings: *** For use with Oscillator Bands and McGinley Cross strategies ***
McGinley Fast/Slow Length – for McGinley Dynamic
MA Length, MA Source, MA Offset – for any other moving average
TP and TTP / Stop Loss: *** For use with ALL strategies ***
Long/Short Take Profit % -- for standard take profit settings
Enable Trailing, Trailing Take Profit % -- for trailing settings
Stop Loss % -- for standard stop loss settings; trailing can be enabled or disabled for stop loss
Disclaimers:
Some open-source code has been included -- Jurik Volatility Bands (by "ProValueTrader") and Trailing Take Profit/Stop Loss code (by jason5480). Additional code was used from the TradingView built-ins.
These strategies do NOT guarantee future returns. Apply caution in trading regardless of discretionary or algorithmic. Understand the concepts of risk/reward and the intricacies of each strategy choice before utilizing them in your personal trading.
Invites to the strategy will only be disseminated to those with express consent and knowledge of the invite prior to the action itself.

MTF Supertrend [Trading Nerd]Trend Trading Strategy using Supertrends
Backtesting Script that uses a multitimeframeanalysis of the Supertrend Indicator. The trend direction is determind by a higher Timeframe (TF) Supertrend. The entry Signals are given by the Supertrend of the current TF. The script is NOT repainting (the script takes the previous value of the higher TF Supertrend, if the higher TF candle is not confirmed yet).
Strategy Conditions
Longs:
The higher TF Supertrend has to be green
The current TF Supertrend change from red to green
Shorts:
The higher TF Supertrend has to be red
The current TF Supertrend change from green to red
Optional:
Option: If enabled also a trend chage of the higher TF Supertrend is a valid Entry Signal
If enabled Signals are discarded if the ADX is below the value
Take Profit
On default there is no Take Profit. You can activate a Risk Reward Based Take Profit target trough the option. Also a Partial Take Profit is possible.
Stop Loss
The default Stop Loss Strategy is a Trailing Stoploss. As trailing Price the current TF Supertrend is used.
Additional
Time Filter: Only opens trade in the defined Session. Open trades are still being closed outside of the Session.
Start Date/End Date: Limits the backtest for the defined Date Range
Trading Days: Only open Trades on the checked Days
Risk % per Trade: If enabled the Strategy uses X% of the capital (defined in Settings -> Properties -> Initial Capital)
Use Compound Interest: If enabled Capital is recalculated for every trade (initial capital + net Profit)
IMPORTANT: For low Timeframes and Markets with tight SL (like Forex) it requires a lower Margin Percent than default. Go to Settings->Properties and lower the required Long/Short Margin. Otherwise Trades might not be considered because of too less capital/marign. Margins can e.g. set to: 2% (Forex), 10% (Stocks), 20% (Crypto).

LudovicaLudovica is a trend following strategy that works on intraday timeframes (15 minutes).
The stop loss is decided based on the last price movement, take profits are projected through a Fibonacci extension. Two different extensions are calculated, based on a filter that affects the last price movement it is chosen which one to use for take profits.
Money management is fixed fractional: regardless of the distance between entry point and stop loss, the risk on capital for each trade is decided by the user in the strategy inputs. Take profits from 1 to 4 plan to exit with 15% of the initial size, TPs from 5 to 8 plan to exit with 10% of initial size.
There is a trailing stop system to reduce the drawdown of the strategy (note that stop loss moves as the trade develops).
Take profits are limit orders, stops (loss or trailing) occur at candlestick close (set alerts on the strategy).
Optimized strategies selectable from input panel:
-ETHUSDTPERP 15 min
-CRVUSDTPERP 15 min v1
-CRVUSDTPERP 15 min v2
-SNXUSDTPERP 15 min
Other pairs in development and soon available.
This strategy is in beta stage.
