Trend Following BreakoutEasy Trend Following Strategy using Highs and Lows breakout of the last X candles to enter and exit trades.
You can easily change the ENTRY and EXIT value in order to find the best settings.
This strategy seems to be working well for $BTC and $ETH on the 4H and 1D.
I didn't play with it too much as I am testing script to trade on the 15 minutes chart with margin. This script can't do this successfully but I hope it can be helpful for what you want to achieve.
Cerca negli script per "trend"

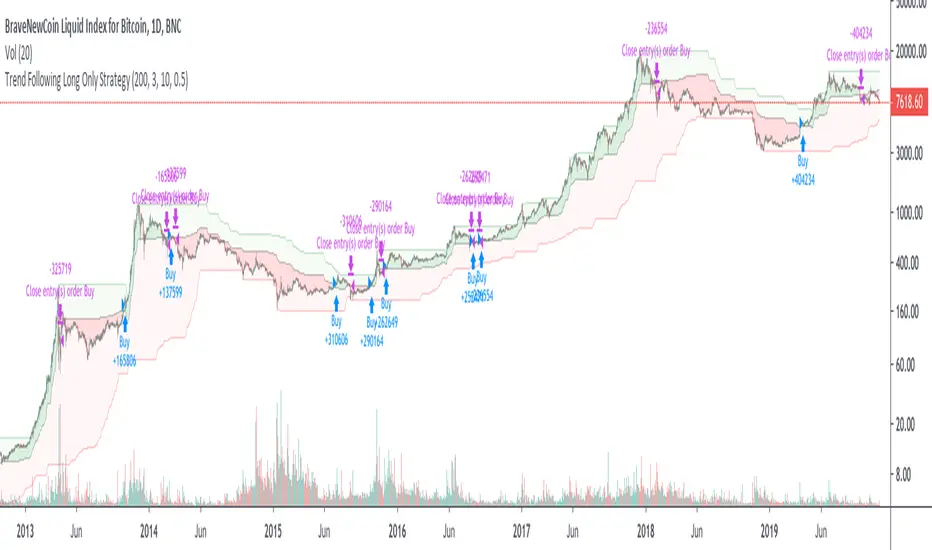
Trend Following Long Only StrategyThis script tries to ride bull trends and stay out of the market in bear trends.
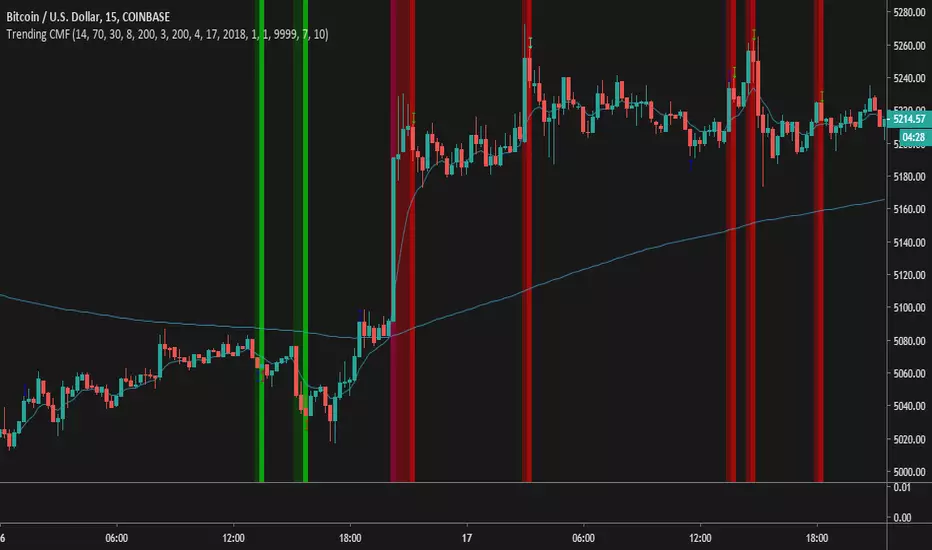
Trend Analysis Index Backtest In essence, it is simply the standard deviation of the last x bars of a
y-bar moving average. Thus, the TAI is a simple trend indicator when prices
trend with authority, the slope of the moving average increases, and when
prices meander in a trendless range, the slope of the moving average decreases.
You can change long to short in the Input Settings
WARNING:
- For purpose educate only
- This script to change bars colors.
Trend Following S/R Fibonacci StrategyTrend Following S/R Fibonacci Strategy
Trend Following S/R Fibonacci Strategy

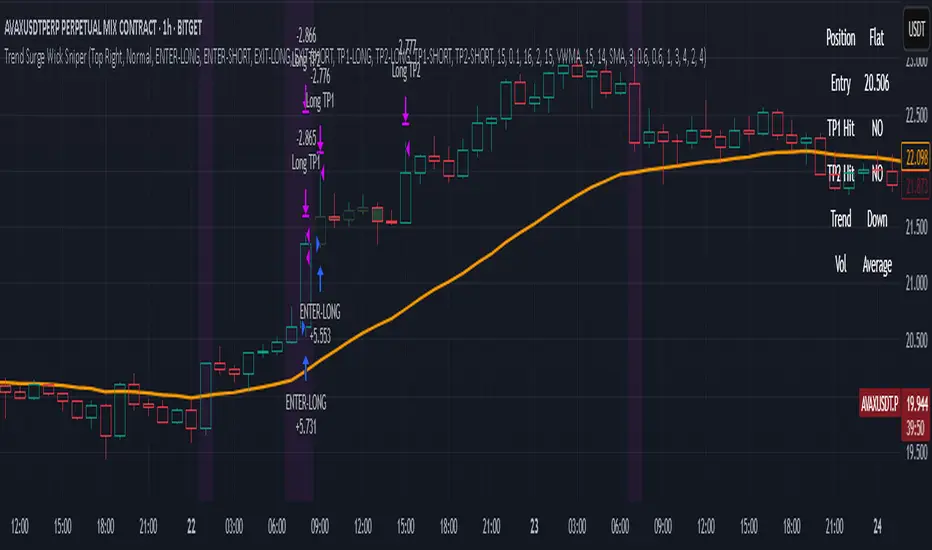
Trend Surge Wick SniperTrend Surge Wick Sniper | Non-Repainting Trend + Momentum Strategy with TP1/TP2 & Dashboard
Trend Surge Wick Sniper is a complete crypto trading strategy designed for high-precision entries, smart exits, and non-repainting execution. It combines trend slope, wick rejection, volume confirmation, and CCI momentum filters into a seamless system that works in real-time conditions — whether you're manual trading or sending alerts to multi-exchange bots.
🧩 System Architecture Overview
This is not just a mashup of indicators — each layer is tightly integrated to filter for confirmed, high-quality setups. Here’s a detailed breakdown:
📈 Trend Logic
1. McGinley Dynamic Baseline
A responsive moving average that adapts to market speed better than EMA or SMA.
Smooths price while staying close to real action, making it ideal for basing alignment or trend context.
2. Gradient Slope Filter (ATR-normalized)
Calculates the difference between current and past McGinley values, divided by ATR for normalization.
If the slope exceeds a configurable threshold, it confirms an active uptrend or downtrend.
Optional loosened sensitivity allows for more frequent but still valid trades.
🚀 Momentum Timing
3. Smoothed CCI (ZLEMA / Hull / VWMA options)
Traditional CCI is enhanced with smoothing for stability.
Signals trades only when momentum is strong and accelerating.
Optional settings let users tune how responsive or smooth they want the CCI behavior to be.
🔒 Entry Filtering & Rejection Logic
4. Wick Trap Detection
Prevents entry during manipulated candles (e.g. stop hunts, wick traps).
Measures wick-to-body ratio against a minimum body size normalized by ATR.
Only trades when the candle shows a clean body and no manipulation.
5. Price Action Filters (Optional)
Long trades require price to break above previous high (or skip this with a toggle).
Short trades require price to break below previous low (or skip this with a toggle).
Ensures you're trading only when price structure confirms the breakout.
6. McGinley Alignment (Optional)
Price must be on the correct side of the McGinley line (above for longs, below for shorts).
Ensures that trades align with baseline trend, preventing early or fading entries.
📊 Volume Logic
7. Volume Spike Detection
Confirms that a real move is underway by requiring volume to exceed a moving average by a user-defined multiplier.
Uses SMA / EMA / VWMA for customizable behavior.
Optional relative volume mode compares volume against typical volume at that same time of day.
8. Volume Trend Filter
Compares fast vs. slow EMA of the volume spike ratio.
Ensures volume is not just spiking, but also increasing overall.
Prevents trades during volume exhaustion or fading participation.
9. Volume Strength Label
Classifies each bar’s volume as: Low, Average, High, or Very High
Shown in the dashboard for context before entries.
🎯 Entry Conditions
An entry occurs when all of the following align:
✅ Trend confirmed via gradient slope
✅ Momentum confirmed via smoothed CCI
✅ No wick trap pattern
✅ Price structure & McGinley alignment (if toggled on)
✅ Volume confirms participation
✅ 1-bar cooldown since last exit
💰 TP1 & TP2 Exit System
TP1 = 50% of position closed using a limit order at a % profit (e.g., 2%)
TP2 = remaining 50% closed at a second profit level (e.g., 4%)
These are set as limit orders at the time of entry and work even on backtest.
Alerts are sent separately for TP1 and TP2 to allow bot handling of staggered exits.
🧠 Trade Logic Controls
✅ process_orders_on_close=true ensures non-repainting behavior
✅ 1-bar cooldown after any exit prevents same-bar reversals
✅ Built-in canEnter condition ensures trades are separated and clean
✅ Alerts use customizable strings for entry/exit/TP1/TP2 — ready for webhook automation
📊 Real-Time On-Chart Dashboard
Toggleable, movable dashboard shows live trading stats:
🔵 Current Position: Long / Short / Flat
🎯 Entry Price
✅ TP1 / TP2 Hit Status
📈 Trend Direction: Up / Down / Flat
🔊 Volume Strength: Low / Average / High / Very High
🎛 Size and corner are adjustable via input settings
⚠️ Designed For:
1H / 4H Crypto Trading
Manual Traders & Webhook-Connected Bots
Scalability across volatile market conditions
Full TradingView backtest compatibility (no repainting / no fake signals)
📌 Notes
You can switch CCI smoothing type, volume MA type, and other filters via the settings panel.
Default TP1/TP2 levels are set to 2% and 4%, but fully customizable.
🛡 Disclaimer
This script is for educational purposes only and not financial advice. Use with backtesting and risk management before live deployment.
Trend Identifier StrategyTrend Identifier Strategy for 1D BTC.USD
The indicator smoothens a closely following moving average into a polynomial like plot and assumes 4 staged cycles based on the first and the second derivatives. This is an optimized strategy for long term buying and selling with a Sortino Ratio above 3. It is designed to be a more profitable alternative to HODLing. It can be combined with 'Accumulation/Distribution Bands & Signals' and 'Exponential Top and Bottom Finder'.

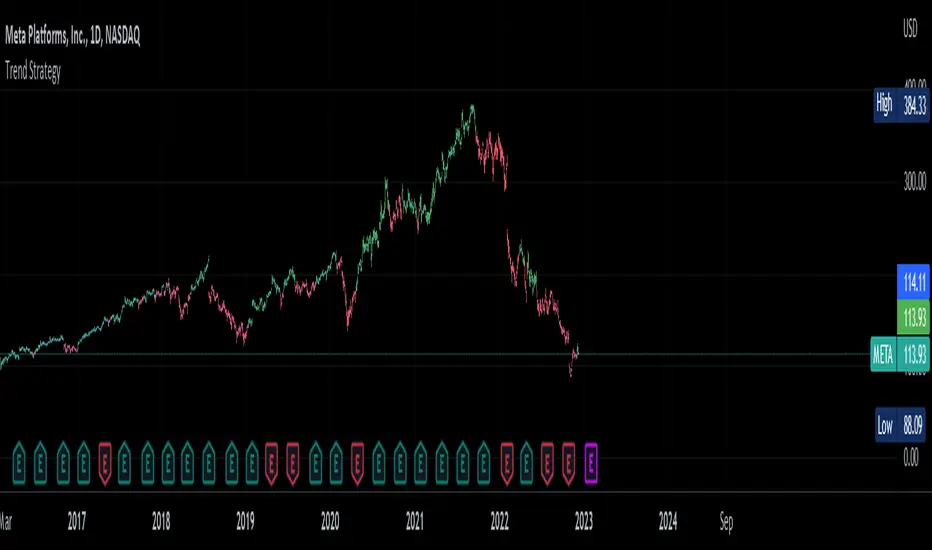
Trend Strategy by zdmreThis Strategy is a trend following indicator. It is plotted on price and the current trend can be determined by its placement vis-a-vis price. It is constructed with just three parameters: Period, Multiplier and Entry/Exit Point with Superformula.
The default parameters are 14 for Average True Range (ATR) and 4 for its multiplier. The average true range (ATR) plays a key role in ‘Trend’ as the indicator uses ATR to compute its value and it signals the degree of price volatility. You should note that any changes to these numbers can affect the use of the Trend indicator.
While you using this indicator, you should not avoid putting your stop loss.
For a long position, you can put stop loss right at the red indicator line. For a short position, you can put it at the green indicator line. You can insert your own settings as well.
Using Trend Strategy along with a stop loss pattern is the best way for earning the best wealth in trading.
There is no best setting for any trading indicator.
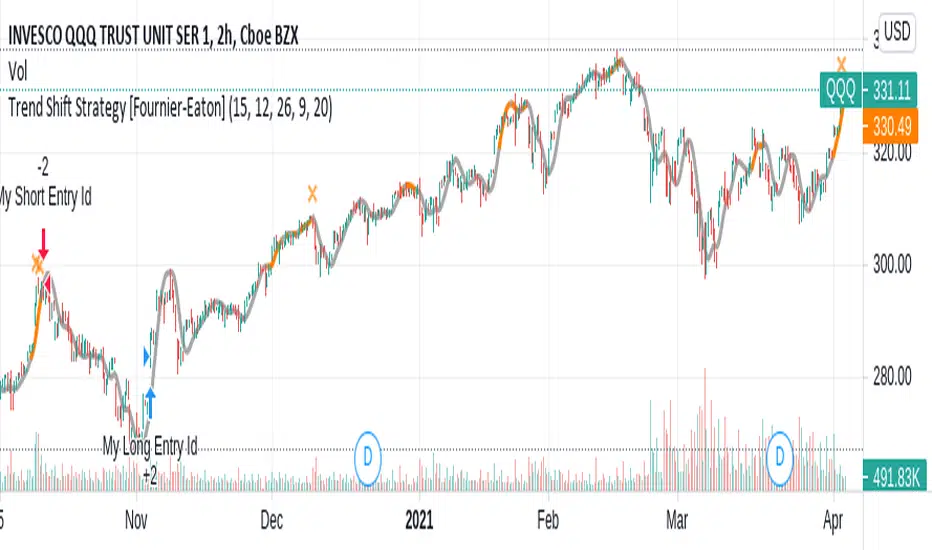
Trend Shift Strategy [Fournier-Eaton]This is a version 0.1 of a revamped Trend Shift Indicator (strategy version).
There are three main components:
A moving average with color to indicate caution (for those trading short-term)
A series of cross indications above bar to indicate further warning (for those trading mid-term)
Longer term buy and sells informing the trades of the indicator itself. (for those trading longer term)
I'd like some suggestions on how to improve this script, please make them in the comments. I do hope this is useful.
Also please see the indicator version of this:
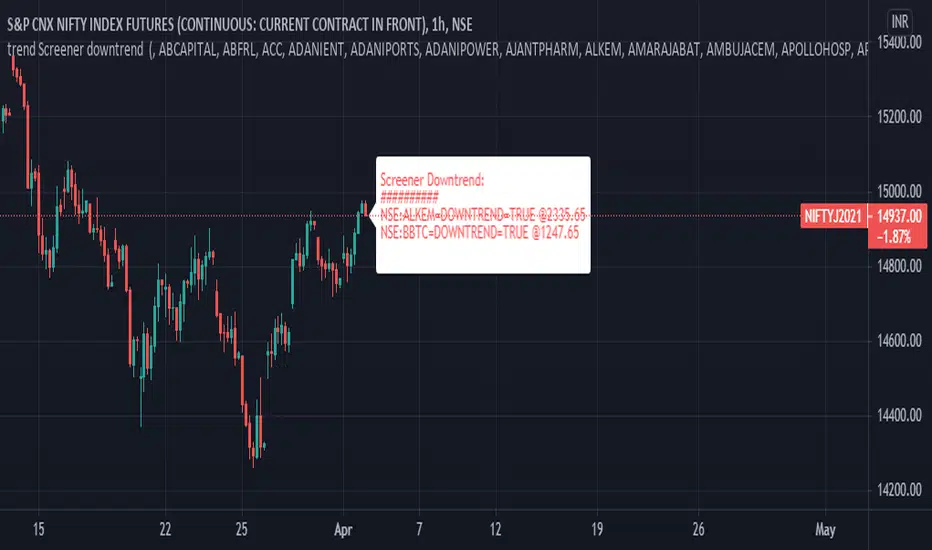
trend Screener downtrendthis is in continuation with - previous trend screener i have published, In this code only downtrend screener is there ,This is type of custom screener I searched and made to screen bulk stocks any one can modify it, other may get help out of it.
you can change or add new symbol in input section.
in my code i have made defined and printed last close price when downtrend was true.
1. downtrend = ema (close,55)< ema (close,144) and ema (close,144)< ema (close,388) and ema (close,388)<ema(close,576) and close<ema(close,388)
if the indicator is printing DOWNTREND=TRUE or UPTREND=TRUE then the corresponding stock is in currently in that trend out of the stocks listed in the code
in one code only 40 (max) stocks can be called.
to add more stocks I copied same code and changed the stocks in the code, now you can screen 80 stocks at a time.
This code runs on each bar and checks if the stocks is in uptrend or down trend.
you can customize this screener according to your requirement.
trend Screener List1This is type of custom screener I searched and made to screen bulk stocks any one can modify it, other may get help out of it.
in my code i have made defined
1. uptrend= ema(close,55)> ema(close,144) and ema(close,144)> ema(close,388) and ema(close,388)> ema(close,576) and close>ema(close,388)
2. downtrend = ema(close,55)< ema(close,144) and ema(close,144)< ema(close,388) and ema(close,388)

Trend Indicator with BUY SELL signalsThe Script can be used to identify the main trend and take BUY/SELL decisions in the lower time frames.
The tool can be applied as follows
1) Apply the tool your favorite chart
2) Select the main trend.
3) Go to lower time frames to check the BUY/SELL signals. Example: If the selected main trend is 4 hrs then go to time frames below 4 hrs to find the entry and exit positions.
Feel free to reach out to me if you need any further information

Trend TradingThe strategy has two scripts coded in it. It uses $10,000 capital, 1 Share is the default quantity, commission of 0.0018.
As you can notice in the AMD chart,
The coded script can do four actions because there are two scripts together.
First script:
A-Buy on red bars
B-sell on green candles.
Second script:
A-buy on red background
B-sell on green background
(This is just to show you the statistics of both scripts).
The way my strategy works is there are multiple weights to gains from certain highs and lows using Fibonacci ratios.
The reason I combined both is I need to know what the trend is to avoid trading against it.
The background color tells me what the trend it.
The bar colors are for entries.
How I filter the signals:
When the background is red, then a down trend. However, my entry would be on green bars.
When the background is green, an uptrend, However, my entry would be on red bars.
The strategy can be used for multiple time frames, please test profitability rate and trade based on your judgment. The indicator is not perfect, and Your skills are important in the decision making. Do not depend solely on the indicator.
Other signals,
1-After a wide green background(uptrend). You could see one a red that could be an entry instead of a downtrend and vice versa.
2-In a wide red background, you could see green bars eventually that could be an overbought condition for a rally and vice versa.
The indicator can help you but will not trade for you. I suggest that you follow the certain conditions I have mentioned (How filter the signals).
If you are interested, please send me private message.

Trend trader StrategyFirst I would like to thank to @JustUncleL since this strategy started from one of his scalper strategies
This strategy can be adapted to all time charts .
First it has the session where we want to trade, for this example I choosed the EURUSD so I only take in consideration london/neywork session.
Its made from 3 EMA :
normal
slow
ultra slow
It has has the capacity to use HA candles into consideration if its needed.
At the same time we have a price channel made from faster MAs, that act like a bollinger band .
Together with all of them, we establish which trend we have if its uptrend or downtrend
Then we check the candles if they are below or above the MA , and based on the condition if they crossed recently we can suggest if its a buy or a long condition
At the same time we have 2 options of stop conditions:
Through a trailing stop made from ATR or % based
And second, a SL/TP made from pip points or % based.
For this example I used % based.
Let me know what you think about it, and if you found some nice settings for it. So far I only adapted to EURUSD 1 min time.

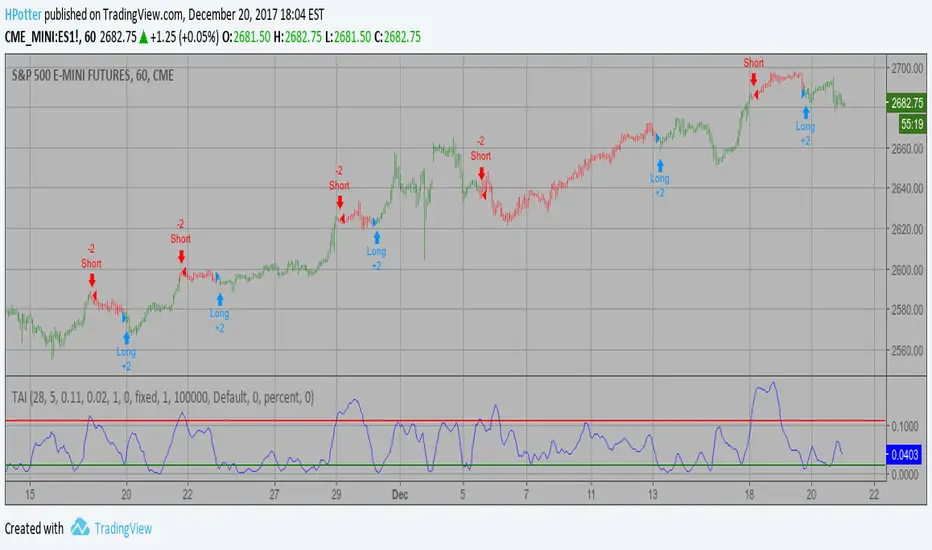
Trend Trader Strategy with MACDThis is plots the indicator developed by Andrew Abraham in the Trading the Trend article of TASC September 1998
The strategy I use has already been published explicitly by HPotter, you can review the core code from there.
I have converted the existing strategy codes that have been published into the strategy and the result looks great but I noticed that the indicator performed too much in short periods like 1 minute and I thought it would be healthier to get MACD approval. MACD approval will come selected by default. When the indicator reaches the buy status, if the macd histogram is positive, it enters the long process. By removing this confirmation from the settings window, you can see the normal signal frequency of the indicator.
This strategy is mainly based on trend signals. In fact, I am publishing this strategy to use in alternating trading for Bear-Bull crypto coins.
What does the bear-bull comparison mean?
You can open the same chart in the ETHBEAR / USDT symbol as opposed to the ETHBULL / USDT symbol that appears on the chart. When BUY signal comes in bull symbol, SELL will come in bear symbol. When BUY signal comes in bear symbol, SELL will come in bull symbol. In this way, very fast and very high profit can be obtained by alternating operation.

Trend StrategyThis is plots the indicator developed by Andrew Abraham in the Trading the Trend article of TASC September 1998
The strategy I use has already been published explicitly by HPotter, you can review the core code from there.
I have converted the existing strategy codes that have been published into the strategy and the result looks great.
This strategy is mainly based on trend signals. In fact, I am publishing this strategy to use in alternating trading for Bear-Bull crypto coins.
What does the bear-bull comparison mean?
You can open the same chart in the ETHBEAR / USDT symbol as opposed to the ETHBULL / USDT symbol that appears on the chart. When BUY signal comes in bull symbol, SELL will come in bear symbol. When BUY signal comes in bear symbol, SELL will come in bull symbol. In this way, very fast and very high profit can be obtained by alternating operation.

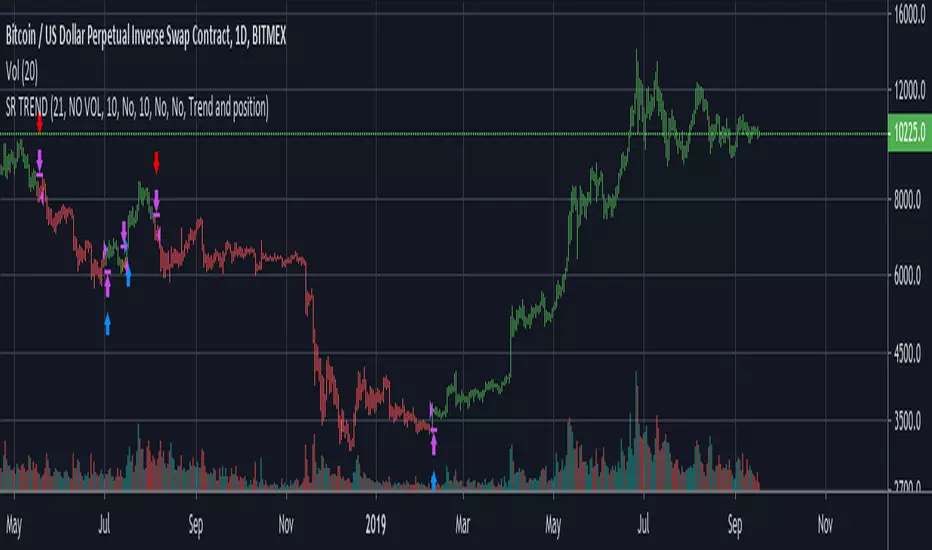
Trend SR based strategyIt is a logical continuation of my Trend SR based indicator
Algo of strategy is next
1)Detect SR levels
2)Calculate separate channels for SR made by highs and lows
3)it takes position if the current SR is breaking and close price is not in opposite channel zone
4)It closes position if prise leave current channel zone or as an option (stoploss) if SR is breaking in an opposite direction
-uses //@version=4
-no volume needed for detecting SR breaking and entering a long position
-volume confirmation of SR breaking may be used in the option section
-volume has an option to use smoothing with MA: SMA, AHMA, VIDYA
-volume has option to use volume pump as confirmation of SR breaking (simple dev function)
-stoploss as option
-uses barstate.isconfirmed (returns true if the script is calculating the last (closing) update of the current bar) for entering position on current bar close
-as an option, all or only current SR levels detected by algo can be plotted
-option to plot SR as a channel - as FILTERED whole SR history, in a long or short position it plots only stoploss level and entering opposite position level, in no position it plots long and short entering levels
It works well on 1D
For using on 4h or lower timeframes - Volume confirmation with VIDYA or AHMA may give better results
For better work especially on LTF algo needs better detection of highs and lows, now it uses fractal filter of last bars

trend analysisdaily trade call on the basis of trend analysis
this is a beta version hence use at ur own risk

trend show strategy(lirshah)this strategy has been created according to trend show(lirshah) indicator.
simplicity, sensitivity to trend change and the lowest repainting has made this strategy unique.
it has good results on almost all markets and is one of the best for manual trading.

Trend Trader Bands Backtest This is plots the indicator developed by Andrew Abraham
in the Trading the Trend article of TASC September 1998
It was modified, result values wass averages.
And draw two bands above and below TT line.

Trend Trader AVR Backtest This is plots the indicator developed by Andrew Abraham
in the Trading the Trend article of TASC September 1998
It was modified, result values wass averages.
