Vandan V2Vandan V2 is an automated trend-following strategy for NASDAQ E-mini Futures (NQ1!).
It uses multi-timeframe momentum and volatility filters to identify high-probability entries.
Includes dynamic risk management and trailing logic optimized for intraday trading.
Cerca negli script per "trend"

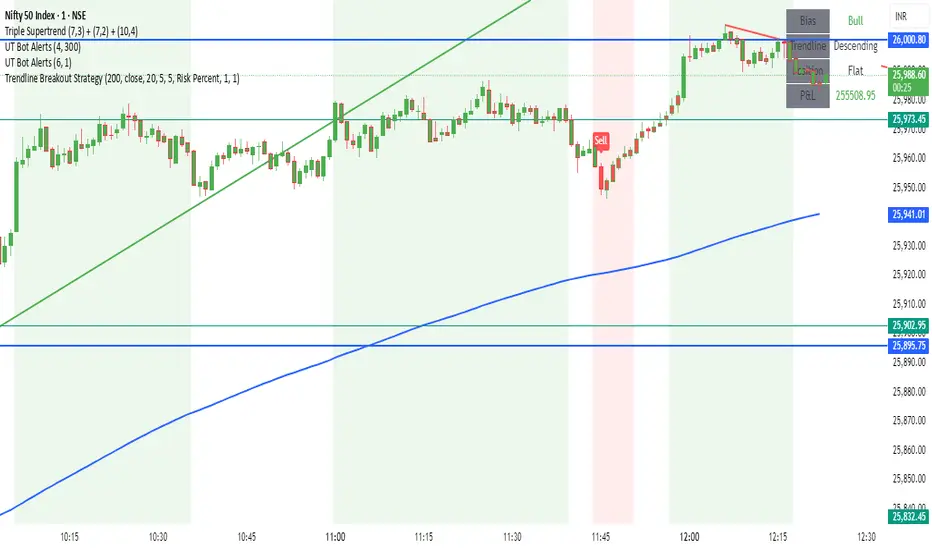
Trendline Breakout Strategy Strategy should place entries & exits so that it can be backtested (use strategy.entry and strategy.exit with explicit stop and limit prices). Include an option for fixed percent position sizing and an option for fixed contract size. Draw the trendline on the chart (with option to hide/show) and add labels that show: bias (Bull/Bear), trendline slope, entry price, SL, TP and the reason (e.g., "Trendline Breakout"). Provide user inputs for: EMA length (default 200), lookback for pivot detection, pivot sensitivity (left/right bars), quantity mode (percent / contracts), risk percent or fixed size, enable/disable backtest prints, and enable alerts. Avoid repainting: use confirmed pivot logic (pivot detection must use completed bars) and only take entry after breakout confirmed on close. Document any limitations (for example, trendline using two highest/highest bars inside lookback is approximate). Add clear comments, helpful variable names, and include example alertcondition lines for entry and exit signals.
Momentum/Breakout Strategy A professional-grade trend–momentum hybrid strategy designed for high–timeframe precision and long-term consistency.
It combines exponential moving averages (EMA 20/50) to define directional bias, RSI and MACD to confirm momentum strength, and a manually coded ADX filter to validate market trend quality.
ATR-based stop placement and trailing mechanisms control downside volatility, while an optional daily EMA trend filter aligns trades with higher–timeframe direction for smoother performance.

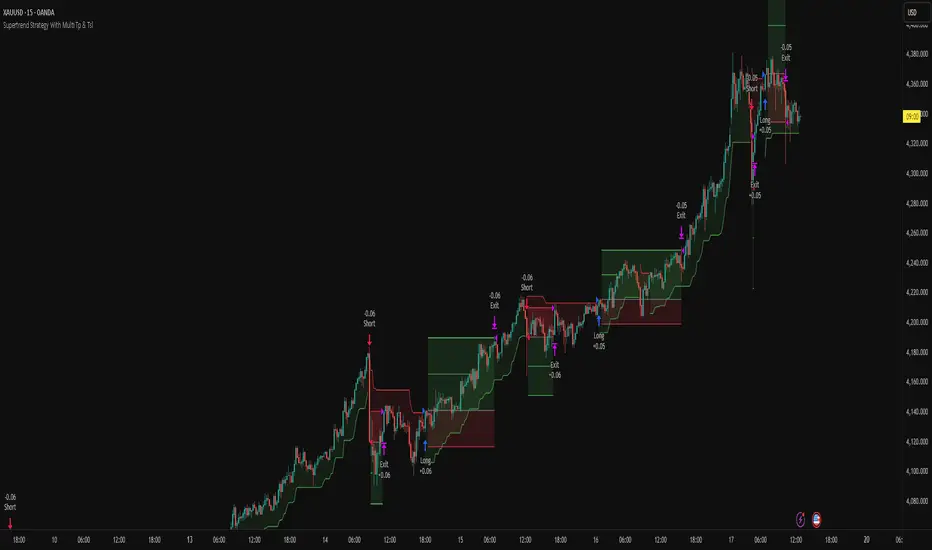
Supertrend Strategy With Multi Tp & TslHello Traders,
This strategy is based on the popular Supertrend indicator, which many traders use as a simple trend-following tool. The core entry logic is straightforward:
Buy (Long) when the price closes above the Supertrend line.
Sell (Short) when the price closes below the Supertrend line.
However, trading success isn’t only about entries — proper risk management makes all the difference. That’s why this strategy includes four stop-loss methods, two take-profit types, and a trailing stop-loss system. You can customize all of these settings to create your own personalized version.
🛑 Stop-Loss Methods
Tick – Uses the instrument’s smallest price increment. Ideal for tick-based markets such as Futures or Forex.
Percent – Defines the stop-loss as a percentage of entry price. Commonly used in Crypto trading.
ATR – Uses the Average True Range value to determine stop-loss distance. Perfect for adapting to changing market volatility.
Supertrend – The stop-loss level is set at the Supertrend line value at the time of entry.
🔁 Trailing Stop-Loss & Reverse Signals
Trailing SL: If enabled, the chosen stop-loss method will trail the price dynamically from the moment the position opens.
Close with Reverse Signals: When activated, the current position closes and reverses on an opposite signal. If disabled, the strategy waits until the current position is closed before opening a new one.
🎯 Take-Profit Options
Tick – Set a fixed take-profit level based on tick distance.
Percent – Set take-profit based on a percentage change from entry.
Ratio – Sets take-profit based on the entry-to-stop-loss distance × ratio value.
Each take-profit method allows you to define the percentage of position to close at that level.
⚖️ Breakeven Option
When Breakeven is enabled, after the first take-profit is triggered, the stop-loss automatically moves to the entry level, protecting your capital.
⚙️ Additional Settings
Position Type: Choose between Long only, Short only, or Both directions.
Session Filter: Trade only during specific time ranges. Activate this option and set your desired session hours (make sure to select your correct timezone).
📈 Visuals
The strategy plots entry, stop-loss, and take-profit levels directly on the chart, allowing you to clearly visualize your trades and manage them effectively.
Feel free to ask any questions or suggest improvements — this strategy is built for flexibility and experimentation!
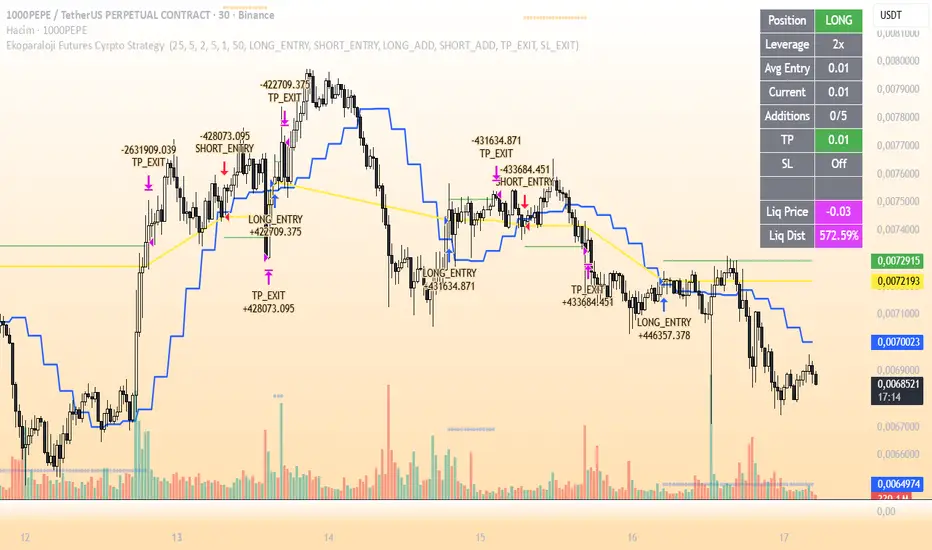
Ekoparaloji Futures Cyrpto Strategy Ekoparaloji Futures Crypto Strategy - Ladder Averaging System
This strategy uses a ladder position entry (pyramiding) approach and average cost reduction principle for crypto futures markets.
Key Features:
Dynamic ladder entry system
Profit-taking mechanism based on average price
Adjustable leverage support (1x-125x)
Long and Short position management
Optional stop-loss protection
Liquidation distance tracking
Advantages:
✓ Optimizes average cost during price fluctuations
✓ User-controlled risk-reward ratio
✓ Adapts to different market conditions
✓ Provides detailed visual feedback
✓ Increases profit potential through pyramiding strategy
Risks:
⚠ High leverage usage increases liquidation risk
⚠ Losses can accumulate during trend continuation
⚠ Pyramiding adds capital requirements
⚠ May produce unexpected results in sideways markets
⚠ Past performance does not guarantee future results
Recommended Usage:
This strategy is optimized for testing particularly on 30-minute and 1-hour timeframes. It may produce different results across various crypto pairs and market conditions.
Important Warning:
This strategy is for educational and research purposes. Extensive testing on demo accounts is strongly recommended before using in live trading. Leveraged trading involves high risk and you can lose all your capital.
📩 Message me to test the strategy and get access.
Happy Trading! 🚀
Multi-GPS (Long Only, with Alert Mode)A guided long‑only strategy with built‑in risk controls and smart alerts — your GPS for trend trading
**Multi‑GPS (Long Only, with Alert Mode)**
The Multi‑GPS strategy is built to help traders navigate trends with a structured, risk‑managed approach. It focuses exclusively on **long opportunities**, combining multiple moving‑average signals with layered risk controls to keep trades disciplined and consistent.
Key features include:
- **Dynamic trade management** with stop loss, take profit, and trailing stop options (all adjustable by percentage).
- **Flexible order sizing**, allowing positions to scale as a percentage of account equity.
- **Customizable moving averages** (SMA or EMA) and timeframe selection to adapt to different markets and styles.
- **Integrated alerts** with multiple modes, so traders can choose between order‑based notifications, alert() calls, or both.
- **Clear chart visuals**, including entry/exit markers and plotted guide lines for transparency.
This strategy is designed to act like a **navigation system for trend trading** — guiding entries, managing exits, and keeping risk under control, all while maintaining a clean and intuitive charting experience.
---
Would you like me to also craft a **short tagline version** (like a one‑liner hook) for this strategy, so it pairs neatly with the longer description when you publish it?

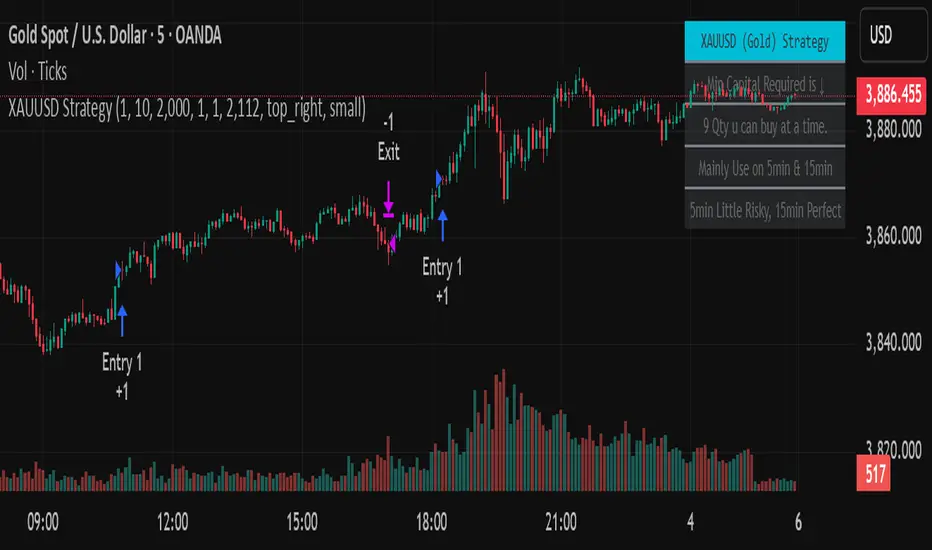
Golden StrategyTitle: XAUUSD (Gold) Smart Entry Strategy with Dynamic Scaling
Description:
This is a precision-based entry strategy for XAUUSD (Gold), optimized for lower timeframes like the 5-minute and 15-minute charts. It uses a custom logic engine to detect potential reversals and applies dynamic scaling (pyramiding) to build positions strategically based on price behavior.
🔍 Key Features:
✅ Smart entry logic for trend shifts
✅ Configurable position scaling up to 7 level
✅ Built-in capital efficiency for smaller accounts
✅ Backtest window control for historical testing
✅ Compact on-screen table for user guidance
Timeframes Recommended:
🔸 15-minute: Best balance of risk and consistency
🔸 5-minute: More frequent signals, slightly higher risk
⚠️ Important Disclaimer
This script is for educational and informational purposes only. It is not financial advice or a signal service. Trading carries risk, and past performance does not guarantee future results. Use at your own discretion and always manage risk appropriately.
Weekend Hunter Ultimate v6.2 Weekend Hunter Ultimate v6.2 - Automated Crypto Weekend Trading System
OVERVIEW:
Specialized trading strategy designed for cryptocurrency weekend markets (Saturday-Sunday) when institutional traders are typically offline and market dynamics differ significantly from weekdays. Optimized for 15-minute timeframe execution with multi-timeframe confluence analysis.
KEY FEATURES:
- Weekend-Only Trading: Automatically activates during configurable weekend hours
- Dynamic Leverage: 5-20x leverage adjusted based on market safety and signal confidence
- Multi-Timeframe Analysis: Combines 4H trend, 1H momentum, and 15M execution
- 10 Pre-configured Crypto Pairs: BTC, ETH, LINK, XRP, DOGE, SOL, AVAX, PEPE, TON, POL
- Position & Risk Management: Max 4 concurrent positions, -30% account protection
- Smart Trailing Stops: Protects profits when approaching targets
RISK MANAGEMENT:
- Maximum daily loss: 5% (configurable)
- Maximum weekend loss: 15% (configurable)
- Per-position risk: Capped at 120-156 USDT
- Emergency stops for flash crashes (8% moves)
- Consecutive loss protection (4 losses = pause)
TECHNICAL INDICATORS:
- CVD (Cumulative Volume Delta) divergence detection
- ATR-based dynamic stop loss and take profit
- RSI, MACD, Bollinger Bands confluence
- Volume surge confirmation (1.5x average)
- Weekend liquidity adjustments
INTEGRATION:
- Designed for Bybit Futures (0.075% taker fee)
- WunderTrading webhook compatibility via JSON alerts
- Minimum position size: 120 USDT (Bybit requirement)
- Initial capital: $500 recommended
TARGET METRICS:
- Win rate target: 65%
- Average win: 5.5%
- Average loss: 1.8%
- Risk-reward ratio: ~3:1
IMPORTANT DISCLAIMERS:
- Past performance does not guarantee future results
- Leveraged trading carries substantial risk of loss
- Weekend crypto markets have 13% of normal liquidity
- Not suitable for traders who cannot afford to lose their entire investment
- Requires continuous monitoring and adjustment
USAGE:
1. Apply to 15-minute charts only
2. Configure weekend hours for your timezone
3. Set up webhook alerts for automation
4. Monitor performance table in top-right corner
5. Adjust parameters based on your risk tolerance
This is an experimental strategy for educational purposes. Always test with small amounts first and never invest more than you can afford to lose completely.

AVWAP+RSI Confluence — 1R TesterRSI + 1R ATR - Monthly P\&L (v4)
WHAT THIS STRATEGY DOES (OVERVIEW)
* Pine strategy (v4) that combines a simple momentum trigger with a symmetric 1R ATR risk model and an on-chart Monthly/Yearly P\&L table.
* Momentum filter: trades only when RSI crosses its own SMA in the direction of the trend (price vs Trend EMA).
* Risk engine: exits use fixed 1R ATR brackets captured at entry (no drifting targets/stops).
* Accounting: the table aggregates percentage returns by month and year using strategy equity.
ENTRY LOGIC (LONGS & OPTIONAL SHORTS)
Indicators used:
* RSI(rsiLen) and its SMA: SMA(RSI, rsiMaLen)
* Trend filter: EMA(emaTrendLen) on price
Longs:
1. RSI crosses above its RSI SMA
2. RSI > rsiBuyThr (filters weak momentum)
3. Close > EMA(emaTrendLen)
Shorts (optional via enableShort):
1. RSI crosses below its RSI SMA
2. RSI < rsiSellThr
3. Close < EMA(emaTrendLen)
EXIT LOGIC AND RISK MODEL (1R ATR)
* On entry, snapshot ATR(atrLen) into atrAtEntry and the average fill price into entryPx.
* Longs: stop = entryPx - ATR \* atrMult; target = entryPx + ATR \* atrMult
* Shorts: mirrored.
* Stops and targets are posted immediately and remain fixed for the life of the trade.
POSITION SIZING AND COSTS
* Default position size: 25% of equity per trade (adjustable in Properties/inputs).
* Commission percent and a small slippage are set in strategy() so backtests include friction by default.
MONTHLY / YEARLY P\&L TABLE (HOW IT WORKS)
* Uses strategy equity to compute bar returns: equity / equity\ - 1.
* Compounds bar returns into current month and current year; commits each finished period at month/year change (or last bar).
* Renders rows as years; columns Jan..Dec plus a Year total column.
* Cells colored by sign; precision and maximum rows are controlled by inputs.
* Values represent percentage returns, not currency P\&L.
VISUAL AIDS
* Two pivot trails (pivot high/low) are plotted for context only; they do not affect entries or exits.
CUSTOMIZATION TIPS
* Raise rsiBuyThr (long) or lower rsiSellThr (short) to filter weak momentum.
* Increase emaTrendLen to tighten trend alignment.
* Adjust atrLen and atrMult to fit your timeframe/instrument volatility.
* Leave enableShort = false if you prefer long-only behavior or shorting is constrained.
NON-REPAINTING AND BACKTEST NOTES
* Signals use bar-close crosses of built-in indicators (RSI, EMA, ATR); no future bars are referenced.
* calc\_on\_every\_tick = true for responsive visuals; Strategy Tester evaluates on bar close in history.
* Backtest stop/limit fills are simulated and may differ from live execution/liquidity.
DISCLAIMERS
* Educational use only. This is not financial advice. Markets involve risk. Past performance does not guarantee future results.
INPUTS (QUICK REFERENCE)
* rsiLen, rsiMaLen, rsiBuyThr, rsiSellThr
* emaTrendLen
* atrLen, atrMult, enableShort
* leftBars, rightBars, prec, showTable, maxYearsRows
SHORT TAGLINE
RSI momentum with 1R ATR brackets and a built-in Monthly/Yearly P\&L table.
TAGS
strategy, RSI, ATR, trend, risk-management, backtest, Pine-v4

AI KNN-Dual SuperTrend MTF - by Trading Pine Lab🇬🇧
The AI KNN-Dual SuperTrend MTF is a next-generation trading strategy that merges two higher-timeframe SuperTrends with dual KNN (K-Nearest Neighbors) classifiers, an ADX/DMI filter, and a Pivot Percentile bias module. This layered architecture ensures stronger signal confirmation by requiring consensus across AI models, multi-timeframe SuperTrends, and statistical filters.
Entries occur only when both SuperTrends align with bullish or bearish KNN labels, while the ADX/DMI filter validates momentum. Exits are managed dynamically with adaptive trailing stops (ST ± ATR × factor) or when market conditions flip according to percentile bias.
All parameters are fully configurable:
-Trading direction filter: Long / Short / Both.
-KNN classifiers: neighbors (K), dataset size (N), smoothing lengths.
-Dual SuperTrend: higher timeframes, ATR length, ATR factor, baseline type.
-ADX/DMI filter: customizable length and timeframe.
-Pivot Percentile module: multi-scale statistical bias.
-Visualization: AI markers, ribbons, aura lines, and per-trend coloring.

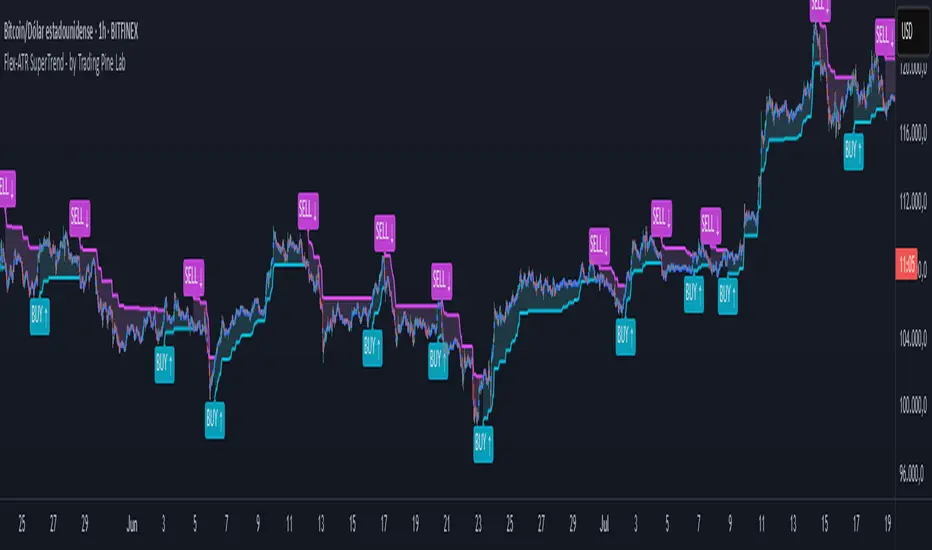
Flex-ATR SuperTrend - by Trading Pine Lab🇬🇧
The Flex-ATR SuperTrend is a versatile trading strategy that enhances the classic SuperTrend with adjustable ATR methods, a custom date-range filter, and modern visual styling. By allowing a switch between standard ATR and SMA-based TR, the baseline adapts better to different volatility regimes and market conditions.
Entries are triggered when the SuperTrend flips bullish, while exits occur when it flips bearish. A highlight cloud emphasizes the active trend, and optional BUY/SELL labels provide clear visual confirmation of entry and exit signals.
All parameters are fully configurable:
-ATR settings: period and multiplier, with toggle between classic ATR and SMA-based TR.
-Date range filter: define exact backtesting windows.
-Signal visualization: optional BUY/SELL labels.
-Highlight cloud: cyan/magenta overlay for trend emphasis.
-Customization: enable/disable signals and visuals for a clean or detailed interface.
HMK-2 | PCA-1 + Rejim + Chebyshev + VWAP (Input'lu, v6)📌 HMK-2 | PCA-1 + Regime + Chebyshev + VWAP Strategy
1️⃣ Core Structure
Instead of relying on a single indicator, this system uses the Z-Score normalized average of three oscillators (RSI, MFI, ROC).
Signal (PCA-1):
RSI(14), MFI(14), ROC(5) → each is converted into a z-score.
Their average becomes the “composite signal,” our PCA-1 value.
Trend direction: If the Z-score EMA is rising → trend UP. If falling → trend DOWN.
2️⃣ Side Filters
Regime Filter (ADX + EMA)
ADX is calculated manually.
If ADX > 20 → trend exists → a 50-period EMA of this value smooths it.
This turns “trend regime” into a probability between 0–1.
Chebyshev Filter
A return series is checked against mean ± k*sigma bands.
If the return is within this band → valid signal. Extreme moves are filtered out.
VWAP Filter
Long trades: price must be above VWAP.
Short trades: price must be below VWAP.
Trades are only taken on the correct side of institutional cost averages.
3️⃣ Entry Conditions
Long:
PCA-1 signal crosses above threshold.
Trend Up + Regime OK + Chebyshev OK + Above VWAP.
Short:
PCA-1 signal crosses below threshold.
Trend Down + Regime OK + Chebyshev OK + Below VWAP.
4️⃣ Exit Mechanism
Main Exit: ATR-based stop/target.
Stop = entry price – ATR × (SL factor).
Take profit = entry price + ATR × (TP factor).
Additional Exit:
If price crosses to the opposite side of VWAP.
If PCA-1 signal crosses zero.
👉 Prevents trades from being locked, makes exits adaptive.
5️⃣ Labels / Visualization
AL / SHORT → entry points.
SAT / COVER → exit points.
VWAP line plotted in blue.
🧩 Strategy Features
Optimizable parameters:
Z-window (zWin)
Threshold
Chebyshev factor
ATR stop/target multipliers
This system works with:
Disciplined core (PCA-1 signal)
Triple protection (Regime + Chebyshev + VWAP)
Adaptive exits (ATR + VWAP/signal cross)
👉 Not a “single-indicator robot,” but a multi-filtered trade direction engine.
💡 Final Note
This is a base model of the system — open for further development.
I’ve shared the logic to give you a roadmap.
If you spot errors, fix them → that’s how you’ll improve it.
Don’t waste time asking me questions — refine and build it better yourselves.
Wishing you profitable trades. Stay well 🙏

Imbalance No SL📊 Strategy Name: Imbalance No SL
This strategy specially trades on price jumps (true imbalances) in the market, takes advantage of momentum only, and as soon as the opposite signal and profit is received, the trade is closed immediately.
Imbalance No SL strategy specially generates buy and sell signals based on "Imbalance" logic, without any fixed Stop Loss.
🔍 Core Logic
Imbalance Detection
Bullish Imbalance : When the low of the current candle is above the high of the previous candle.
(i.e. a jump type gap occurred in the market – demand is high, price went straight up)
Bearish Imbalance : When the high of the current candle is below the low of the previous candle.
(i.e. the market suddenly fell down)
Creating Visual Box and Label on Signal:
As soon as bullish imbalance is found, green box & IMB BULL label is displayed on the chart.
Bearish has red box & IMB BEAR label.
Trade Entry Logic
BUY on Bullish Imbalance: If there is already a buy or neutral position, then a new “BUY” signal will fire.
SELL on Bearish Imbalance: If already in sell or neutral position, then new “SELL” signal will fire.
You can set quantity/lot size from ‘qty’ input field.
Trade Average Calculation
Buy/Sell maintains average price and their count (so that if averaging is done then correct P&L is calculated).
Trade Exit Logic (Profit Booking/Signal Reverse)
If your buy is going on and bearish imbalance is formed + price is above your average, then buy will be closed (profit condition).
If sell is going on and bullish imbalance is formed + price is below average, then sell will be closed.
Chart Cleaning/Management
Only keep the label and box of the latest signal on the chart, old boxes/labels are automatically deleted.
Alert
You can get alert on bullish or bearish signal (by using alert feature of TradingView).
✅ Simple Explanation for User
This strategy buys or sells directly at the gap (imbalance).
Whenever there is a clear signal of momentum in the market (breakout of the gap), then the trade entry takes place.
When there is an imbalance in the opposite direction and profit is made, the system closes the trade (closes).
There is no fixed stop-loss, risk management is handled by trade averaging/close.
You will know at every point on the visually chart that at which bar the buy, sell and exit took place.
⚠️ What to remember?
If the market is in trend then this script gives very good signals.
In choppy/sideways market, some loss trades can also come because there is no SL.
Big profit or big loss – both depend on the imbalance signal and market speed.

TTE Elite Market SignalsWelcome to TTE Elite Market Signals Your very own personal trading assistant
Trading today demands more than intuition—it requires exclusive access to elite-level market intelligence and the discipline to act on high-probability signals. Every professional trader seeks that decisive advantage: the clarity and confidence that separates consistent profitability from market uncertainty. The financial markets show no mercy, demanding precision, logic, and strategy grounded in institutional-grade analysis.
Human judgment, while powerful, can be compromised by fatigue and emotion, leading to costly trading errors. This is precisely where TTE Elite Market Signals excels. Our sophisticated platform combines proven trading methodologies with advanced signal generation technology, delivering market intelligence that empowers you to identify optimal entry and exit opportunities while maintaining complete control over your trading decisions.
Revolutionary Signal Intelligence
TTE Elite Market Signals features adaptive learning technology that evolves with market conditions. It continuously refines its analysis, helping you identify higher-probability setups while providing the market intelligence needed for superior risk management.
Elite Analysis Modes
Our platform adapts its signal generation to match market personalities:
- Institutional Flow Mode (MM-hybrid): Identifies manipulation patterns and tracks smart money movement with exclusive institutional-grade precision
- Momentum Adaptive Mode: Rapidly adjusts analysis when volatility and momentum shift
- Conservative Precision Mode: Steady, risk-conscious signals for consistent performance
- Adaptive Intelligence Mode: Self-refining system that enhances signal quality over time from past trades (long term of use)
Comprehensive Signal Intelligence
TTE Elite Market Signals integrates multiple sophisticated analytical systems:
- Volume Profile analysis for exclusive institutional-level market insights
- Pattern recognition enhanced by machine learning algorithms
- Intelligent exit timing that identifies optimal profit-taking opportunities
- Protection against market manipulation tactics
- Position sizing guidance that scales with trading success
- Fibonacci based reversal logic
Perfect for Your Trading Evolution
Experienced traders appreciate our sophisticated market intelligence and institutional-grade analytics that provide genuine competitive advantages.
Developing traders benefit from intelligent signal analysis that handles complex market calculations while teaching professional-level market interpretation and risk management principles via visuals on chart and descriptive panel.
All timeframes supported—from scalping to swing trading, TTE Elite Market Signals adapts to your preferred trading style via several user input selections.
Two Elite Service Modes
1. Signal Intelligence Mode: Real-time market signals with AI-driven analysis and detailed trade rationale
2. Alert Precision Mode: High-probability setup notifications with comprehensive market context and risk parameters
The Exclusive Learning Advantage
What makes TTE Elite Market Signals exceptional: it maintains a comprehensive trade memory and identifies the highest-probability signals, adapts to changing volatility patterns, and continuously refines(does not repaint) its analysis to enhance your profit potential and trading accuracy.
Built-in Professional Protection
- Advanced manipulation detection safeguards against institutional market maker(MM) tactics
- Intelligent risk assessment adjusts signal confidence based on market conditions
- Progressive scaling guidance maximizes winners while minimizing losses(educational)
- Comprehensive oversight with customizable risk parameters
Experience the Elite Difference
TTE gives you visuals on the chart of past trades and live metrics results to see what actually work and what fails, to minimize unrealistic expectations. Just sit back and watch sophisticated algorithms work tirelessly on your behalf, identifying opportunities that others miss and alerting you as signals are generated. Transforming the stressful, emotional battlefield of trading into a systematic analytical approach.
Let the System Do the Heavy Lifting
While others struggle with analysis paralysis and emotional decision-making, you'll have access to signals that have already processed hundreds of data points, identified institutional patterns, and calculated optimal risk-reward scenarios for a far less stressful trading experience.
What Elite Traders Should Know
TTE Elite Market Signals represents cutting-edge signal generation technology designed for serious market education and skill development, but it is not a black box, nor perfect for all markets. It must be adjusted to yield optimal results. While our advanced capabilities and institutional-grade features provide significant analytical advantages, trading success requires discipline and proper execution. Markets evolve, and optimal results demand understanding of signal context.
Success with TTE Elite Market Signals comes from mastering our analytical modes and using the proper entry types such as breakout entry, machine learning(ML) entry etc, utilizing and selecting the most effective risk control to optimize it, and maintaining disciplined risk management.
Join the Elite Trading Revolution
This isn't just another signal service—it equips you with the tools to do proper market analysis displaying price movement and volume profile designed for serious traders who understand that consistent profitability comes from discipline, superior market intelligence and proper interpretation, not luck.
Trade smart, stay profitable, and achieve trading excellence.
Best TTE Settings
Trade Entry Types:
1st Best Breakout Entry(out perform all others when used alone)
2nd Best ML Entry by itself or + Pattern Entry Combined
Risk Management:
ATR Multiplier 2
Enable Master Size Control
Master Size Mode
Max Risk Per Trade % 2.5
Max Multiplier Cap 1.5
Enable Growth Scaling
Growth Scaling Mode-set to Time Based or Performance
Risk Management System- set to Hybrid
Enable ML System
ML Mode-set to Auto or Quantum Learning
ML Application Strategy-set to Universal All Entries
Enable Trend Continuation
Mode- Set to Standard
Independent Entry-stays unchecked(off)
Best Performing Instruments on TTE (will update list as more are adjusted and tested)
NVDA
AMD
AMZN
TSLA
SPY
QQQ
PLTR

Pivot Distance Strategy# Multi-Timeframe Pivot Distance Strategy
## Core Innovation & Originality
This strategy revolutionizes moving average crossover trading by applying MA logic to **pivot distance relationships** instead of raw price data. Unlike traditional MA crossovers that react to price changes, this system reacts to **structural momentum changes** in how current price relates to recent significant pivot levels, creating earlier signals with fewer false positives.
## Methodology & Mathematical Foundation
### Pivot Distance Oscillator
The strategy calculates:
- **High Pivot Percentage**: (Current Close / Last Pivot High) × 100
- **Low Pivot Percentage**: (Last Pivot Low / Current Close) × 100
- **Pivot Distance**: High Pivot Percentage - Low Pivot Percentage
This creates a standardized oscillator measuring market structure compression/expansion regardless of asset price or volatility.
### Multi-Timeframe Filter
Higher timeframe analysis provides directional bias:
- **HTF Long** → Allow long entries, force short exits
- **HTF Short** → Allow short entries, force long exits
- **HTF Squeeze** → Block all entries, force all exits
## Signal Generation Methods
### Method 1: Dual MA Crossover (Primary/Default)
**Fast MA (14 EMA)** and **Slow MA (50 SMA)** applied to pivot distance values:
- **Long Signal**: Fast MA crosses above Slow MA (accelerating bullish pivot momentum)
- **Short Signal**: Fast MA crosses below Slow MA (accelerating bearish pivot momentum)
**Key Advantage**:
- Traditional: Fast MA(price) crosses Slow MA(price) - reacts to price changes
- This Strategy: Fast MA(pivot distance) crosses Slow MA(pivot distance) - reacts to structural changes
- Result: Earlier signals, better trend identification, fewer ranging market whipsaws
### Method 2: MA Cross Zero
- **Long**: Pivot Distance MA crosses above zero
- **Short**: Pivot Distance MA crosses below zero
### Method 3: Pivot Distance Breakout (Squeeze-Based)
Uses dynamic threshold envelopes to detect compression/expansion cycles:
- **Long**: Distance breaks above dynamic breakout threshold after squeeze
- **Short**: Distance breaks below negative breakout threshold after squeeze
**Note**: Only the Breakout method uses threshold envelopes; MA Cross modes operate without them for cleaner signals.
## Risk Management Integration
- **ATR-Based Stops**: Entry ± (ATR × Multiplier) for stops/targets
- **Trailing Stops**: Dynamic adjustment based on profit thresholds
- **Cooldown System**: Prevents overtrading after stop-loss exits
## How to Use
### Setup (Default: MA Cross MA)
1. **Strategy Logic**: "MA Cross MA" for structural momentum signals
2. **MA Settings**: 14 EMA (fast) / 50 SMA (slow) - both adjustable
3. **Multi-Timeframe**: Enable HTF for trend alignment
4. **Risk Management**: ATR stop loss, ATR take profit
### Signal Interpretation
- **Blue/Purple lines**: Fast/Slow MAs of pivot distance
- **Green/Red histogram**: Positive/negative pivot distance
- **Triangle markers**: MA crossover entry signals
- **HTF display**: Shows higher timeframe bias (top-left)
### Trade Management
- **Entry**: Clean MA crossover with HTF alignment
- **Exit**: Opposite crossover, HTF change, or risk management triggers
## Unique Advantages
1. **Structural vs Price Momentum**: Captures market structure changes rather than just price movement, naturally filtering noise
2. **Multi-Modal Flexibility**: Three signal methods for different market conditions or strategies
3. **Timeframe Alignment**: HTF filtering improves win rates by preventing counter-trend trades

Valdes Trading Bots - Scaled Profits and DCA — V 12.1Valdes Trading Bots – Scaled Profits and DCA — V 12.1
Overview
This strategy is built for traders who want to capture medium-term swings without getting caught in short-term noise. It is optimized for the 12-hour timeframe, where signals have historically shown stronger consistency across a wide range of market conditions.
Key Features
Trend regime detection – Identifies when momentum flips from bullish to bearish (and vice versa).
Scaled profit targets – Positions automatically reduce across multiple take-profit levels to secure gains progressively.
Risk management – Includes a capped, rules-based averaging (DCA) method during controlled pullbacks. Not martingale, strictly limited.
Directional flexibility – Can operate long or short, depending on market regime.
JSON output included – Adds flexibility for advanced users.
How to Use
Apply primarily on the 12-hour chart for best results.
Use this script for backtesting, research, and simulation before any live application.
No input changes are required; it is designed to run as-is.
Notes & Limitations
This is a strategy script, not a signal service.
Past win rates or backtest results are not predictive of future performance.
All markets carry risk, and losing trades will occur.
Always test extensively in paper trading before deploying to a live account.
Disclaimer
This script is provided for educational and research purposes only. It is not financial advice. The authors and publishers assume no responsibility for losses incurred from using this strategy.

RCI 2 Dashboards ✅ Strategy: RCI 2 Dashboards BY Sonu JAIN
This advanced strategy is built around the Rank Correlation Index (RCI), a unique momentum oscillator, and combines it with a comprehensive suite of powerful indicators to identify high-probability trading opportunities. The strategy’s core strength lies in its ability to filter signals using up to 12 different conditions for both long and short trades.
To make the decision-making process clear and intuitive, the strategy features two dynamic, customizable dashboards right on your chart. The first dashboard gives you a live, detailed breakdown of which conditions are met, while the second provides a real-time overview of the strategy’s performance.
How It Works
The strategy generates entry signals based on RCI crossovers and crossunders. These signals are then filtered by a customizable combination of other indicators to confirm the trade.
Long Entry:
The RCI crosses over its moving average.
All enabled long-side filters are met.
Short Entry:
The RCI crosses under its moving average.
All enabled short-side filters are met.
Key Features
RCI Crossover Logic: The core of the strategy is an RCI crossover/crossunder with a customizable moving average (MA). You can choose from SMA, EMA, SMMA (RMA), WMA, or VWMA.
12 Optional Filters: This strategy goes far beyond a simple RCI signal. You can enable or disable a wide range of filters to refine your entries. These include:
Trend: Supertrend, Parabolic SAR (SAR), and Vortex Indicator.
Volatility: Keltner Channels (KC) and Bollinger Bands (BB).
Momentum: Woodies CCI, Money Flow Index (MFI), and Relative Strength Index (RSI).
Volume: On-Balance Volume (OBV) and simple Volume analysis.
Directional Strength: Average Directional Index (ADX).
Timing: A time-of-day filter to trade only during specific market hours.
Dual Dashboards:
Detailed Condition Dashboard: This dashboard shows you exactly which of the 12 filters are currently met with a simple ✓ or ✗. This provides instant clarity on why a trade is or isn't being considered.
Performance Dashboard: This dashboard displays key performance metrics in real-time, including net profit, win rate, profit factor, max drawdown, and current/max winning and losing streaks. It also provides details on the most recent trade, such as entry, stop-loss, and exit prices.
Customizable Stop Loss: The strategy includes a fixed percentage-based stop loss for both long and short positions, which you can easily configure in the settings.
Trade Direction Control: You can choose to trade "Long Only," "Short Only," or "Long & Short," giving you complete control over your trading bias.
This strategy is a powerful tool for traders who want to build a robust, multi-filtered system. The included dashboards make it an excellent educational tool for understanding how different indicators work together to form a complete trading plan. You can use it to backtest and optimize your own unique combination of indicators to find the perfect setup for your market and timeframe.

DOGE 15MIN**Warm Reminder:** This strategy is intended solely for exploratory research and experimentation to evaluate the effectiveness of various signals. Drawing inspiration from patterns observed on the DOGE cryptocurrency 15-minute chart, it provides a tailored framework to identify potential trading opportunities. For optimal results, it is currently recommended exclusively for DOGE 15min charts. Remember, trading involves inherent risks, and past performance is not indicative of future results. We are dedicated to ongoing optimizations and refinements to enhance its robustness across broader applications—stay tuned for updates!
#### **A. Long Entry Signals**
These conditions trigger a long position entry, provided the strategy has no existing position (position_size == 0) and is not blocked. Signals can be enabled/disabled via input toggles (e.g., enable_vix).
- **VIX Reversal (vix_long)**: VIX signal shifts from high to low volatility (non-high volatility), with RSI between 30-50.
- **RSI Oversold (rsi_long)**: RSI crosses above 30.
- **CVD Bullish (cvd_long)**: CVD is rising.
- **Price RSI Bullish (prsi_long)**: Price RSI crosses above 30 or a long signal is triggered.
- **RangeEMA Bullish (rema_long)**: Candlestick is above POC, with KAMA trend flipping upward.
- **ZVWAP Oversold (zvwap_long)**: ZVWAP enters the oversold zone.
- **KAMA + Volume Bullish (kama_long)**: KAMA trend flips upward, candlestick is above POC, volume is rising, and the candle is bullish (green).
- **Volume Burst Bullish (vol_burst_long)**: Volume RSI crosses below threshold (default 70), open > close (bearish/red candle), triggered within the last two candles. **Special: Ignores all blocks** (bypasses not_long, Pivot, OI, RSI/ADX extreme filters).
#### **B. Short Entry Signals**
Similar to long entries: requires no existing position and no blocks.
- **RSI Overbought (rsi_short)**: RSI crosses below 70.
- **CVD Bearish (cvd_short)**: CVD is declining.
- **Price RSI Bearish (prsi_short)**: Price RSI crosses below 70 or a short signal is triggered.
- **RangeEMA Bearish (rema_short)**: Candlestick is below POC, with KAMA trend flipping downward.
- **ZVWAP Overbought (zvwap_short)**: ZVWAP enters the overbought zone.
- **KAMA + Volume Bearish (kama_short)**: KAMA trend flips downward, candlestick is below POC, volume is declining, and the candle is bearish (red).
- **Chop Bearish (chop_short)**: Chop crosses below 38.2, with RSI > 50.
- **Volume Burst Bearish (vol_burst_short)**: Volume RSI crosses below threshold (default 70), RSI > 70, and close > open (bullish/green candle), triggered within the last two candles. **Special: Ignores all blocks** (bypasses not_short, Pivot, OI, RSI/ADX extreme filters).
#### **C. Long Entry Blocks/Filters**
These conditions block long entries unless the signal ignores blocks (e.g., Volume Burst).
- **Base Prohibition (not_long)**: Volume is declining, or ADX is bearish (di_bear), or VIX is in high volatility (vix_flag), or RSI < 30.
- **Pivot Filter**: Recent Pivot is in a disadvantaged position.
- **OI Filter**: OI is declining.
- **RSI/ADX Extreme Filter**: RSI > 70 or ADX is bullish (di_bull).
- **Other**: Strategy already has a position (position_size != 0), or extreme volatility (is_extreme, though disabled in code).
#### **D. Short Entry Blocks/Filters**
Similar to long blocks.
- **Base Prohibition (not_short)**: Volume is rising, or (Chop < 38.2 and RSI > 50), or ADX is bullish (di_bull), or RSI > 70.
- **Pivot Filter**: Recent Pivot is in a disadvantaged position.
- **OI Filter**: OI is rising.
- **RSI/ADX Extreme Filter**: RSI < 30 or ADX is bearish (di_bear).
- **Other**: Existing position, or extreme volatility.
#### **E. Long Exit Signals**
Triggers closing of long positions, based on states (e.g., super_long, weak_long, only_kama).
- **KAMA Bearish Flip (exist_long)**: KAMA trend flips downward, or KAMA is downward with a short signal.
- **VIX Signal**: VIX shifts from low to high volatility, with RSI < 50.
- **Reversal Signal**: Short signal present and KAMA is downward.
- **Weak Trend Stop-Loss (weak_stop_long)**: In weak_long state, candlestick near POC, and close crosses below POC.
- **Weak KAMA Stop-Loss (weak_kama_long)**: In weak_long state, candlestick far from POC, and KAMA trend reverses.
- **Global Exit (exist_all)**: Volume RSI crosses below threshold (vol_under), or KAMA exit (kama_exit_long), or weak stop-loss, etc.
- **Special**: If in strong_long_hold (only_kama and KAMA remains bullish), ignore certain exit signals to hold the position.
#### **F. Short Exit Signals**
Similar to long exits.
- **KAMA Bullish Flip (exist_short)**: KAMA trend flips upward, or KAMA is upward with a long signal.
- **Reversal Signal**: Long signal present and KAMA is upward.
- **Weak Trend Stop-Loss (weak_stop_short)**: In weak_short state, candlestick near POC, and close crosses above short_state.current_max.
- **Weak KAMA Stop-Loss (weak_kama_short)**: In weak_short state, candlestick far from POC, and KAMA flips upward.
- **Global Exit (exist_all)**: Same as above.

Anomalous Holonomy Field Theory🌌 Anomalous Holonomy Field Theory (AHFT) - Revolutionary Quantum Market Analysis
Where Theoretical Physics Meets Trading Reality
A Groundbreaking Synthesis of Differential Geometry, Quantum Field Theory, and Market Dynamics
🔬 THEORETICAL FOUNDATION - THE MATHEMATICS OF MARKET REALITY
The Anomalous Holonomy Field Theory represents an unprecedented fusion of advanced mathematical physics with practical market analysis. This isn't merely another indicator repackaging old concepts - it's a fundamentally new lens through which to view and understand market structure .
1. HOLONOMY GROUPS (Differential Geometry)
In differential geometry, holonomy measures how vectors change when parallel transported around closed loops in curved space. Applied to markets:
Mathematical Formula:
H = P exp(∮_C A_μ dx^μ)
Where:
P = Path ordering operator
A_μ = Market connection (price-volume gauge field)
C = Closed price path
Market Implementation:
The holonomy calculation measures how price "remembers" its journey through market space. When price returns to a previous level, the holonomy captures what has changed in the market's internal geometry. This reveals:
Hidden curvature in the market manifold
Topological obstructions to arbitrage
Geometric phase accumulated during price cycles
2. ANOMALY DETECTION (Quantum Field Theory)
Drawing from the Adler-Bell-Jackiw anomaly in quantum field theory:
Mathematical Formula:
∂_μ j^μ = (e²/16π²)F_μν F̃^μν
Where:
j^μ = Market current (order flow)
F_μν = Field strength tensor (volatility structure)
F̃^μν = Dual field strength
Market Application:
Anomalies represent symmetry breaking in market structure - moments when normal patterns fail and extraordinary opportunities arise. The system detects:
Spontaneous symmetry breaking (trend reversals)
Vacuum fluctuations (volatility clusters)
Non-perturbative effects (market crashes/melt-ups)
3. GAUGE THEORY (Theoretical Physics)
Markets exhibit gauge invariance - the fundamental physics remains unchanged under certain transformations:
Mathematical Formula:
A'_μ = A_μ + ∂_μΛ
This ensures our signals are gauge-invariant observables , immune to arbitrary market "coordinate changes" like gaps or reference point shifts.
4. TOPOLOGICAL DATA ANALYSIS
Using persistent homology and Morse theory:
Mathematical Formula:
β_k = dim(H_k(X))
Where β_k are the Betti numbers describing topological features that persist across scales.
🎯 REVOLUTIONARY SIGNAL CONFIGURATION
Signal Sensitivity (0.5-12.0, default 2.5)
Controls the responsiveness of holonomy field calculations to market conditions. This parameter directly affects the threshold for detecting quantum phase transitions in price action.
Optimization by Timeframe:
Scalping (1-5min): 1.5-3.0 for rapid signal generation
Day Trading (15min-1H): 2.5-5.0 for balanced sensitivity
Swing Trading (4H-1D): 5.0-8.0 for high-quality signals only
Score Amplifier (10-200, default 50)
Scales the raw holonomy field strength to produce meaningful signal values. Higher values amplify weak signals in low-volatility environments.
Signal Confirmation Toggle
When enabled, enforces additional technical filters (EMA and RSI alignment) to reduce false positives. Essential for conservative strategies.
Minimum Bars Between Signals (1-20, default 5)
Prevents overtrading by enforcing quantum decoherence time between signals. Higher values reduce whipsaws in choppy markets.
👑 ELITE EXECUTION SYSTEM
Execution Modes:
Conservative Mode:
Stricter signal criteria
Higher quality thresholds
Ideal for stable market conditions
Adaptive Mode:
Self-adjusting parameters
Balances signal frequency with quality
Recommended for most traders
Aggressive Mode:
Maximum signal sensitivity
Captures rapid market moves
Best for experienced traders in volatile conditions
Dynamic Position Sizing:
When enabled, the system scales position size based on:
Holonomy field strength
Current volatility regime
Recent performance metrics
Advanced Exit Management:
Implements trailing stops based on ATR and signal strength, with mode-specific multipliers for optimal profit capture.
🧠 ADAPTIVE INTELLIGENCE ENGINE
Self-Learning System:
The strategy analyzes recent trade outcomes and adjusts:
Risk multipliers based on win/loss ratios
Signal weights according to performance
Market regime detection for environmental adaptation
Learning Speed (0.05-0.3):
Controls adaptation rate. Higher values = faster learning but potentially unstable. Lower values = stable but slower adaptation.
Performance Window (20-100 trades):
Number of recent trades analyzed for adaptation. Longer windows provide stability, shorter windows increase responsiveness.
🎨 REVOLUTIONARY VISUAL SYSTEM
1. Holonomy Field Visualization
What it shows: Multi-layer quantum field bands representing market resonance zones
How to interpret:
Blue/Purple bands = Primary holonomy field (strongest resonance)
Band width = Field strength and volatility
Price within bands = Normal quantum state
Price breaking bands = Quantum phase transition
Trading application: Trade reversals at band extremes, breakouts on band violations with strong signals.
2. Quantum Portals
What they show: Entry signals with recursive depth patterns indicating momentum strength
How to interpret:
Upward triangles with portals = Long entry signals
Downward triangles with portals = Short entry signals
Portal depth = Signal strength and expected momentum
Color intensity = Probability of success
Trading application: Enter on portal appearance, with size proportional to portal depth.
3. Field Resonance Bands
What they show: Fibonacci-based harmonic price zones where quantum resonance occurs
How to interpret:
Dotted circles = Minor resonance levels
Solid circles = Major resonance levels
Color coding = Resonance strength
Trading application: Use as dynamic support/resistance, expect reactions at resonance zones.
4. Anomaly Detection Grid
What it shows: Fractal-based support/resistance with anomaly strength calculations
How to interpret:
Triple-layer lines = Major fractal levels with high anomaly probability
Labels show: Period (H8-H55), Price, and Anomaly strength (φ)
⚡ symbol = Extreme anomaly detected
● symbol = Strong anomaly
○ symbol = Normal conditions
Trading application: Expect major moves when price approaches high anomaly levels. Use for precise entry/exit timing.
5. Phase Space Flow
What it shows: Background heatmap revealing market topology and energy
How to interpret:
Dark background = Low market energy, range-bound
Purple glow = Building energy, trend developing
Bright intensity = High energy, strong directional move
Trading application: Trade aggressively in bright phases, reduce activity in dark phases.
📊 PROFESSIONAL DASHBOARD METRICS
Holonomy Field Strength (-100 to +100)
What it measures: The Wilson loop integral around price paths
>70: Strong positive curvature (bullish vortex)
<-70: Strong negative curvature (bearish collapse)
Near 0: Flat connection (range-bound)
Anomaly Level (0-100%)
What it measures: Quantum vacuum expectation deviation
>70%: Major anomaly (phase transition imminent)
30-70%: Moderate anomaly (elevated volatility)
<30%: Normal quantum fluctuations
Quantum State (-1, 0, +1)
What it measures: Market wave function collapse
+1: Bullish eigenstate |↑⟩
0: Superposition (uncertain)
-1: Bearish eigenstate |↓⟩
Signal Quality Ratings
LEGENDARY: All quantum fields aligned, maximum probability
EXCEPTIONAL: Strong holonomy with anomaly confirmation
STRONG: Good field strength, moderate anomaly
MODERATE: Decent signals, some uncertainty
WEAK: Minimal edge, high quantum noise
Performance Metrics
Win Rate: Rolling performance with emoji indicators
Daily P&L: Real-time profit tracking
Adaptive Risk: Current risk multiplier status
Market Regime: Bull/Bear classification
🏆 WHY THIS CHANGES EVERYTHING
Traditional technical analysis operates on 100-year-old principles - moving averages, support/resistance, and pattern recognition. These work because many traders use them, creating self-fulfilling prophecies.
AHFT transcends this limitation by analyzing markets through the lens of fundamental physics:
Markets have geometry - The holonomy calculations reveal this hidden structure
Price has memory - The geometric phase captures path-dependent effects
Anomalies are predictable - Quantum field theory identifies symmetry breaking
Everything is connected - Gauge theory unifies disparate market phenomena
This isn't just a new indicator - it's a new way of thinking about markets . Just as Einstein's relativity revolutionized physics beyond Newton's mechanics, AHFT revolutionizes technical analysis beyond traditional methods.
🔧 OPTIMAL SETTINGS FOR MNQ 10-MINUTE
For the Micro E-mini Nasdaq-100 on 10-minute timeframe:
Signal Sensitivity: 2.5-3.5
Score Amplifier: 50-70
Execution Mode: Adaptive
Min Bars Between: 3-5
Theme: Quantum Nebula or Dark Matter
💭 THE JOURNEY - FROM IMPOSSIBLE THEORY TO TRADING REALITY
Creating AHFT was a mathematical odyssey that pushed the boundaries of what's possible in Pine Script. The journey began with a seemingly impossible question: Could the profound mathematical structures of theoretical physics be translated into practical trading tools?
The Theoretical Challenge:
Months were spent diving deep into differential geometry textbooks, studying the works of Chern, Simons, and Witten. The mathematics of holonomy groups and gauge theory had never been applied to financial markets. Translating abstract mathematical concepts like parallel transport and fiber bundles into discrete price calculations required novel approaches and countless failed attempts.
The Computational Nightmare:
Pine Script wasn't designed for quantum field theory calculations. Implementing the Wilson loop integral, managing complex array structures for anomaly detection, and maintaining computational efficiency while calculating geometric phases pushed the language to its limits. There were moments when the entire project seemed impossible - the script would timeout, produce nonsensical results, or simply refuse to compile.
The Breakthrough Moments:
After countless sleepless nights and thousands of lines of code, breakthrough came through elegant simplifications. The realization that market anomalies follow patterns similar to quantum vacuum fluctuations led to the revolutionary anomaly detection system. The discovery that price paths exhibit holonomic memory unlocked the geometric phase calculations.
The Visual Revolution:
Creating visualizations that could represent 4-dimensional quantum fields on a 2D chart required innovative approaches. The multi-layer holonomy field, recursive quantum portals, and phase space flow representations went through dozens of iterations before achieving the perfect balance of beauty and functionality.
The Balancing Act:
Perhaps the greatest challenge was maintaining mathematical rigor while ensuring practical trading utility. Every formula had to be both theoretically sound and computationally efficient. Every visual had to be both aesthetically pleasing and information-rich.
The result is more than a strategy - it's a synthesis of pure mathematics and market reality that reveals the hidden order within apparent chaos.
📚 INTEGRATED DOCUMENTATION
Once applied to your chart, AHFT includes comprehensive tooltips on every input parameter. The source code contains detailed explanations of the mathematical theory, practical applications, and optimization guidelines. This published description provides the overview - the indicator itself is a complete educational resource.
⚠️ RISK DISCLAIMER
While AHFT employs advanced mathematical models derived from theoretical physics, markets remain inherently unpredictable. No mathematical model, regardless of sophistication, can guarantee future results. This strategy uses realistic commission ($0.62 per contract) and slippage (1 tick) in all calculations. Past performance does not guarantee future results. Always use appropriate risk management and never risk more than you can afford to lose.
🌟 CONCLUSION
The Anomalous Holonomy Field Theory represents a quantum leap in technical analysis - literally. By applying the profound insights of differential geometry, quantum field theory, and gauge theory to market analysis, AHFT reveals structure and opportunities invisible to traditional methods.
From the holonomy calculations that capture market memory to the anomaly detection that identifies phase transitions, from the adaptive intelligence that learns and evolves to the stunning visualizations that make the invisible visible, every component works in mathematical harmony.
This is more than a trading strategy. It's a new lens through which to view market reality.
Trade with the precision of physics. Trade with the power of mathematics. Trade with AHFT.
I hope this serves as a good replacement for Quantum Edge Pro - Adaptive AI until I'm able to fix it.
— Dskyz, Trade with insight. Trade with anticipation.

Donchian x WMA Crossover (2025 Only, Adjustable TP, Real OHLC)Short Description:
Long-only breakout system that goes long when the Donchian Low crosses up through a Weighted Moving Average, and closes when it crosses back down (with an optional take-profit), restricted to calendar year 2025. All signals use the instrument’s true OHLC data (even on Heikin-Ashi charts), start with 1 000 AUD of capital, and deploy 100 % equity per trade.
Ideal parameters configured for Temple & Webster on ASX 30 minute candles. Adjust parameter to suit however best to download candle interval data and have GPT test the pine script for optimum parameters for your trading symbol.
Detailed Description
1. Strategy Concept
This strategy captures trend-driven breakouts off the bottom of a Donchian channel. By combining the Donchian Low with a WMA filter, it aims to:
Enter when volatility compresses and price breaks above the recent Donchian Low while the longer‐term WMA confirms upward momentum.
Exit when price falls back below that same WMA (i.e. when the Donchian Low crosses back down through WMA), but only if the WMA itself has stopped rising.
Optional Take-Profit: you can specify a profit target in decimal form (e.g. 0.01 = 1 %).
2. Timeframe & Universe
In-sample period: only bars stamped between Jan 1 2025 00:00 UTC and Dec 31 2025 23:59 UTC are considered.
Any resolution (e.g. 30 m, 1 h, D, etc.) is supported—just set your preferred timeframe in the TradingView UI.
3. True-Price Execution
All indicator calculations (Donchian Low, WMA, crossover checks, take-profit) are sourced from the chart’s underlying OHLC via request.security(). This guarantees that:
You can view Heikin-Ashi or other styled candles, but your strategy will execute on the real OHLC bars.
Chart styling never suppresses or distorts your backtest results.
4. Position Sizing & Equity
Initial capital: 1 000 AUD
Size per trade: 100 % of available equity
No pyramiding: one open position at a time
5. Inputs (all exposed in the “Inputs” tab):
Input Default Description
Donchian Length 7 Number of bars to calculate the Donchian channel low
WMA Length 62 Period of the Weighted Moving Average filter
Take Profit (decimal) 0.01 Exit when price ≥ entry × (1 + take_profit_perc)
6. How It Works
Donchian Low: ta.lowest(low, DonchianLength) over the specified look-back.
WMA: ta.wma(close, WMALength) applied to true closes.
Entry: ta.crossover(DonchianLow, WMA) AND barTime ∈ 2025.
Exit:
Cross-down exit: ta.crossunder(DonchianLow, WMA) and WMA is not rising (i.e. momentum has stalled).
Take-profit exit: price ≥ entry × (1 + take_profit_perc).
Calendar exit: barTime falls outside 2025.
7. Usage Notes
After adding to your chart, open the Strategy Tester tab to review performance metrics, list of trades, equity curve, etc.
You can toggle your chart to Heikin-Ashi for visual clarity without affecting execution, thanks to the real-OHLC calls.

Grid Tendence V1The “Grid Tendence V1” strategy is based on the classic Grid strategy, only in this case the entries and exits are made in favor of the trend, which allows to take advantage of large movements to maximize profits, since it is also possible to enter and exit with the balance with a controlled risk, because precisely the distance between each Grid works as a natural and adaptable stop loss and take profit. This fact helps to avoid overlapping entries and exits that would result from using stop loss and take profit as limit orders.
In this version of the script the entries and exits are always at market, and based on the percentage change of the price, not on the profit or loss of the current position.
The user will notice that the strategy setup is based on a controlled risk, risking 5% on each trade, a fairly standard commission and a modest initial capital, all this in order to protect the user of the strategy from unexpected or unrealistic results.
However, it is always recommended to optimize the parameters so that the strategy is effective for each asset and for each time frame.

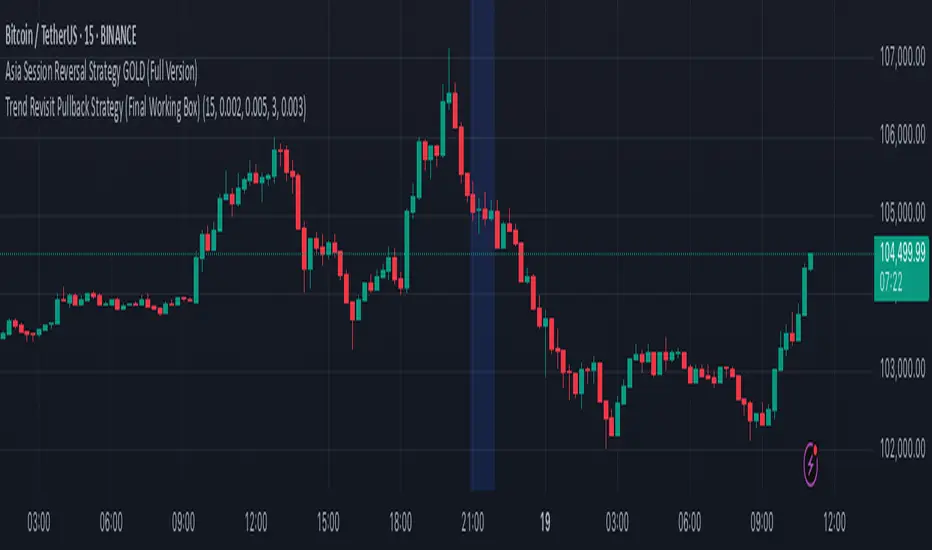
Trend Revisit Pullback Strategy (Final Working Box)📈 Trend Revisit Pullback Strategy
This TradingView Pine Script strategy identifies strong trend breakouts and accounts for natural pullbacks by:
Entering long or short on strong 1-bar breakouts
Allowing for pullback averaging if price retraces after entry
Expecting a revisit to the original entry price within 15 bars
Automatically exiting at break-even or using a custom TP/SL
Drawing a visual trade zone (entry → SL → revisit window) for easy reference
Optional labels and color-coded boxes to track each trade’s lifecycle
Ideal for trend traders who anticipate a pullback and prefer to manage risk with break-even exits or reward-to-risk parameters.
Hybrid: RSI + Breakout + DashboardHybrid RSI + Breakout Strategy
Adaptive trading system that switches modes based on market regime:
Ranging: Buys when RSI < 30 and sells when RSI > 70.
Trending: Enters momentum breakouts only in the direction of the 200-EMA bias, with ADX confirming trend strength.
Risk Management: Trailing stop locks profits and caps drawdown.
Optimized for BTC, ETH, and SOL on 1 h–1 D charts; back-tested from 2017 onward. Educational use only—run your own tests before deploying live funds.
