Session Liquidity Sweep + Trend ConfirmationThis strategy aims to capture high-probability intraday trades by combining liquidity sweeps with a trend confirmation filter. It is designed for traders who want a systematic approach to trade breakouts during specific market sessions while controlling risk with ATR-based stops.
How it Works:
Session Filter: Trades are only considered during a defined session (default 9:30 - 11:00). This helps avoid low-volume periods that can lead to false signals.
Trend Confirmation: The strategy uses a 50-period EMA to identify the market trend. Long trades are only taken in an uptrend, and short trades in a downtrend.
Liquidity Sweep Detection:
A long entry occurs when price dips below the prior N-bar low but closes back above it, indicating a potential liquidity sweep that stops being triggered before the trend continues upward.
A short entry occurs when price spikes above the prior N-bar high but closes below it, signaling a potential sweep of stops before the downward trend resumes.
ATR-Based Risk Management:
Stop loss is calculated using the Average True Range (ATR) multiplied by a configurable factor (default 1.5).
Take profit is set based on a risk-reward ratio (default 2.5x).
Position Sizing: Default position size is 5% of equity per trade, making it suitable for risk-conscious trading.
Inputs:
Session Start/End (HHMM)
Liquidity Lookback Period (number of bars to define prior high/low)
ATR Length for stop calculation
ATR Stop Multiplier
Risk-Reward Ratio
EMA Trend Filter Length
Visuals:
Prior Liquidity High (red)
Prior Liquidity Low (green)
EMA Trend (blue)
Why Use This Strategy:
Captures stop-hunt moves often triggered by larger market participants.
Only trades with trend confirmation, reducing false signals.
Provides automatic ATR-based stop loss and take profit for consistent risk management.
Easy to adjust session time, ATR, EMA length, and risk-reward to suit your trading style.
Important Notes:
Assumes 0.05% commission and 1-pip slippage. Adjust according to your broker.
Not financial advice; intended for educational, backtesting, or paper trading purposes.
Always test strategies thoroughly before applying to live accounts.
Cerca negli script per "trend"

Big Trend Catcher: Quad-Gate & VCP & ATR trailing Swing TradeThe Strategy Philosophy
This is designed for Daily Charts to capture the large chunks if not all of a primary trend. It focuses on the "VCP" (Volatility Contraction Pattern), combined with high-grade momentum filtering.
1. How VCP (The Quiet Zone) is Calculated
The script identifies "Volatility Contraction" by measuring the Bollinger Band Width (BBW).
* The Math: It calculates the standard BBW: $(Upper Band - Lower Band) / Mid Band$.
* The "Quiet" Threshold: It compares the current width to its own 50-period Simple Moving Average.
* The Signal: When the current width is narrower than the 50-period average, the stock is in a "Quiet Zone" (represented by the blue background). This indicates energy is coiling for a potential breakout.
2. How Rate of Change (ROC) is Calculated
Unlike a standard ROC, this "Wizard" version uses a smoothed momentum filter to reduce whipsaws:
* Raw ROC: First, it calculates the raw percentage change over 15 bars: $100 x (Close / Close(15) - 1).
* Smoothing: This raw value is then smoothed using a 10-period EMA.
* The Gate: The ROC Gate only turns green when this smoothed value is greater or equal to 0, ensuring the stock has genuine upward velocity before you enter.
3. What the Indicators on the Chart Show
* Yellow Line (20 EMA): Your "Tactical Line." It tracks short-term momentum and acts as a trigger for Phoenix re-entries.
* Blue/Gray Line (100 EMA): Your "Regime Filter." It turns Blue when the trend slope is positive and Gray when negative.
* Thin Gray Outer Bands: These are Bollinger Bands set at 3 Standard Deviations from the 100 EMA. They mark extreme "Climax Zones" where price is statistically overextended.
* Stepped Red/Green Line (ATR Stop): The "Iron Floor." It uses a 20-period ATR with a 3.0 multiplier and an HHV (Highest High Value) lookback to ensure the stop only moves up, never down.
* Yellow Crosses (Gate Wait): These small icons appear above the bars when a signal has been detected but one or more "Wizard Gates" (such as the ROC or 100 EMA Slope) are not yet satisfied, signifying the strategy is waiting for full confirmation.
4. How to Trade This Strategy
* Step 1: The Setup: Look for the Blue Background on the daily chart, signifying a Volatility Contraction.
* Step 2: The Entry: An Initial Entry (Lime Triangle) fires when the price breaks out of the Quiet Zone with a volume spike. This volume must be greater than 1.3 times the 20-period Simple Moving Average of volume to confirm significant buying interest. An entry only occurs when all Quad-Gates (ROC, EMA Slope, Price > ATR) are satisfied.
* Step 3: Pyramiding: If the trend gains "Velocity" (price > 10% from entry), the script will signal a second unit to maximize gains during runaway moves.
* Step 4: The Exit: Sell the entire position if the price closes below the ATR Trailing Stop (Trend Death) or if the 100 EMA trend turns down.
5. The Phoenix Re-entry
If you are stopped out but the stock immediately recovers above the 20 EMA within 10 bars, a Phoenix Entry (Orange Triangle) will fire. This allows you to catch "Power Resumptions" where the initial shakeout was a bear trap.

Simple Trend Context [Wall_Journey]Simple Trend Context MA: Dynamic Market Bias Visualizer
Overview The Simple Trend Context MA is a visual-oriented trading tool designed to identify the prevailing market trend at a glance. By utilizing two Simple Moving Averages (Fast and Slow), this script provides a clear "Context" for your trades, helping you avoid trading against the primary momentum.
How it Works The indicator calculates two key SMA periods:
Fast MA (Default: 20) : Captures short-term momentum.
Slow MA (Default: 50) : Represents the broader trend direction.
Key Features
Dynamic Background Shading: The chart background automatically changes color based on the trend. A Green background indicates a Bullish trend (Fast MA > Slow MA), while a Red background indicates a Bearish trend (Fast MA < Slow MA).
Real-time Trend Label: A dynamic label appears on the most recent bar, explicitly stating the current market context (Bullish, Bearish, or Neutral).
Highly Customizable: You can easily adjust the MA lengths to suit your specific strategy, whether you are scalping or swing trading.
Why use this? Many traders fail because they lose sight of the "Big Picture." This script ensures that the trend context is always visible, serving as a powerful filter for your entry signals.

Table - Trend Multi TF+RSI+Stoch-ByBankTHTable
Trend+RSI+Stoch
---------------------------------------

Volume-Confirmed Trend Thrust IndicatorOVERVIEW
This indicator combines trend strength, momentum & volume analysis to generate high-conviction buy and sell signals. It is based on the "Volume Confirmation for a Trend System" (VCTS) by Buff Pelz Dormeier (TASC August 2024), which I have taken the liberty of 'buffing up' (heh!) by swapping out original VPCI component with the ATR-aware Net Accumulation Flow (NAF) indicator derived from Markos Katsanos' VPN indicator (TASC April 2021).
The result is a system that only triggers buy signals when three independent conditions align:
• A strong trend exists (ADX)
• Momentum is bullish (TTI)
• Institutional accumulation is detected (NAF)
━━━━━━━━━━━━━━━━━━━━━━━━━━━━━━━━━━━━━━━━━━
COMPONENTS
█ ADX (Average Directional Index)
Measures trend strength regardless of direction. A reading above 30 indicates a strong trend worth trading. This filter prevents signals during choppy, sideways markets.
█ TTI (Trend Thrust Indicator)
Dormeier's volume-weighted MACD variant that provides momentum direction. Unlike standard MACD, TTI uses Volume-Weighted Moving Averages (VWMA) and applies a volume multiplier that amplifies signals when volume confirms price movement. When TTI crosses above its signal line, momentum is considered bullish.
█ NAF (Net Accumulation Flow)
The key enhancement - in my humble opinion - over the original VCTS. NAF classifies each bar's volume as:
• Accumulation: Price moved UP more than 10% of ATR
• Distribution: Price moved DOWN more than 10% of ATR
• Neutral: Price movement too small to be meaningful (filtered as noise)
NAF then calculates the net flow (Accumulation Volume - Distribution Volume) over a 30-bar lookback period, normalized and smoothed. This provides a cleaner read on whether institutions are accumulating or distributing.
Perceived benefits of NAF:
• ATR-based noise filtering eliminates false readings from small price movements
• Rolling 30-bar accumulation captures sustained institutional activity
• Empirically calibrated thresholds based on 717 stocks / 360,000 observations
• 3-period EMA smoothing reduces whipsaws
━━━━━━━━━━━━━━━━━━━━━━━━━━━━━━━━━━━━━━━━━━
SIGNAL LOGIC
🟢 BUY SIGNAL
All three conditions must be true simultaneously:
1. ADX > 30 (strong trend)
2. TTI > Signal Line (bullish momentum)
3. NAF > 16 (accumulation)
Signals fire on the first bar where all conditions align, preventing repeated signals during sustained bullish periods.
🔴 SELL SIGNAL
Exit when volume flow turns negative:
• NAF < -9 (below neutral zone, indicating distribution).
This indicator retains Dormeier's asymmetric approach (strict entry, quick exit) to help protect profits when institutional support fades.
━━━━━━━━━━━━━━━━━━━━━━━━━━━━━━━━━━━━━━━━━━
NAF THRESHOLD REFERENCE
Based on proprietary empirical calibration (717 stocks, 360K observations):
>= +35 │ Strong Accumulation (P95, ~5% of days)
>= +28 │ Solid Accumulation (P90, ~10% of days)
>= +16 │ Moderate Accumulation (P75) ← Default Buy Threshold
-9 to +16 │ Neutral Zone (~50% of days)
<= -9 │ Below Neutral ← Default Sell Threshold
<= -22 │ Solid Distribution (P10)
<= -29 │ Strong Distribution (P5)
━━━━━━━━━━━━━━━━━━━━━━━━━━━━━━━━━━━━━━━━━━━
SETTINGS
Setting for all 3 variables (ADX, TTI & NAF), alerts and visual conditional formatting are configurable.
━━━━━━━━━━━━━━━━━━━━━━━━━━━━━━━━━━━━━━━━━━━
USAGE TIPS
1. Works best on daily timeframe for swing trading
2. More effective on liquid stocks where volume data is meaningful
3. Consider using NAF threshold of 28 (P90) for higher conviction entries
5. Combine with price action analysis (support/resistance, RS, chart patterns)
━━━━━━━━━━━━━━━━━━━━━━━━━━━━━━━━━━━━━━━━━━━
MAXIMUM RESPECT:
• VCTS (ADX + TTI + VPCI): Buff Pelz Dormeier, "Volume Confirmation For A Trend System", Technical Analysis of Stocks & Commodities (TASC), August 2024. Pine Script adaptation: PineCoders.
• VPN / NAF: Markos Katsanos, Technical Analysis of Stocks & Commodities (TASC), April 2021. Pine Script adaptation: LevelUp/John Muchow.
━━━━━━━━━━━━━━━━━━━━━━━━━━━━━━━━━━━━━━━━━━━
DISCLAIMER
This indicator is for educational and informational purposes only. It does not constitute financial advice. Past performance is not indicative of future results. Always conduct your own analysis and consider your risk tolerance before making trading decisions. Use appropriate position sizing and stop-loss orders to manage risk.

HA Trend Reclaim Daily Structure Pullback🔹 HA Trend Reclaim — Daily Structure Pullback System
HA Trend Reclaim is a professional-grade trend continuation indicator designed to highlight high-probability LONG and SHORT setups using a combination of:
Heikin Ashi candle structure
EMA trend alignment (9 & 50 EMA)
Daily High / Low market structure
Pullback → momentum reclaim logic
This indicator is built for traders who want clarity, discipline, and structure, not noise or over-signaling.
It focuses on trading with the dominant trend, entering only after price pulls back and confirms strength via momentum reclaim.
🔑 What Makes This Different
✔ No counter-trend signals
✔ No breakout chasing
✔ Built-in structure awareness
✔ Clear visual entries & risk levels
✔ Works across stocks, crypto, and futures
This script is ideal for traders who prefer fewer, higher-quality trades rather than constant signals.
2️⃣ HOW TO USE (FEATURED-FRIENDLY VERSION)
🟢 LONG Conditions
A LONG signal appears when:
EMA 9 is above EMA 50
Price is above EMA 50
Price pulls back into the EMA zone
Price reclaims EMA 9 upward
Heikin Ashi candle closes bullish (not a doji)
🔴 SHORT Conditions
A SHORT signal appears when:
EMA 9 is below EMA 50
Price is below EMA 50
Price pulls back into the EMA zone
Price reclaims EMA 9 downward
Heikin Ashi candle closes bearish (not a doji)
📦 Daily Structure Boxes
The indicator highlights the daily high–low range:
Green box → bullish daily bias
Red box → bearish daily bias
These boxes help traders avoid:
Mid-range chop
Late entries
Trading against daily momentum
3️⃣ BEST SETTINGS (VERY IMPORTANT FOR USERS)
Recommended Timeframes
Stocks: 5m, 15m, 1H
Crypto: 15m, 1H, 4H
Futures: 5m, 15m
Recommended Inputs
Setting Value
EMA Fast 9
EMA Slow 50
Swing Lookback 15
Runner RR 2.0
Heikin Ashi Enabled
Show Daily Boxes Enabled
Notes
Higher timeframes = fewer, stronger signals
Avoid low-liquidity instruments
Best used during active sessions (London / NY)

Dynamic EMA Trend Table [Customizable]Overview
The Dynamic EMA Trend Table is a comprehensive dashboard designed to give traders an instant overview of the market trend across five distinct Exponential Moving Averages (EMAs). Instead of cluttering your chart with multiple lines, this script organizes the data into a clean, customizable table, allowing you to assess trend alignment at a glance.
How It Works
This indicator calculates five user-defined EMAs (defaulting to the popular 5, 20, 50, 100, and 200 periods). It then compares the Current Price against each EMA value to determine the immediate trend status:
Bullish State: When the current price is above the specific EMA, the table cell turns Green (customizable).
Bearish State: When the current price is below the specific EMA, the table cell turns Red (customizable).
This logic allows swing traders and scalpers to instantly see if the asset is in a strong uptrend (all cells Green), a strong downtrend (all cells Red), or a consolidation phase (mixed colors).
Key Features
Fully Customizable Periods: Change the length of all 5 EMAs to fit your specific strategy (e.g., Fibonacci numbers or standard Swing Trading settings).
Dynamic UI: Position the table anywhere on the screen (Top/Bottom/Left/Right) and adjust the size to fit your screen resolution.
Visual Cleanliness: You can choose to show the table only, or toggle the "Show EMAs on Chart" option to plot the actual lines on your chart.
Smart Coloring: The lines on the chart (if enabled) inherit the same color logic as the table—turning Green when price is above them and Red when price is below.
Settings & Configuration
Price Source: Select Close, High, Low, etc. (Default is Close).
Table Position & Size: Customize where the dashboard appears.
EMA Lengths: Set your 5 preferred lookback periods.
Color Theme: Fully adjustable colors for Bullish, Bearish, Neutral, and Background elements to match your chart theme (Dark/Light mode friendly).
Use Case Example
Trend Confirmation: A trader looking for a "Buy" entry might wait for the short-term EMAs (5 and 20) and the medium-term EMA (50) to all turn Green in the table before entering.
Support/Resistance Watch: By quickly glancing at the values in the table, you can see exactly where the 200 EMA sits without needing to scroll back on your chart to find the line.

Witch-Fire ALMA signals: Dynamic Liquidity & Trend GlowThe Witch-Fire ALMA is a high-precision trend bias and liquidity mapping tool designed for price action traders and Smart Money practitioners. Unlike traditional indicators that clutter your chart with lagging signals, this script provides a "clean-yet-powerful" visual anchor to help you stay on the right side of the market while identifying key Points of Interest (POIs).
At its core, the script utilizes an optimized Arnaud Legoux Moving Average (ALMA). Known for its superior ability to balance smoothness and responsiveness, the ALMA effectively filters out market noise and "whipsaws" that often plague standard EMAs.
Key Features:
The Witch-Fire Glow: A neon-styled ALMA line that shifts between Bullish Green and Bearish Red. The white core provides surgical precision for price intersection, while the outer glow visualizes the strength and dominance of the current trend.
Scaled Liquidity Levels: Automatically maps Buy Side Liquidity (BSL) and Sell Side Liquidity (SSL). These levels are dynamic—they scale proportionally with your ALMA settings. This ensures that the liquidity zones you see are always relevant to the trend cycle you are analyzing.
Strategic Bias Background: A subtle background tint provides an instant psychological filter. Only look for Longs in the green zone and Shorts in the red zone to maintain a high-probability strike rate.
How to Trade with Witch-Fire:
Identify the Bias: Look at the Fire ALMA. If the "fire" is red and the price is below the line, your bias is strictly bearish.
Watch the Sweeps: Wait for the price to "sweep" (pierce with a wick) the horizontal SSL (Green) or BSL (Red) lines.
Execution: Look for a strong rejection candle (long wick, small body) at these levels that closes back towards the ALMA line.
Best Used On: 15m, 1H, and 4H timeframes. Works exceptionally well for Crypto, Forex, and Indices.

SilverHawk Trend Flow Part of SilverHawk Suite
This script is designed to be used with the SilverHawk Suite workflow (context → trigger → confirmation → execution).
It works standalone, but the highest accuracy comes from using the full suite together.
Where it fits:
• Role: Context
What it does:
Colors candles based on detected trend regime, so you trade with the prevailing direction and avoid fighting structure.
How to use:
• Bullish color: prefer long triggers only
• Bearish color: prefer short triggers only
• No clear trend / transition: stand down and wait for the suite trigger + confirmation
Visual Tip: (important)
If candles look “hidden”: Settings → Visual Order → Bring To Front
Alerts:
New Up Trend / New Down Trend alerts trigger on confirmed candles (non-repainting style).
Suite note:
For full workflow and loadouts, start with: “SilverHawk Suite — Start Here (Workflow Guide)” (free)
Credits / License
Based on PhantomFlow Trend Detector (MPL-2.0). This script remains MPL-2.0.

Trend Consensus Engine [TCE]The Trend Consensus Engine (TCE) is a comprehensive market analysis system designed to filter out noise and provide a quantifiable "Trend Score" (0-100). Instead of relying on a single indicator, this script aggregates data from multiple market factors—volatility, momentum, and trend structure—to generate high-probability entry signals based on a consensus logic.
This tool is particularly optimized for Crypto (with specific time-gated logic) and BIST (Borsa Istanbul) markets, allowing traders to see the overall health of the trend at a glance via a dashboard.
How It Works
The engine calculates a composite "Total Score" (0-100) derived from four weighted components:
Trend Structure (AlphaTrend & Guppy):
Analyzes the slope and position relative to the AlphaTrend (Credit to @KivancOzbilgic) and Guppy Multiple Moving Averages (GMMA).
Positive slopes and price action above key levels add points to the score.
Volatility & Momentum (Squeeze & ADX):
Incorporates the Squeeze Momentum logic (Credit to @LazyBear) to detect explosive moves.
ADX Filter: Filters out chopping/ranging markets. If the ADX is too low, the score is penalized or the signal is blocked.
Dynamic Resistance (MA Channels):
Uses a combination of Donchian Mid-Lines and SMAs to determine if the price is in a "safe zone" or hitting resistance.
Price Action Filters (Pinbar Veto):
Automatically detects bearish "Shooting Star" or weak candles at highs. If a bearish pinbar is detected, the entry signal is vetoed regardless of the trend score.
Features & Settings
Smart Scoring Dashboard: Displays the realtime Score, Instant Decision, and confirmed Close Decision on the chart.
Market Profiles:
Crypto Mode: Includes a "Time Gate" feature (07:00 UTC+3 check) to prevent fakeouts during low-liquidity hours.
BIST Mode: Optimized parameters for the Turkish stock market logic (14:00 session checks).
Score Threshold: Users can adjust the minimum score required (Default: 70) to trigger a "BUY" signal.
Visual Guidance: The background of the dashboard changes color (Green/Red/Yellow) based on the consensus.
How to Use
Check the Dashboard: Look at the "SONUÇ" (Result) row.
GİRİŞ ✅ (ENTRY): The Score is above 70, Momentum is positive, and no Bearish Pinbars are present.
BEKLE ⏳ (WAIT): The trend is weak, or a filter (like ADX or Squeeze) is blocking the trade.
Confirm with Price Action: Use the AlphaTrend lines (Blue/Red) as dynamic support/stop-loss levels.
Credits:
AlphaTrend by KivancOzbilgic
Squeeze Momentum Indicator by LazyBear
VuManChu Cipher concepts for inspiration.
Custom Logic: Scoring algorithm and Time-Gating mechanisms are original custom developments.
Disclaimer: This tool is for educational purposes only and does not constitute financial advice.

Pivot Trend [ChartPrime]The Pivot Trend indicator is a tool designed to identify potential trend reversals based on pivot points in the price action. It helps traders spot shifts in market sentiment and anticipate changes in price direction.
◈ User Inputs:
Left Bars: Specifies the number of bars to the left of the current bar to consider when calculating pivot points.
Right Bars: Specifies the number of bars to the right of the current bar to consider when calculating pivot points.
Offset: Adjusts the sensitivity of pivot point detection.
◈ Indicator Calculation:
The indicator calculates pivot points based on the highest and lowest prices within a specified range of bars. It then determines the trend direction based on whether the current price crossed above upper band or crossed below lower band.
Upper and Lower Bands
◈ Visualization:
Trend direction is indicated by the color of the plotted lines, with blue representing an upward trend and red representing a downward trend.
Buy and sell signals are marked on the chart with corresponding symbols (🅑 for buy signals and 🅢 for sell signals).
Buy and sell signals generated by the indicator can be used in conjunction with other technical analysis tools to confirm trading decisions and manage risk.
Overall, the Pivot Trend indicator offers traders a simple yet effective method for identifying potential trend changes and capturing trading opportunities in the market. Adjusting the input parameters allows for customization according to individual trading preferences and market conditions.

PVV StochRSI TrendAnother Price, Volume, Volatility Trend indicator. This one has an RSI factor to it.
Have fun and change what you want.
Adjusting the inputs to the timeframe traded on is encouraged.

Trend Follow Line Point📌 Trend Follow Line Point
The Trend Follow Line Point indicator removes the confusing, repainting-based swing connections commonly found in traditional swing tools.
It maintains consistent swing-point calculation, keeps structural swing lines intact even when trend lines are broken, and integrates market structure + trend + volatility + volume into one intuitive, visual indicator.
This tool is designed for:
Trend Following
Swing Structure Analysis
Volatility-Based Entry & Exit
Market Strength Evaluation
📊 Component Explanation
🔹 1. Swing High / Swing Low Detection
Based on the user-defined sensitivity (swgLen):
A Swing High forms when the current high exceeds the previous swgLen highs.
A Swing Low forms when the current low falls below the previous swgLen lows.
🔹 2. Swing-Based Structure Lines
Connect Swing Highs → Structural visualization
Connect Swing Lows → Structural visualization
These lines reveal the underlying market structure without repainting or disappearing unexpectedly.
🔹 3. Dynamic ATR + Volume Weighting
ATR values combined with the volume ratio (vol / volMA) create a dynamic volatility channel that reflects real-time market pressure.
🔹 4. Enhanced SuperTrend Calculation
Uses ATR-based stability to produce more realistic and smoother trend lines, reducing noise and improving signal clarity.
🔹 5. Trend Color Mapping
Up Trend → User-selected color
Down Trend → User-selected color
Visual trend direction and strength can be identified immediately.
🧭 How to Use
When Swing Highs/Lows are detected, structure lines are automatically drawn between previous swings.
Use these lines to evaluate support/resistance breaks and overall structural direction.
Manage risk with volatility guidance:
Higher ATR (volume-weighted) → wider trend spacing → increased risk
Lower ATR → tighter spacing → reduced risk
This helps with position sizing, entry timing, and exit decisions.
+

Santhosh Zero lag Trend change AlertThis indicator alert whenever these is a change in trend direction. Change input to match with your Asset/Index. This works well in all time frame, I recommend this for Scalping and Position trading

Trend Breakout & Ratchet Stop System [Market Filter]Description:
This strategy implements a robust trend-following system designed to capture momentum moves while strictly managing downside risk through a multi-stage "Ratchet" exit mechanism and broad market filters.
It is designed for swing traders who want to align individual stock entries with the overall market direction.
How it works:
1. Market Regime Filters (The "Safety Check") Before taking any position, the strategy checks the health of the broader market to avoid "catching falling knives."
Broad Market Filter: By default, it checks NASDAQ:QQQ (adjustable). If the benchmark is trading below its SMA 200, the strategy assumes a Bear Market and suppresses all new long entries.
Volatility Filter (VIX): Uses CBOE:VIX to gauge fear. If the VIX is above a specific threshold (Default: 32), entries are paused, and existing positions can optionally be closed to preserve capital.
2. Entry Logic Entries are based on Momentum and Trend confirmation. A position is opened if filters are clear AND one of the following occurs:
Golden Cross: SMA 25 crosses over SMA 50.
SMA Breakouts: A "Three-Bar-Break" logic confirms a breakout above the SMA 50, 100, or 200 (price must establish itself above the moving average).
3. The "Ratchet" Exit System The exit logic evolves as the trade progresses, tightening risk like a ratchet:
Stage 0 (Initial Risk): Starts with a standard percentage Stop Loss from the entry price.
Stage 1 (Breakeven/Lock): Once the price rises by Profit Step 1 (e.g., +10%), the Stop Loss jumps to a tighter level and locks there. This secures the initial move.
Stage 2 (Trailing Mode): If the price continues to rise to Profit Step 2 (e.g., +15%), the Stop Loss converts into a dynamic Trailing Stop relative to the Highest High. This allows the trade to run as long as the trend persists.
Additional Exits:
Dead Cross: Closes position if SMA 25 crosses under SMA 50.
VIX Panic: Emergency exit if volatility spikes above the threshold.
Settings & Customization:
SMAs: Adjustable lengths for all Moving Averages.
Filters: Toggle Market/VIX filters on/off and choose your benchmark ticker (e.g., SPY or QQQ).
Risk Management: Fully customizable percentages for the Ratchet steps (Initial SL, Stage 1 Trigger, Trailing distance).

ZFX Prime Trend Matrix PRO – Zumiko FX📌 ZFX Prime Trend Matrix PRO – Zumiko FX
ZFX Prime Trend Matrix PRO is a multi-timeframe trend dashboard designed by Zumiko FX to give traders an instant, complete market overview.
It analyzes six key timeframes simultaneously and displays trend direction, band positioning, momentum, volatility and alignment — all in one clean, horizontal table.
This matrix is made to simplify decision-making and help traders instantly identify when multiple timeframes agree on a market direction.
🔹 What the Matrix Shows
The dashboard updates in real time and displays:
1. Trend Direction
UP / DOWN / Neutral for each timeframe (M1, M5, M15, H1, H4, D1).
2. Bands Position (Prime Bands)
Shows whether price is:
Above Fast Band
Below Fast Band
Above Slow Band
Below Slow Band
Inside range
Perfect for spotting breakouts and trend continuation zones.
3. RSI (Momentum Strength)
Color-coded RSI readings help detect overbought/oversold and neutral momentum.
4. Stochastic (Timing Tool)
Reads market timing with Stoch K/D movements.
Highlights when a trend aligns with momentum.
5. ATR Bias
Instant view of volatility pressure:
LONG
SHORT
Neutral
Great for filtering entries.
6. HTF Alignment
Shows whether each timeframe is aligned with the next higher timeframe.
A powerful trend continuation filter used by advanced traders.
7. Trading Signal Zone
Final synthesised signal:
BUY ZONE → Strong bullish alignment
SELL ZONE → Strong bearish alignment
NO TRADE → Conditions not optimal
This allows traders to quickly identify “green light” moments across the trend structure.
🔹 Why This Matrix Is Powerful
✔ Shows 6 timeframes at once
✔ Helps confirm entries from other indicators
✔ Reveals hidden contradictions in trend
✔ Perfect for scalpers and day traders who need fast confirmation
✔ Works with any strategy as a high-level filter
✔ Clean, minimalistic, professional UI
🔹 Who Is It For?
Scalpers
Day traders
Swing traders
Traders using trend-following strategies
Traders who want a clean, high-level overview
🔹 About Zumiko FX
Developed by Zumiko FX, known for precision-based systems and advanced multi-timeframe tools for serious traders.

MOMO – Imbalance Trend (SIMPLE BUY/SELL)MOMO – Imbalance Trend (SIMPLE BUY/SELL)
This strategy combines trend breaks, imbalance detection, and first-tap supply/demand entries to create a clean and disciplined trading model.
It automatically highlights imbalance candles, draws fresh zones, and waits for the first retest to deliver precise BUY and SELL signals.
Performance
On optimized settings, this strategy shows an estimated 57%–70% win-rate, depending on the asset and timeframe.
Actual performance may vary, but the model is built for consistency, discipline, and improved decision-making.
How it works
Detects trend structure shifts (BOS / Break of Trend)
Identifies displacement (imbalance) candles
Creates supply and demand zones from imbalance origin
Waits for first tap only (no second chances)
Confirms direction using trend logic
Generates clean BUY/SELL arrows
Automatic SL/TP based on user settings
Features
Clean BUY/SELL markers
Auto-drawn supply & demand zones
Trend break markers
Imbalance tags
Smart first-tap confirmation
Customizable stop loss & take profit
Works on crypto, gold, forex, indices
Best on M5–H1 for day trading
Note
This strategy is designed for day traders who want clarity, structure, and zero emotional trading.
Use it with discipline — and it will serve you well.
Good luck, soldier.

Multi Market Structure TrendOVERVIEW
Multi Market Structure Trend is a multi-layered market structure analyzer that detects trend shifts across five independent pivot-based structures . Each pivot uses a different lookback length, offering a comprehensive view of structural momentum from short-term to long-term.
The indicator visually displays the net trend direction using colored candlesticks and a dynamic gauge that tracks how many of the 5 market structure layers are currently bullish or bearish.
⯁ STRUCTURE TRACKING SYSTEM
The indicator tracks five separate market structure layers in parallel using pivot-based breakouts. Each one can be individually enabled or disabled.
Each structure works as follows:
A bullish MSB (Market Structure Break) occurs when price breaks above the most recent swing high.
A bearish MSB occurs when price breaks below the most recent swing low.
Structure breaks are plotted as horizontal lines and labeled with the number (1 to 5) corresponding to their pivot layer.
⯁ CANDLE COLOR GRADIENT SYSTEM
The indicator calculates the average directional bias from all enabled market structures to determine the current trend score.
Each structure contributes a score of +1 for bullish and -1 for bearish.
The total score ranges from -5 (all bearish) to +5 (all bullish) .
Candlesticks are colored using a smooth gradient:
Bright Green: Strong bullish trend (e.g., +5).
Orange: Neutral mixed trend (e.g., 0).
Red: Strong bearish trend (e.g., -5).
⯁ TREND GAUGE PANEL
Displayed at the middle-right side of the chart, the gauge shows the current trend strength in real time.
The bar consists of up to 10 gradient cells (5 up, 5 down).
Each active market structure pushes the score in one direction.
The central cell displays a numeric trend score:
+5 = All 5 market structures bullish
0 = Mixed/neutral trend
-5 = All 5 market structures bearish
Colors of the gauge bars match the candle gradient system.
⯁ USAGE
This indicator is highly effective for traders who want to:
Monitor short- and long-term structure shifts simultaneously on a single chart.
Use structure alignment as a trend confirmation tool — for example, waiting for at least 2 out of 5 structures to align before entering a trade.
Visually filter noise from different time horizons using the gauge and candle gradient.
Track CHoCH (Change of Character) transitions clearly and across multiple scales.
⯁ CONCLUSION
Multi Market Structure Trend offers a unique and powerful way to assess trend direction using stacked market structure logic. With five independently calculated structure layers, colored candle feedback, and a real-time trend gauge, traders can better time entries, filter noise, and confirm multi-timeframe alignment — all within a single chart overlay.

Trading Blueprint v7 Pro — VWAP-CVD, cPOC Trend MomentumTBv7 Pro is the advanced release of the Trading Blueprint framework — engineered for institutional-style intraday analysis that fuses VWAP location, CVD orderflow, composite profile bias, and momentum curvature into one cohesive system.
Core Framework
VWAP Structure → Adaptive mean anchored to session VWAP with ±1σ / ±2σ deviation envelopes for dynamic equilibrium detection.
vPOC per bar by ruckard ()
Anchored Volume Profile by DGT ()
CVD Orderflow Divergence → Smoothed delta histogram with fractal pivots identifying hidden absorption and exhaustion (patterns (Bull / Bear Div). Cumulative Volume Delta by AustrianTradingMachine )
cPOC Integration (2-Day Composite) by poopsnag (me :)→ Confirms true acceptance or rejection zones across sessions for precision bias alignment.
TMI (Trend Momentum Indicator by TradingRiot()) → Quantifies slope + mean crossover strength, providing actionable momentum confirmation (bullish / bearish support / divergence).
Bias Dashboard → Displays VWAP bias, numerical score, and dynamic color feedback for at-a-glance trade orientation.
Usage Context
Designed for professionals trading 15 m execution inside 1 h / 4 h context. Ideal for VWAP-cPOC location setups, reversion / continuation scalps, and orderflow confirmation using cumulative delta behavior.
🔧 Modules such as RSI / AO are pre-wired and easily activated for full Trading Blueprint confluence mapping.

FDF – Step 4 (Touch-21 + Trend/VWAP + Channel + Prev75% toggle)FDF — EMAs + VWAP Retest Entry System (A++ Signal Mode Compatible)
This indicator is designed for traders who follow a structured pullback and continuation entry method using the 9 EMA, 21 EMA, and VWAP as trend and momentum guides.
The system highlights high-probability retest entries when price pulls back into the EMA channel and shows strength in the direction of trend. It also includes optional A++ wick filters for traders who want to refine entries only to the strongest momentum candles.
Core Logic
A trade setup is identified when:
Trend is defined by the EMA alignment
• Long bias when EMA9 > EMA21
• Short bias when EMA9 < EMA21
Price retests the 21 EMA
• The candle must touch or cross the 21 EMA
• Designed to time pullbacks, not breakouts
Entry Confirmation
• Candle closes back in channel or breaks away in the trend direction
• Optional requirement: price must be on the correct side of VWAP for intraday trend alignment
A++ Wick Filter Mode (Optional)
Enable this mode to restrict entries to only high-dominance candles:
Dominant wick must exceed the opposing wick by a chosen percentage
Opposing wick can optionally be limited to a % of body size
Helps avoid weak, indecisive, or absorption candles
This mode is optional — turn it off to allow standard FDF entries.
Signals
When conditions are met, the script plots:
Green Triangle → Long entry signal
Red Triangle → Short entry signal
(Entries are plotted only after candle close to avoid repainting.)
Best Use
• Works on 5m / 15m / 1H intraday trend structures
• Pairs well with market structure + liquidity zones
• Designed for disciplined traders who wait for trend alignment and controlled pullbacks
Disclaimer
This tool is provided for educational and research purposes only.
It is not financial advice. Always test your setup and manage risk appropriately.

Trend Pullback System```{"variant":"standard","id":"36492","title":"Trend Pullback System Description"}
Trend Pullback System is a price-action trend continuation model that looks to enter on pullbacks, not breakouts. It’s designed to find high-quality long/short entries inside an already established trend, place the stop at meaningful structure, trail that stop as structure evolves, and warn you when the trade thesis is no longer valid.
Developed by: Mohammed Bedaiwi
---------------------------------
HOW IT WORKS
---------------------------------
1. Trend Detection
• The strategy defines overall bias using moving averages.
• Bullish environment (“uptrend”): price above the slower MA, fast MA above slow MA, and the slow MA is sloping up.
• Bearish environment (“downtrend”): price below the slower MA, fast MA below slow MA, and the slow MA is sloping down.
This prevents trading against chop and focuses on continuation moves in the dominant direction.
2. Pullback + Re-entry Logic
• The script waits for price to pull back into structure (support in an uptrend, resistance in a downtrend), and then push back in the direction of the main trend.
• That “push back” is the setup trigger. We don’t chase the first breakout candle — we buy/sell the retest + resume.
3. Structural Levels (“Diamonds”)
• Green diamond (below bar): bullish pivot low formed while the trend is bullish. This marks defended support.
- Use it as a re-entry zone for longs.
- Use it to trail a stop higher when you’re already long.
- Shorts can take profit here because buyers stepped in.
• Red diamond (above bar): bearish pivot high formed while the trend is bearish. This marks defended resistance.
- Use it as a re-entry zone for shorts.
- Use it to trail a stop lower when you’re already short.
- Longs can take profit here because sellers stepped in.
4. Entry Signals
• BUY arrow (green triangle up under the candle, text like “BUY” / “BUY Zone”):
- LongSetup is true.
- Trend is bullish or turning bullish.
- Price just bounced off recent defended support (green diamond) and reclaimed short-term momentum.
Meaning: enter long here or cover/exit shorts.
• SELL arrow (red triangle down above the candle):
- ShortSetup is true.
- Trend is bearish or turning bearish.
- Price just rolled down from defended resistance (red diamond) and lost short-term momentum.
Meaning: enter short here or take profit on longs.
These are the primary trade entries. They are meant to be actionable.
5. Weak Setups (“W” in yellow)
• Yellow triangle with “W”:
- A possible long/short idea is trying to form, BUT the higher-timeframe confirmation is not fully there yet.
- Think of it as early pressure / early caution, not a full signal.
• You usually watch these areas rather than jumping in immediately.
6. Exit Warning (orange “EXIT” label above a bar)
• The strategy will raise an EXIT marker when you’re in a trade and the *opposite* side just produced a confirmed setup.
- You’re short and a valid longSetup appears → EXIT.
- You’re long and a valid shortSetup appears → EXIT.
• This is basically: “Close or reduce — the other side just took control.”
• It’s not just a trailing stop hit; it’s a regime flip warning.
7. Stop, Target, and Trailing
• On every new setup, the script records:
- Initial stop: recent swing beyond the defended level (below support for longs, above resistance for shorts).
- Initial target: recent opposing swing.
• While you’re in position, if new confirming diamonds print in your favor, the stop can trail toward the new defended level.
• This creates structure-based risk management (not just fixed % or ATR).
8. Reference Levels
• The strategy also plots prior higher-timeframe closes (last week’s close, last month’s close, last year’s close). These can behave as magnets or stall points.
• They’re helpful for take-profit timing and for reading “are we trading above or below last month’s close?”
9. Momentum Panel (hidden by default)
• Internally, the script calculates an SMI-style momentum oscillator with overbought/oversold zones.
• This is optional visual confirmation and does not drive the core entry/exit logic.
---------------------------------
WHAT A TRADE LOOKS LIKE IN REAL PRICE ACTION
---------------------------------
Early warning
• Yellow W + red diamonds + red down arrows = “This is getting weak. Short setups are here.”
• You may also see something like “My Short Entry Id.” That’s where the short side actually engages.
Bearish follow-through, then exhaustion
• Price bleeds down.
• Then the orange EXIT appears.
→ Translation: “If you’re still short, close it. Buyers are stepping in hard. Risk of reversal is now high.”
Regime flip
• Right after EXIT, multiple green BUY arrows fire together (“BUY”, “BUYZone”).
• That’s the true long trigger.
→ This is where you either enter long or flip from short to long.
Expansion leg
• After that flip, price rips up for multiple candles / days / weeks.
• While it runs:
- Green diamonds appear under pullbacks → “dip buy zones / trail stop up here.”
- More BUY arrows show on minor pullbacks → continuation long / scale adds.
Distribution / topping
• Later, you start seeing new yellow W triangles again near local highs. That’s your “careful, this might be topping” warning.
• You finally get a hard red candle, and green diamonds stop stacking.
→ That’s where you tighten risk, scale out, or assume the move is mature.
In plain terms, the model is doing the following for you:
• It puts you short during weakness.
• It tells you when to get OUT of the short.
• It flips you long right as control changes.
• It gives you a structure-based trail the whole way up.
• It warns you again when momentum at the top starts cracking.
That is exactly how the logic was designed.
---------------------------------
QUICK INTERPRETATION CHEAT SHEET
---------------------------------
🔻 Red triangle + “Short Entry” near a red diamond
→ Short entry zone (or take profit on a long).
🟥 Red diamond above bar
→ Sellers defended here. Treat it as resistance. Good place to trail short stops just above that level. Avoid chasing longs straight into it.
🟨 Yellow W
→ Attention only. Early pressure / possible turn. Not fully confirmed.
🟧 EXIT (orange label)
→ The opposite side just printed a real setup. Close the old idea (cover shorts if you’re short, exit longs if you’re long). Thesis invalid.
🟩 Burst of green BUY triangles after EXIT
→ Long entry. Also a “cover shorts now” alert. This is the core money entry in bullish reversals.
💎 Green diamond below bar
→ Bulls defended that level. Good for trailing your long stop up, and good “buy the dip in trend” locations.
📈 Blue / teal MAs stacked and rising
→ Confirmed bullish structure. You’re in trend continuation mode, so dips are opportunities, not automatic exits.
---------------------------------
COLOR / SHAPE KEY
---------------------------------
• Green triangle up (“BUY”, “BUY Zone”):
Long entry / cover shorts / continuation long trigger.
• Red triangle down:
Short entry / take profit on longs / continuation short trigger.
• Orange “EXIT” label:
Opposite side just fired a real setup. The previous trade thesis is now invalid.
• Green diamond below price:
Bullish defended support in an uptrend. Use for dip buys, trailing stops on longs, and objective cover zones for shorts.
• Red diamond above price:
Bearish defended resistance in a downtrend. Use for re-entry shorts, trailing stops on shorts, and objective scale-out zones for longs.
• Yellow “W”:
Weak / early potential setup. Watch it, don’t blindly trust it.
• Moving average bands (fast MA, slow MA, Hull MA):
When stacked and rising, bullish control. When stacked and falling, bearish control.
---------------------------------
INTENT
---------------------------------
This system is built to:
• Trade with momentum, not against it.
• Enter on pullbacks into proven structure, not chase stretched breakouts.
• Automate stop/target logic around actual defended swing levels.
• Warn you when the other side takes over so you don’t give back gains.
Typical usage:
1. In an uptrend, wait for price to pull back, print a green diamond (support proved), then take the first BUY arrow that fires.
2. In a downtrend, wait for a bounce into resistance, print a red diamond (sellers proved), then take the first SELL arrow that fires.
3. Respect EXIT when it appears — that’s the model saying “this trade is done.”
---------------------------------
DISCLAIMER
---------------------------------
This script is for educational and research purposes only. It is not financial advice, investment advice, or a recommendation to buy or sell any security, cryptoasset, or derivative. Markets carry risk. Past performance does not guarantee future results. You are fully responsible for your own decisions, position sizing, risk management, and compliance with all applicable laws and regulations.

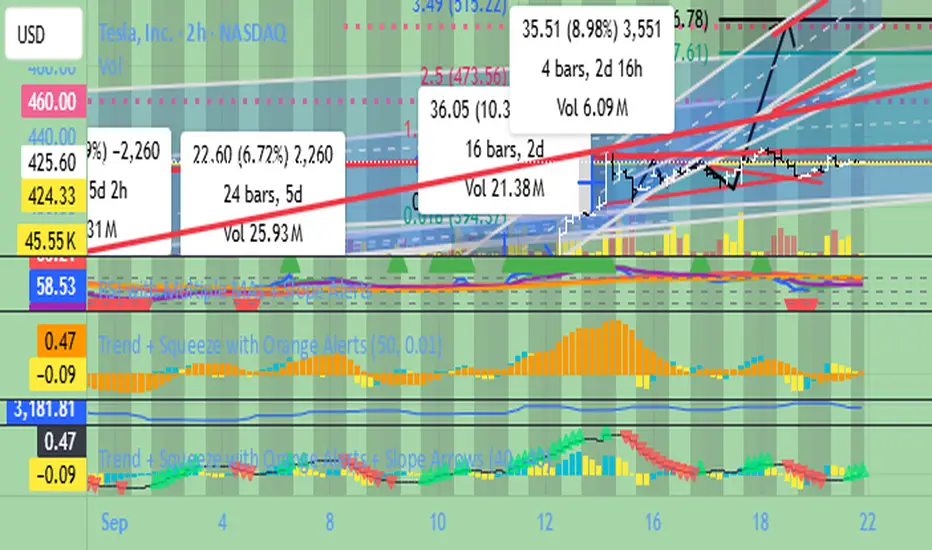
Trend + Squeeze High VolatilityGood for High Volatility Stocks and Options
Trend and Squeeze High Volatility
Good For High Volatility Stocks and Options
EMA-RSI-ADX Trend Bands
📌 EMA-RSI-ADX Trend Bands (ERA Trend Bands)
🔥 Overview
The ERA Trend Bands indicator combines Exponential Moving Average (EMA), Relative Strength Index (RSI), and Average Directional Index (ADX) into a powerful multi-factor trend system.
It helps traders:
Identify trend direction (Bullish / Bearish)
Measure trend strength using EMA deviation bands
Confirm momentum with RSI & ADX filters
Visualize conditions with dynamic colors, labels, tables, and signals
⚡ Key Features
📍 EMA Trend Bands
EMA100 with gradient glow effect showing trend bias
Strength bands around EMA (Very Weak → Hyper levels)
Bands color-coded for bullish/bearish extremes
📊 RSI + ADX Confluence
Bullish Signal: RSI ≥ threshold & ADX ≥ threshold → 🟢
Bearish Signal: RSI ≤ threshold & ADX ≤ threshold → 🔴
Candles recolored when conditions are met
Auto-generated labels show live RSI/ADX values
🧩 Strength Levels
Classifies deviation from EMA into 8 levels:
Neutral → Very Weak → Weak → Moderate → Strong → Very Strong → Extreme → Hyper
Dashboard table shows deviation % ranges & strength colors
Dynamic labels display Trend, Strength, Deviation %, RSI & ADX
🎨 Visual Enhancements
Gradient EMA line with glow effect
Bullish (greens) & bearish (reds) vibrant palettes
Background coloring (optional) based on strength
Symbols & labels for entry confirmation
🎯 How to Use
Trend Direction – EMA color + deviation bands show whether market is bullish or bearish.
Strength Confirmation – Use strength labels & dashboard table to gauge overextension.
Entry Signals – Watch for RSI/ADX confluence (green/red labels on chart).
Exits – Monitor when strength fades back toward Neutral/Weak levels.
⚙️ Settings & Inputs
EMA Settings → Length, Line Width, Gradient Intensity
RSI Settings → Length & Thresholds (Bullish / Bearish)
ADX Settings → Length & Thresholds (Bullish / Bearish)
Bands → Enable/disable EMA deviation bands
Labels/Table → Toggle strength info display
Colors → Fully customizable vibrant palettes
🚨 Alerts & Signals
Bullish Condition → RSI & ADX above thresholds
Bearish Condition → RSI & ADX below thresholds
Visual confirmation with labels, candles, and background
⚠️ Disclaimer
This script is for educational purposes only.
It does not constitute financial advice.
Always backtest and use proper risk management before trading live.
✨ Add EMA-RSI-ADX Trend Bands (ERA Trend Bands) to your chart to trade with clarity, strength, and precision.
