Capitaliz – OmegaOne of the biggest enemies of the trader is himself.
Automation prevents you from losing opportunities while you're not in front of your computer.
It is also useful to prevent your emotions from taking over in your trading strategy.
We built this strategy to share our best coding knowledge with an automated trading strategy and our best combination of indicators to automate your trading.
“Capitaliz - Omega” is the best strategy available on the market.
It’s built with a combination of MACD / RSI / TREND / FLAT MARKET filters to offer the best breakout and pullback entries.
Integrated risk management, relevant signals, updated periodically, trend direction and flat market filters to avoid bad entry.
Our main goal is to provide a high quality strategy over time with a constant win rate.
Thank you for your time and support.
We hope to have you onboard.
The Capitaliz Team.
Cerca negli script per "trend"

Volatility Stop with Vwap StrategyFirst the credits goes to @TradingView for their release of the volatility stop mtf indicator.
I have took it, and inside I have added a weekly vwap for a better trend direction and at the same time I have added a dynamic risk managment which is calculated from the distance between the volatility line to the close of the candle.
The rules for entry are simple:
For long:We enter when our close of the candle is above the volatility stop line and at the same time the close of the candle is above weekly vwap
For short we enter when our close of the candle is below the volatility stop line and at the same time the close of the candle is below weekly vwap.
We exit when we either have a reverse signal than the one we enterred, or based on the TP/SL which is calculated with the distance from vwap to the close of the candle.
If you have any questions please let me know !

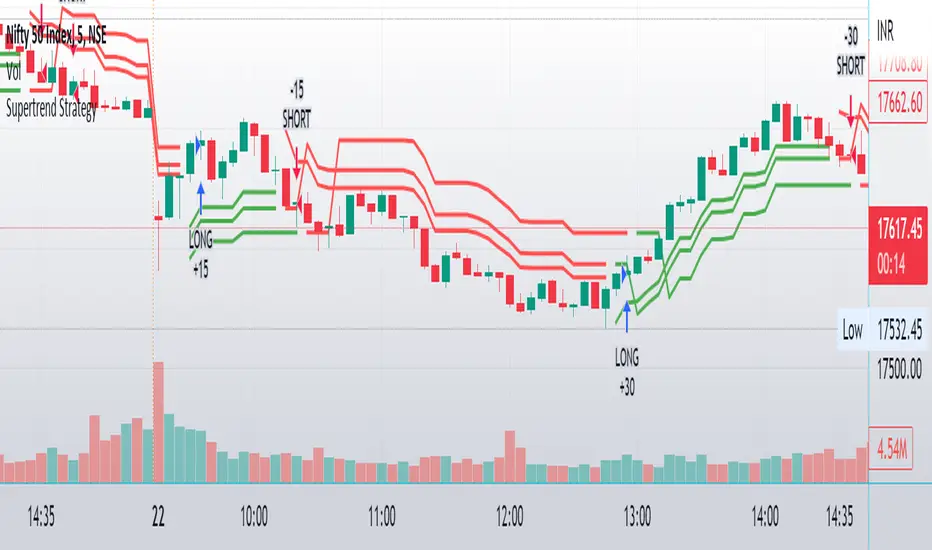
Supertrend - Long & Short -Sachin Ughadethis indicator for super trend strategy with buy and sell signals
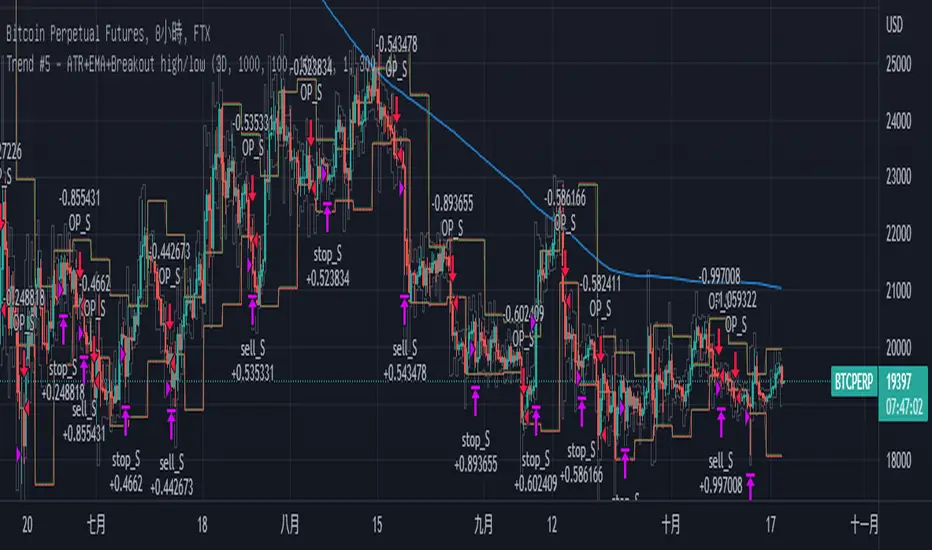
Trend Breakout high/low #1What is the Trend Breakout high/low #1?
This script uses the high/low of each fixed time period as a conditional judgment, and when the high/low is broken as a buy/sell signal, trying to capture a trend.
How to use this script?
Start date and Stop date: You can choose the date of the test.
Trading cycle: Selected time period is used as the basis for determining the high/low and is limited to one trade only.
Stop range: This value will calculate the stop loss range. Set 50-100 that is better
Fixed mode: Fixed of lots per transaction.
---Additional Functions---
Reversal mode: Reversing the buy and sell signals, may be useful in certain situations.
Wighted mode: Increased profitability under certain conditions
When win & When lose:Judgment when there is an ongoing loss/profit as a condition, may be useful in certain situations.
Use closing price: Use the closing price breakout high/low as a conditional judgment, but this function sometimes fails.
Notes:
Trading cycle and your chart time period can't be set too close,that will result repainting.
Stop range can't be set too small,that will result repainting either.
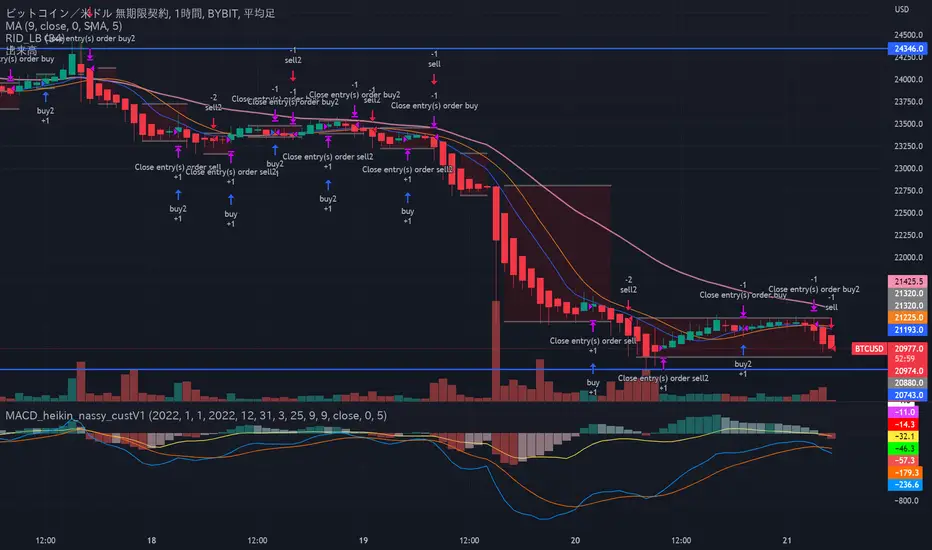
Customized MACD strategy with heikin_ashi chart V1Based on MACD strategy and using "heikin ashi" bar on chart.
It is optimized for BTCUSD and backtested from Jan, 2022.
BYBIT:BTCUSD
・Use crossover/under trigger
・Watch price and macd grow up/down
・Judge trend changing point
Miyagi (VWAP) + DCA BacktestVWAP has been the main condition for entry for our trading community when using the Wick Hunter bot for quite some time now; however using VWAP alone can lead to poor entries and bags.
Miyagi adds filtering conditions which can then be used to improve entries as opposed to simply using VWAP alone.
Miyagi: The attempt at mastering something for the best results.
Miyagi indicators combine multiple trigger conditions and place them in one toolbox for traders to easily use, produce alerts, backtest, reduce risk and increase profitability.
Miyagi (VWAP) + DCA Backtest allows you to backtest your VWAP settings across each pair.
VWAP + Backtest starts with the user selectable take profit and stoploss, both in percent.
Backtesting can be done in any trend direction: Long, Short, or both.
First we start with the VWAP Settings for entry.
The VWAP Settings are based off the original VWAP Indicator found here:
VWAP Timeframe can be adjusted to chart timeframe, or to another timeframe of choice.
VWAP Period is adjustable and should be set to your current period setting.
VWAP Lower Line (Long) is the Percentage Below VWAP = Long Entry.
VWAP Upper Line (Short) is the Percentage Above VWAP = Short Entry.
Once your VWAP Settings are now configured for your current trading settings, you can move onto the DCA and Backtest Settings.
Select DCA to allow and backtest DCA.
Equity %: allows you to select what percent of Equity you will use.
Leverage: Set the leverage you will trade at, from 1-100X.
DCA Start %: This is the percent that your DCA Starts at, in % away from initial entry.
Entry Order Size %: This is the entry order size, in percent of your account, that is used for entry.
DCA Order Size %: This is the DCA order size, in percent of your account, that is used for the first DCA.
DCA Order Size Scale %: This is the DCA size scaling, in %, that is applied to all DCA's after the first.
DCA % from Avg: This is the % away from Average DCA setting.
Step Size Scale %: This is the step size scale setting in percent, that is placed away from your first DCA.
DCA Buy Count: How many DCAs in total that can be used.
Properties Tab includes generic backtest settings including capital amount, base currency, order size, commission, slippage and margin.
Happy Trading!

Strategy Puma Trending StrategyThis script is a trading strategy, the structure originally made by the youtuber no nonsense forex.
It contains a combination of different indicators that contain different parameters an assets price and volume much reach before a trade is made.
Indicators include one for volume, volatility, baseline, zero cross indicator and a trigger indicator.

Nifty & BN 2 Candle Theory Back Testing and Alert Notification How To Initiate Long Trade-in Index Future/ Buy Call Options – 3 Min TF
▪ If The Index Futures Trades Above The VWAP, the Following Parameters are Checked For 2 Candle Theory on the long side
▪ RSI Trades Above 50 & Between 50-75/80
▪ Volume Of 2 Consecutive Bars Is Above 50 K for BN & 125 K For Nifty
▪ All the indicators (Parabolic SAR, Super Trend, VMA, VWAP) Below the Candles
▪ When the above conditions are met enter In 3rd Candle, With 1st Candle High As SL
How I Initiate Short Trade-In Index Future/ Buy Put Options – 3 Min TF
▪ If The Index Futures Trades Below The VWAP, the Following Parameters are Checked For 2 Candle Theory on the short side
▪ RSI Trades Below 40 & Between 40-25/20
▪ Volume Of 2 Consecutive Bars Is Above 50 K for BN & 125 K For Nifty
▪ All the Indicators (Parabolic SAR, Super Trend, VMA, VWAP) Above The Candles
▪ When the above conditions are met enter In 3rd Candle, With 1st Candle High As SL
The indicator checks the above and notifies to enter a long trade and short trade respectively. There is also volume cutoff and change in the volumes respectively, also non-trading times that can be set.

AlphaTrend StrategyI turned the Alpha Trend indicator coded by our teacher Kıvanç Özbilgiç into a strategy. You can find the original version of the indicator here.
It sends trading signals in the regions where AlphaTrend produces Buy and Sell signals. It is a two-way strategy.
Buy Entry Long opens trade, Sell Entry Short opens trade.
Pinball Trading Strategy This is a early version of the Pinball Trading Strategy turned into a Tradingview strategy for automated backtesting. I have tried to include as many customization options as possible. Currently you can choose two options to define the trend and 5 options to define your entry. The option 'do you want the acc in your stoploss' makes for unexpected behaviour sometimes so it is advised to keep it turned off for now.
Features: Stoploss gets set to BE automatically at 40% profit. Stoploss and TP are calculated automatically from the internal FNT table (2022).
How to use: in order to backtest the original Pinball Strategy use the 1H timeframe, the 4H data gets calculated by multiplying the 1H data.
1. Select atleast one Trend and Entry option from the Inputs tab in the Options Menu.
2. Take a look at the Style tab from the Options Menu to turn plotting of specific MA's and Conditions on or off.
3. The three plots for Entry, Trend and Long conditions plot your selected rules for Entry and Trend and then ultimately the Entering of a position, respectively. So turn these on and select plotting options that give a clear view of how your selected rules behave on price.
4. I have personally found the 5M timeframe to be most profitable when running this strategy so that might be something to check out!

Unicorn Quant Strategy [Astride Unicorn]Deeply customizable trading algorithm with instant back-testing. Its position management and trading signals engines emulate every step of the trading process and display all the actions on the chart. For example, the algorithm shows when to enter or partially close a position, move stop-loss to breakeven, etc. The trader can use these signals in their decision-making and replicate these actions in their trading terminal. The script can also send real-time alerts to the user’s Email.
The trading signals feature calculates entry signals for momentum and trend trading. The calculation is based on trend filtering using our custom filter based on rolling historical volatility. The historical volatility is used to distinguish the market regime and determine the current trend direction. In its calculations, the algorithm uses linear regressions instead of averaging. As our practice shows, it helps to reduce signal lag while keeping the number of false signals low.
HOW TO USE
Set stop-loss and up to three take-profit levels, choose rules for moving the stop-loss level, adjust sensitivity of the entry signals and see the back-test result immediately. If the performance of the strategy satisfies you, proceed with the forward-testing or live-trading.
When using this script, please, keep in mind that past results do not necessarily reflect future results and that many factors influence trading results.
SETTINGS
Use Starting Date - when the flag is turned off, the algorithm uses all available pricing data to calculate back-tests; when turned on, back-tests start from a starting date the user can select in the setting below.
Starting Date - sets a starting date for back-testing.
Trading Signals
Trade Length - defines the length of the trades the algorithm tries to calculate entry signals for. Recommended values are from 1.0 to 6.0.
Sensitivity - controls the sensitivity of the trading signals algorithm. The sensitivity determines the density of trading signals and how close the trailing-stop levels follow the price. The higher the value of this parameter is, the less sensitive the algorithm is. High values of the Sensitivity parameters (100-500) can help to withstand large price swings to stay in longer price moves. Lower values (10-100) work well for short- and medium-term trades.
Signals Type - In the Signals Type dropdown list, there are two options: Market Timing and Market Bias. Market timing is a type of trading signaling when the algorithm tries to find a perfect moment to enter and exit a trade. Market Bias is the type of trading signaling when the algorithm tries to be in a position all the time. When a trade is closed, the algorithm determines a direction to which the market is currently “biased” and immediately opens a trade in this direction.
Position Management
SL - sets stop-loss level measured as a percentage of the trade entry price
TP1, TP2, TP3 - sets take-profit levels measured as a percentage of the trade entry price
Close % at TP1, Close % at TP2, Close % at TP3 - Sets portions of the open position(as a percentage of the initial order size) to close at each of the TP levels
At TP1 move SL to, At TP2 move SL to - Sets the rules for moving stop-loss level in an open trade to protect the floating profit
Dashboards
Active Position Information - turns on/off a dashboard that shows the current SL and TP levels for the active position.
Recommended SL,TP Settings - turns on/off a dashboard that shows recommended settings for the SL and TP levels.

Trend Follower Strategy v2 [divonn1994]The Trend Follower Strategy that I made classifies red and green candles into tiny, small, and big sizes and will send buy or sell signals depending on if the candle is classified as "big" so you get into and out of a position when there is a big candle. Out during a big green candle to take profit. Out during a big red candle in case the market is turning down. It also won't enter a position unless there is positive EMA momentum.
For the chart there is a Buy and a Sell signal. Buy = 1, Sell = 0, and when the value crosses above or below 0.5 it will trigger a long position or close the long position. The graph isn't necessary to the strategy, but can help with visualizing the trade patterns in the past if you like.
This strategy works best so far with these coins at time of posting (March 4th, 2022):
KCSUSDT (621x profit), HTUSDT (45x profit), LUNAUSDT (45x profit), BNBBTC (1553x profit), ETHBTC (219x profit), KCSBTC (1222x profit), LUNABTC (83x profit), FTMBTC (52x profit).
It can work with other pairings, but I personally like these pairings best. I didn't test it with coins outside of the top 100 coins by market cap. Use it however you want.
Works best on 1 Day charts.
The strategy would rather be in the market than out. It gets out when it see's a red flag, but can immediately go back in in the next bar if the red flags are all gone. So it makes a lot of trades.
------------------------------------------------------------------------------------------------------------------------------------------------------------------------------------------------------------------------
Update: This is the same strategy I uploaded before but I made the code Open for anyone to check it out and so it has a similar description as the previous version. Let me know what you think. I'd remove the old version if I could, but I guess it's site policy to not be able to remove scripts that have been uploaded.

Chanu Delta RSI StrategyThis strategy is built on the Chanu Delta RSI , which indicates the strength of the Bitcoin market. The problem with the previous Chanu Delta Strategy was that it was simply based on the price difference between the two Bitcoin markets, so there was no universality. However, this new Chanu Delta RSI strategy solves the problem by introducing an RSI that compares the price difference trend.
When the Chanu Delta RSI hits “Bull Level” and “Bear Level” and closes the candle, long and short signals are triggered respectively. The example shown on the screen is a default setting optimized for a 4-hour candlestick strategy based on the Bybit BTCUSDT futures market. You can use it by adjusting the setting value and modifying it to suit you.
This strategy is selectable from both reference and large amplitude BTCUSD markets in order to enable fine backtesting. I recommend using BYBIT:BTCUSDT for the reference market and COINBASE:BTCUSD for the large amplitude market.
(Note) Using the "Chanu Delta RSI" to know the current indicator value in real time, it is convenient to predict the signal of the strategy.
(Note) Because the Chanu Delta RSI represents the price difference based on the Bybit BTCUSDT futures market, backtesting is possible from March 2020.
_____________________________________________________________
이 전략은 비트코인 시장의 강점을 나타내는 Chanu Delta RSI를 기반으로 합니다. 기존 Chanu Delta 전략의 문제점은 단순히 두 비트코인 시장의 가격차를 기준으로 하여 보편성이 없었다는 점이다. 하지만 이번 새로운 Chanu Delta RSI 전략은 가격차이 추세를 비교하는 RSI를 도입해 문제를 해결했습니다.
Chanu Delta RSI가 "Bull Level"과 "Bear Level"에 도달하고 봉마감하면 롱, 숏 신호가 각각 트리거됩니다. 화면에 보이는 예시는 Bybit BTCUSDT 선물 시장을 기반으로 한 4시간 캔들스틱 전략에 최적화된 기본 설정입니다. 설정값을 조정하여 자신에게 맞게 수정하여 사용하시면 됩니다.
이 전략은 정밀한 백테스팅을 가능하게 하기 위해 참조 및 큰 진폭 BTCUSD 시장에서 모두 선택할 수 있습니다. 참조 시장에는 BYBIT:BTCUSDT를 사용하고 큰 진폭 시장에는 COINBASE:BTCUSD를 사용하는 것이 좋습니다.
(주) "Chanu Delta RSI"를 이용하여 현재 지표 값을 실시간으로 알 수 있어 전략의 시그널을 예측하는데 편리합니다.
(주) Chanu Delta RSI는 바이비트 BTCUSDT 선물시장을 기준으로 가격차이를 나타내므로 2020년 3월부터 백테스팅이 가능합니다.

Trend Follower Strategy [divonn1994]The Trend Follower Strategy that I made classifies red and green candles into tiny, small, and big sizes and will send buy or sell signals depending on if the candle is classified as "big" so you get into and out of a position when there is a big candle. Out during a big green candle to take profit. Out during a big red candle in case the market is turning down. It also won't enter a position unless there is positive EMA momentum.
For the chart there is a Buy and a Sell signal. Buy = 1, Sell = 0, and when the value crosses above or below 0.5 it will trigger a long position or close the long postion. The graph isn't necessary to the strategy, but can help with visualizing the trade patterns in the past if you like.
This strategy works best so far with BNBUSDT, ETHUSDT, KCSUSDT, HTUSDT, BNBUSDT, BNBBTC, ETHBTC, KCSBTC, LUNABTC, SOLBTC, ADABTC, SANDBTC, HNTBTC, KDABTC.
It can work with other pairings, but these have the healthiest charts in my opinion, as in, the profit factor is high and is greater than a simple buy and hold strategy, and the largest drawdown isn't very high.
Works best on 1 Day charts.

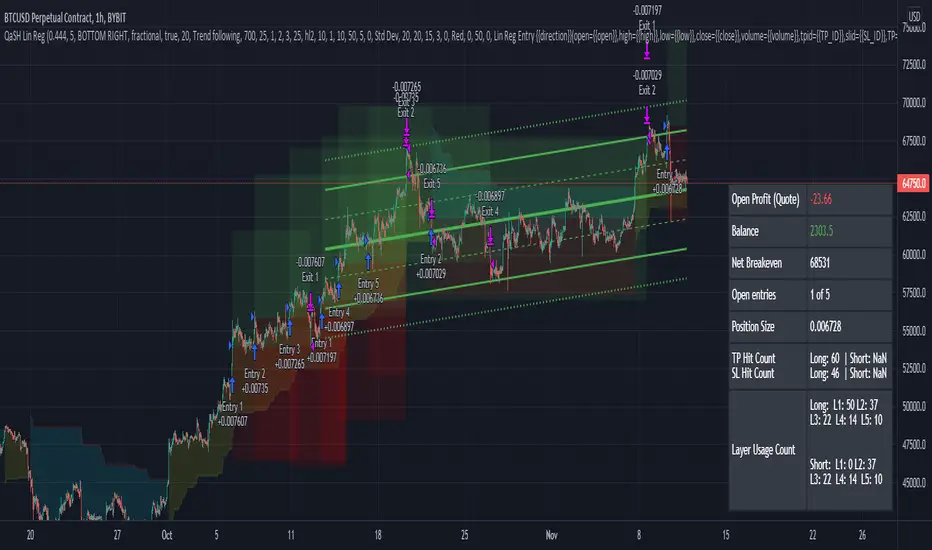
QaSH Linear Regression + SuperTrendThis script uses linear regression and standard deviation measurements to trigger entries and calculate placement of TP and SL prices. A larger linear regression line will provide the market trend, while a smaller linear regression line will look for pullback entries within the larger trend. Up to 10 orders can run in parallel as a form of pyramiding in and out of a position. The supertrend is used as an additional filter for trend confirmation.
Trend following and mean reversion entries can be used per your preference. Several other entry filters are available for confirmation.
The stoplosses can be moved to breakeven during a trade, and an alert will be sent that includes the exact order ID that needs to be moved, and to what price. This is an advanced feature that is very powerful when used with a capable automation service.
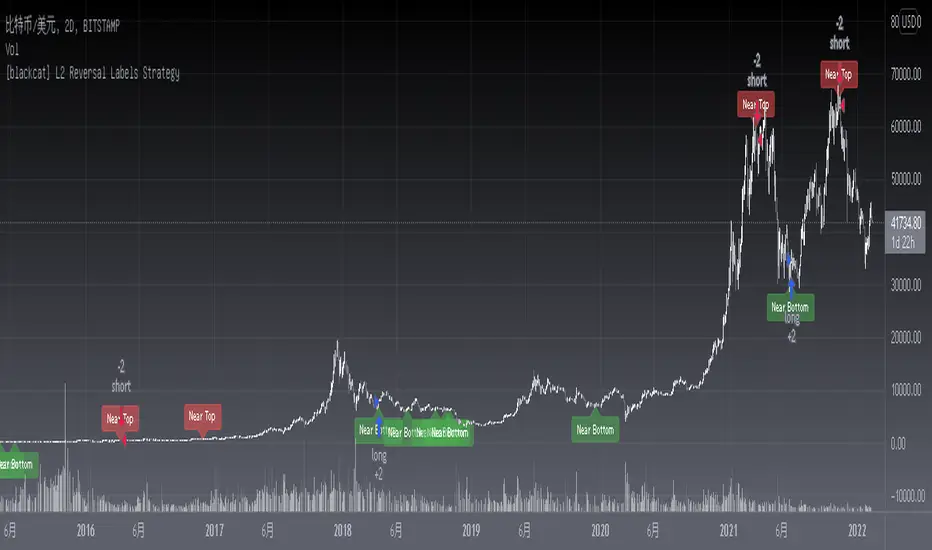
[blackcat] L2 Reversal Labels StrategyLevel: 2
Background
There is a Chinese proverb that says: "The great way leads to simplicity". This indicator is the representative of this meaning. Through the processing of the most common MACD indicator data, it is possible to quickly determine the market price: whether the current price is at a historical high or low, whether a reversal will happen soon, etc. at a glance.
Function
This is the strategy version of the same indicator which performs screening and filtering through the fast and slow line data corresponding to the output of the standard MACD indicator, so as to realize the function of judging the top and bottom of the trend.
Inputs
N/A
Key Signal
Near Top --> Top is reached and reversal may happen soon. (red labels)
Near Bottom --> Bottom is reached and reversal may happen soon. (green labels)
Remarks
The backtest result is picked up and optimized for BTCUSD '2D' time frame, it does not work constantly well for any time frame. You need to combine other indicators for other trading pair and time frame.
You can add alerts for this version.
This is a Level 2 free and open source indicator.
Feedbacks are appreciated.
CryptoGraph Multi Algo StrategyThis is a summary of how this strategy works.
CryptoGraph Multi Algo Strategy is the second profitable real-time trading strategy by the CryptoGraph team, that generates trade signal with exact entires, exits and risk management. The strategy is intended to work nearly every crypto coin pair, stock or index.
Principles behind the strategy
Entry:
Detection of trend direction with the use of an EMA . Default setting is a length of 550.
Detection of shorter term trend direction with the use of multiple Supertrend Indicators.
Detection of an even shorter term direction with the use of a crossover of the Stochastic RSI , below or above certain levels. This would be the final condition for an entry signal.
Exit:
Once an entry signal has fired, the script will look at the current ATR Value. In the script settings there will be an option to adjust the ATR factor. While ATR factor is equal to 1, it means it will use the default ATR value distance from the candle close. When ATR factor is for example 2, it will use two times the ATR distance from the candle close.
This is a simple representation of how this strategy works, in reality there are more underlying factors.
To find the best settings for the crypto coin pair or stock you want the strategy to trade with, simply switch up the EMA , ATR Profit Multiplier and ATR Stop Multiplier and experiment which settings would fit your style best.
What to look for when testing coins or stocks?
EMA, default exponential moving average is set to 550. When above the line, it will only look for longs, when below it will only look for shorts.
The Take Profit and Stop Loss are based on ATR multiplications, adjust these in the inputs interface and you will see the exits change.
Default parameters of the strategy
This is only an example of a profitable combination of all parameters. This would be the 30 minute timeframe Bybit chart on Bitcoin.
ATR take profit at x2, ATR stop loss at x4.1.
In this example we are using an initial capital of $1.000,- while each trade 100% of this capital is used and compounds over time. Meaning every profit or loss will be added to the next trade. Also there is a 0.05% commission used based on Bybit, since we expect most trades to market in and limit out.

[MAD MBS] L5 RiskManagementL5 RiskManagement of the "Modular Backtest System" series is a part from a framework of modules to easily implement custom strategies more ore less like "drag and drop"
This is the risk management module that uses my "multibit" signal communication
All this here in the interactive screenshot represents the whole framework, when interconnected and after propper configuration.
Some modules that have already been released or are planned to be released in the near future
Wavebuilder module (SMA EMA HMA,..)
Multispikes module
..... no idea what will come here next
Bollinger module
Statistics module
..... some ideas here (Trends,... Multitimeframe stuff)
Processor x8
Processor x16-x64
Risk management (contains an alert builder to generate commands for external webhook trading bots.
------------------------
What can this risk management do?
Classic position handling from DCA to breakout
Multiple targets
position risk management by intelligent reduction of positions in case of overinvestment
Stop
Marketmaking
SL automatically move profit after takeprofits
Position change strategies
and much more...
Statistics about all your positions including TP1, TP2, TP3, SL's,...
Testing own indicators:
Create a signal like this here inside your indicator and map the two outputs correctly
signalout = 0
signalout := (signal_buy? 1: signal_sell? -1: 0)
BM_color_signal = signal_buy? #4C9900 : signal_sell? #CC0000 : color.black
L_digital_signal = plot(signalout, title ="Digital signal", color=BM_color_signal, transp=0, style=plot.style_columns, display=display.none)
after this you use
set input to -1 0 1
daisychaint the stuff correctly together including signal mapping and you are ready to go
Chain looks like this:
L1 (your indicator)
L3 processor
L5 risk management
Some screenshots with finished configuration and different L1 signalsources
The libary used for this project

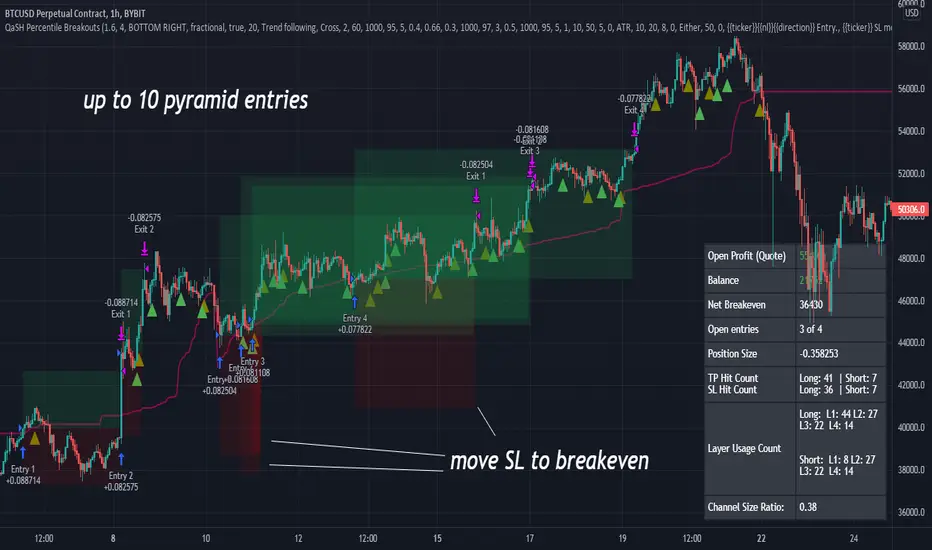
QaSH Percentile BreakoutsThis script makes trades when price is trending past the x percentile ranked bar closing price. Entries can be made when price crosses the threshold, or when price pulls back and forms a pivot point. It can track up to 10 entries independently as a method of pyramiding, each with its own TP and SL price, and it provides a unique order ID to each one for your automation service to use. Several entry condition filters are provided for higher quality entries. Stoploss prices can be moved to breakeven when in profit.
Combo 2/20 EMA & Absolute Price Oscillator (APO) This is combo strategies for get a cumulative signal.
First strategy
This indicator plots 2/20 exponential moving average. For the Mov
Avg X 2/20 Indicator, the EMA bar will be painted when the Alert criteria is met.
Second strategy
The Absolute Price Oscillator displays the difference between two exponential
moving averages of a security's price and is expressed as an absolute value.
How this indicator works
APO crossing above zero is considered bullish, while crossing below zero is bearish.
A positive indicator value indicates an upward movement, while negative readings
signal a downward trend.
Divergences form when a new high or low in price is not confirmed by the Absolute Price
Oscillator (APO). A bullish divergence forms when price make a lower low, but the APO
forms a higher low. This indicates less downward momentum that could foreshadow a bullish
reversal. A bearish divergence forms when price makes a higher high, but the APO forms a
lower high. This shows less upward momentum that could foreshadow a bearish reversal.
WARNING:
- For purpose educate only
- This script to change bars colors.
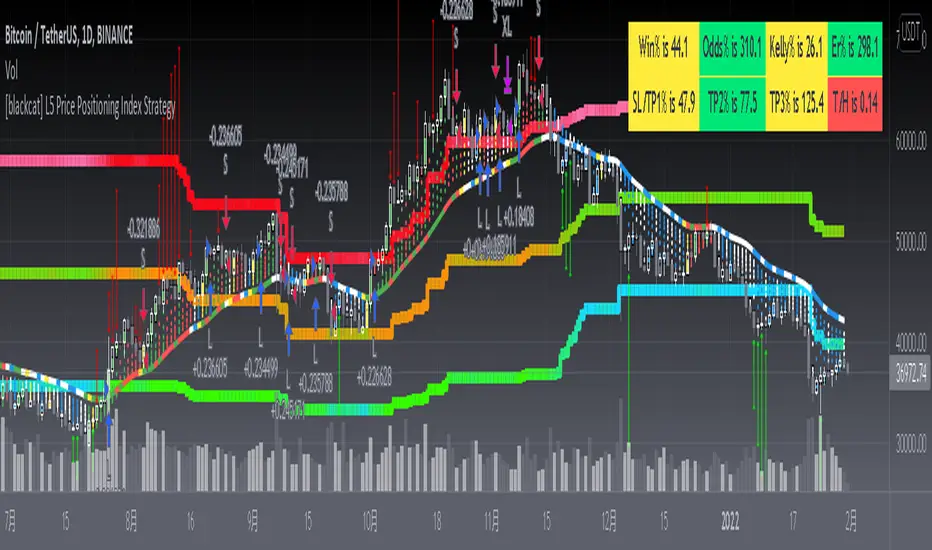
[blackcat] L5 Price Positioning Index StrategyLevel: 5
Background
Are you tired of traditional Japanese candlesticks? Do you want to try a new type of candle master chart? This is my private L5 version, which introduces "Market Season Bands" for oversold and overbought status, historical resistance and support arrows in dynamic forms, inherent pyramiding for buy and sell.
Function
L3 Price Positioning Index is totally brand-new candle chart invented by myself. This main chart can provide effective resistance and support levels, and you can see where the price is running at any time. There are 3 key color bands. Blue-Green gredient band is used to indicate oversold support or breakthrough support levels; the color is blue means extreme oversold, green means oversold you can ignore. This band indicates the season of market entering "Winter". The Green-Orange band indicates the midline position where prices may pause; the green color here means bear middle while orange color here means bull middle. Accordingly, middle band color indicates market season entering "Spring or Autumn" . Finally, Pink-Red band indicates overbought resistance or breakthrough resistance levels; the pink color means market season is NOT bullish while the red color indicates it is a good market season to long. top band color indicates the market season entering "Summer". Enjoy your "Summer" with profit!
There are two types of candlestick charts.
The first type candles are mid-to-long-term trend candles, navy represents an uptrend and the length of the candle represents a change in intensity; maroon represents a downward trend and the length of the candle represents a change in intensity. You can find principle in L5 Price Positioning Index code. In L5 version, to simplif the visual effect, the display is hidden. This trend candle is the effective support and resistance level of the second type short-term swing candle.
The second type candles are short-term candles fluctuate around the first medium- and long-term trend candles. The second short-term candle is divided into five colors: green means pump; red means retracement in the ascending process; blue and yellow means bearish rebounce and trend reversal signal; white means dump; blue means price rebound in the descending process. I describe these in raindrop or snow-drop form, which can be quite familar for you to imagine the temperature of the market :).
Key Signal
THREE KEY LINES:
htop --> Pink-Red band, "Market in Summer", overbought resistance or pump breakout threshold
hmid --> Green-Orange band, "Market in Spring or Autumn", price pause zone, sideways may happen here
hbot --> Blue-Green gredient band, "Market in Winter", oversold support or dump breakout threshold
MID-LONG TERM CANDLES:
colorful trend line , it is an important support or resistance for short term price movements and the bull-bear boundary for market seasons.
SHORT TERM CANDLES:
1. bear rebounance --> rebounce in down trend candle with blue color
2. pump --> up trend pump candle with green color
3. trend reversal --> trend reversal candle with yellow color
4. dump --> bearish dump candle with white color
5. bull retracement --> retracement in up trend candle with red
Pros and Cons
Pros:
1. Long term trend identification by three lines for overbought, oversold and breakouts
2. Mid term trend support and resistance with a colorful boundary
3. Short term price behaviors are classified into 5 types of candles in blue, green, yellow, red and white
Cons:
I invent this to solve traditional JP candlestick shortcomings. If you find anything on Cons, just feedback to me for improvements.
Remarks
1. This is the strategy version of L5 Price Positioning Index
2. Closed-source, Invite-only, NOT free. (Free version is available by search "L3 Price Positioning Index")
3. Highl recommended to use this indicator for >= 4H timeframe, which means this is powerful for swing trading.
4. IMPORTANT!!! To have superior visual effect, you need to enter "Chart Setting" --> "Symbol" --> TURN OFF "Body", "Borders" and "Wick" of traditional JP candles.
Subscription
Permission will be automatically granted for who subscribed " L5 Price Positioning Index for Market Seasons"
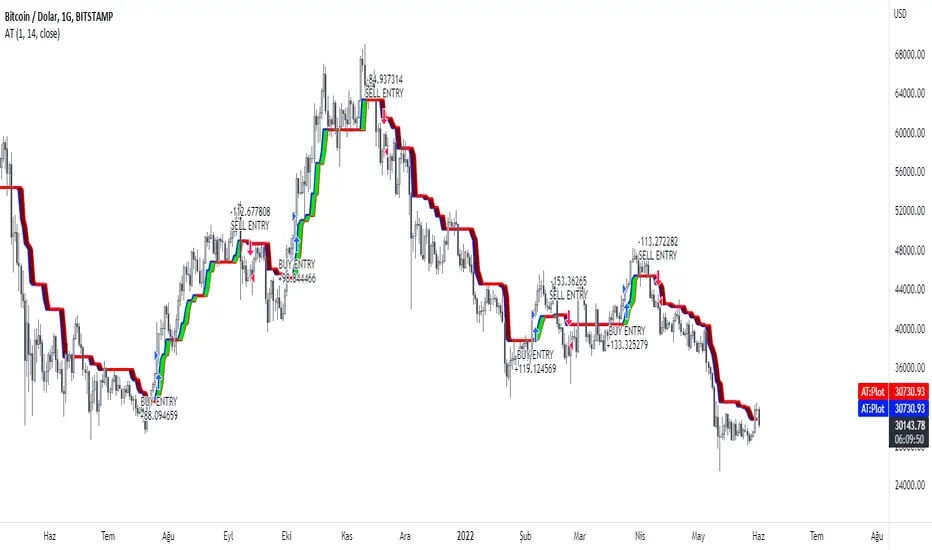
200DMA last DOM - ajhImplements and backtests a simple 200 day moving average trend following rules based on last day of month to limits trades to 12 per year.
From the book : 5 BEST Moving Average Strategies (That beat buy and hold) by Steve Burns and Holly Burns
Click on the cog to set the input date range eg; 2000-01-01 to 2016-12-31
The book back tested SP500 returns from 2000-2016 317% using this method vs 125% buy and hold only with less drawdown.
Simple 200 day moving average test and trading on last day of month.
(you may find it trades on next available day close to end of month as not all dates can be traded weekends etc..)
Rules are ;
1. if last day of month and stock over 200 day moving average, then go long 100%
2. if last day of month and stock under 200 day moving average, then close long 100% and goto cash.
Aims to miss market declines and keep you long for upside.
Note: Have found doesn't work well in choppy markets moving sideways like the FTSE100 for same period 2000-2016 and causes losses. Also for many stocks.

Supertrend StrategyThis Supertrend strategy will allow you to enter a long or short from a supertrend trend change. Both ATR period and ATR multiplier are adjustable. If you check off "Change ATR Calculation Method" it will base the calculation off the sma and give you slightly different results, which may work better depending on the asset. Be sure to enter slippage and commission into the properties to give you realistic results.
I've also built in backtesting date ranges and the ability to trade only within certain times of day and have it close all trades at the end of that time frame. This is especially useful for day trading stocks. If you check off "Enter First Trade ASAP" then when using the time frame option it will enter the current trade. If however you uncheck that box and instead check off "Wait To Enter First Trade" it will wait for the trend to change and then enter.
You can also specify a % based take profit and stop loss. In most cases the stop loss is not needed because of the atr based stop that supertrend provides so you could check only take profit and see if it works best to take profit or to let supertrend trend change get you out. Also keep in mind that if you have "Enter First Trade ASAP" checked off and use the stop loss and/or take profit then it will re-enter the current trend again.
Finally there's custom alert fields so you can send custom alert messages for strategy entry and exit for use with automated trading services. Simply enter your messages in the fields within the strategy properties and then put {{strategy.order.alert_message}} in your alert message body and it will dynamically pull in the appropriate message.
