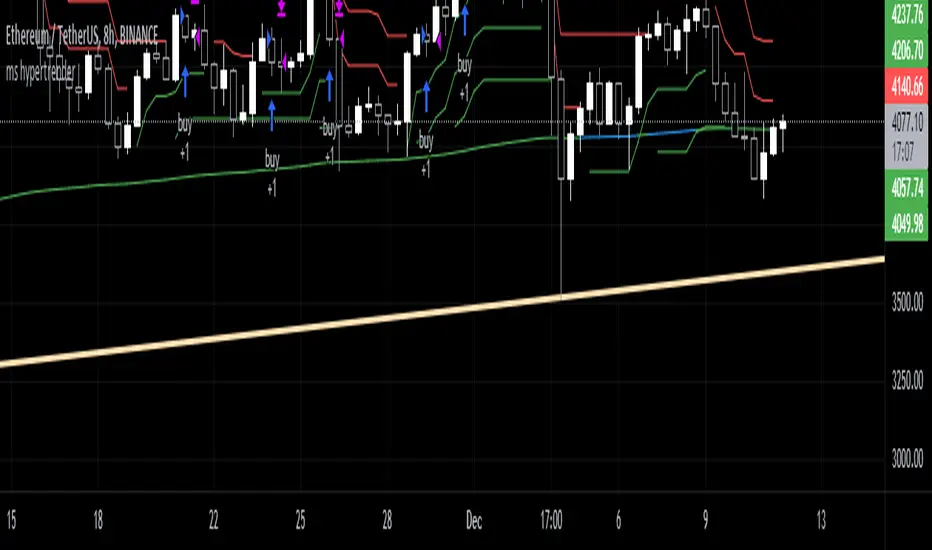
moonshot hypertrender (supertrend strategy)
This is a well-known strategy by using 3 different Supertrends and a trend-defining EMA,
feel free to play around with the settings, a backtest on 8h ETHUSDT pair brought some good results using
the 233EMA and investing 75% of a 10k start capital.
The idea is to have at least 2 Supertrends going green above the trend-EMA to go into a long position. The exit
will be triggered if 2 Supertrends change to red (idea: 1 super trend in red could initialize a take profit).
Taking shorts works vice versa.
The EMA shows in green for uptrends and in red for downtrends, if it is blue (ranging market) no Signal will be taken because
the 3 Supertrends are not all above or below the trendline(EMA).
I heard about this strategy on youtube but I can't get the promised 60% win-rate ;)
any suggestions to improve it are welcome
Hope you find it useful and it would be nice to get your feedback
-theasgard-
Cerca negli script per "trend"
Linear Regression Channel Breakout StrategyThis strategy is based on LonesomeTheBlue's Linear Regression Channel Indicator. First of all, I would like to thank LonesomeTheBlue. Breaking the Linear Regression Channel to close the candle triggers a Long or Short signal. If the slope of the Linear Regression Channel is positive, it is Short when it breaks out the lower line, and when the slope is negative, it is Long when it breaks out the upper line. The default is optimized for 8-hour candles, and for other hour candles, find the optimal value yourself. Below is a description of LonesomeTheBlue's Linear Regression Channel.
이 전략은 LonesomeTheBlue의 Linear Regression Channel Indicator를 기반으로 만들어졌습니다. 우선 LonesomeTheBlue님께 감사의 말씀을 드립니다. Linear Regression Channel을 돌파하여 봉 마감하면 Long 또는 Short 신호를 트리거합니다. Linear Regression Channel의 기울기가 양인 경우 하단 라인을 돌파하면 Short이고 그 기울기가 음인 경우 상단 라인을 돌파하면 Long입니다. 기본값은 8시간봉에 최적화 되어 있으며, 다른 시간봉은 직접 최적값을 찾아보십시오. 아래는 LonesomeTheBlue의 Linear Regression Channel에 대한 설명을 퍼왔습니다.
________________________________________________
There are several nice Linear Regression Channel scripts in the Public Library. and I tried to make one with some extra features too. This one can check if the Price breaks the channel and it shows where is was broken. Also it checks the momentum of the channel and shows it's increasing/decreasing/equal in a label, shape of the label also changes. The line colors change according to direction.
using the options, you can;
- Set the Source (Close, HL2 etc)
- Set the Channel length
- Set Deviation
- Change Up/Down Line colors
- Show/hide broken channels
- Change line width
meaning of arrows:
⇑ : Uptrend and moment incresing
⇗ : Uptrend and moment decreasing
⇓ : Downtrend and moment incresing
⇘ : Downtrend and moment decreasing
⇒ : No trend

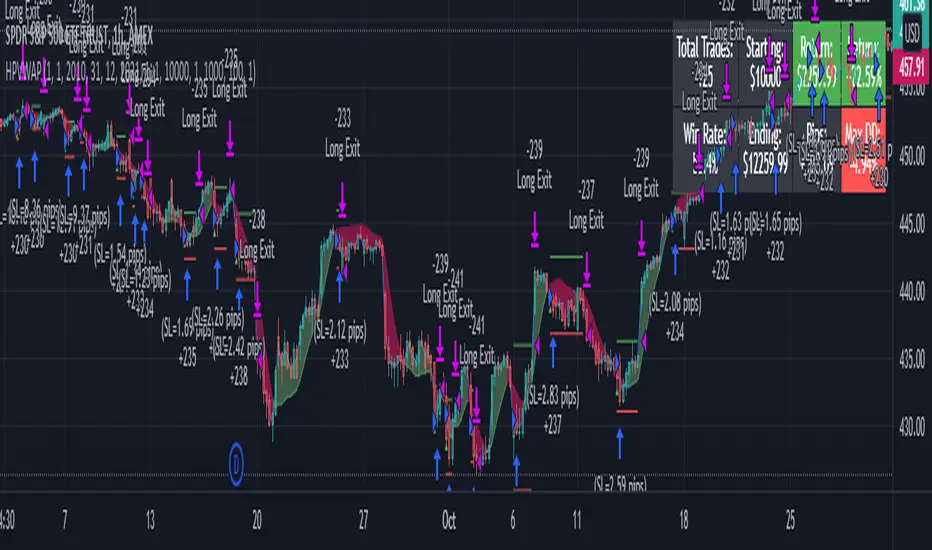
Alpha Candle Breakout Signal on Momentum from Support Resistance
Hello traders,
Let’s start with a brief description of what this strategy/indicator is and what it does and how we trade based on Alpha Candles.
The definition of an Alpha Candle is that it is mathematically calculated, and significantly bigger than the previous candles. This could be a green candle or a red candle, as long as the body is significantly bigger than the previous candles at the end of the calculation. All calculations are done in real time, we do NOT paint the candle sticks after the close of the candle and do not use offset values. This is extremely important. You will see the candle changing it's color as the body of the candle gets bigger with real time data feed. (Recalculate On Every Tick is ON by default). Now besides the mathematical calculations, an Alpha Candle also represents the emotion in the market for that stock in that moment. We can also say that an Alpha Candle is a change in the momentum.
Now that we’ve identified the Alpha candle, the second step is, to have a look at the chart and identify if the Alpha candle is breaking to a new high / low from a consolidation period, or from a good chart pattern (ascending / descending triangle , pennant , sideways consolidation) or a sudden direction change of the stock (bounce). Remember, the script will paint all Alpha candles regardless.
NVAX day trading example
Forex
Crypto
PLUG (Bounce example)
The script will identify the Alpha candles that are breaking to a new high / low from a user input look back period (default is 20 bars back, but this can be changed by the user input). An Alpha candle that breaks the look back period, will have a stop loss line below for Green Alpha or above for Red Alpha Candle and reward targets, like target1 or target2 (both are user input fields, can be adjusted to personal R values, default values are 2R and 3R)
A 2R means two times the reward (profit) of a 1-unit risk. If you are comfortable of loosing $50 per trade which will be considered 1-unit, then 2R means $100 reward (profit) target and a 3R is $150 reward (profit) target. Those R values will be plotted and/or labelled on the chart with dollar amounts if desired. You can change your R values from the user input area, even with decimal points, like 2.5R or 3.75R. If you shoot for at least 2R, you could be wrong 6 times out of 10, and still make 2R profit, as long as the other 4 trades give you a total of 8R. This is a basic trading concept. It will force the new traders to focus on risk/reward rather then a gambling attitude.
The script is meant to work with candle stick chart patterns only, it is NOT meant to work with ranges, line charts or point and figure charts. It will work with time frames like (seconds,1,2,3,5,10 minute or any minutes, daily, weekly). If you are trading IPOs , there might not be enough data for the script to do the calculation, so just be aware.
The script will identify the candles if they are Green Alpha (going up, bullish ) or Red Alpha (going down, bearish ). In order to see them clearly, we’ve greyed out the rest of the candles, and made Green Alpha candles white, and Red Alphas are left as red. You can change the colors from the user input area.
There is also a look back period, between 1-55 and the initial value is 20 for Green Alpha and 10 for Red Alpha. So, if the Alpha Candle breaks this look back period, it will be considered as an opportunity to take the trade. The code will put the stop loss area, possible target1 and target2 areas with a blue diamond and will draw the resistance/support lines for that Alpha candle. Depending on the individual’s risk tolerance, a label on the right side of the screen will show the risk tolerance (user input value) and the number of shares to be traded based on the risk tolerance (# of shares will be for the last Alpha Candle that is formed, it will constantly update itself with the new Alpha Candle)
For those who might be familiar with the three-bar play, we implemented something similar, so the code will find them in real time. Once an Alpha Candle is formed, if the following candle is a very small candle, also called pin bar , it will be painted to orange, so you can see it clearly. This pin bar is significantly smaller than the previous candles and formed right after an Alpha Candle.
Like anything in life, nothing is free. Meaning you have to work for it. So if you are looking to buy/sell blindly based on some indicators and signals, please do not consider this script. However, once you start using it, you will see how patterns repeat, when they repeat and how they repeat. It will identify the action, but you have to check the validity from the charts, so user discretionary is advised. As an example, if the Alpha candle is breaking from a consolidation period at $10. Let’s assume stop loss is at $9 so the 2R target will be $12, but if there is a possible resistance at $11, then the trader has to decide to take the trade for a possible 1R return, or skip the trade.
We try to approach the trading as a set of rules and processing the trades one by one, with a calculated risk and reward. This script will give you the Candle stick formation that is worth consideration and will draw the Stop Loss area (you can tweak this to your liking), will draw the 2-3R Targets, and will calculate the number of shares to be purchased based on the Risk Tolerance user entered in the user input area. The rest is to let the trade take care of it self.
Charts and patterns work better, when there is enough volume in a particular stock. If the stock is trading very low in volume , things will not work as expected. So, we must focus on the abnormal stocks, like gap gainers, volume gainer stocks, or heavily traded stocks (for intraday trading). For swing or long-term traders, one could look for a Green Alpha candle, assess the risk and possible return and trade the plan on a daily chart pattern (long term), or 15,30,60 min charts for swing trades.
If you are looking to short a stock, look for stocks that are weak (gap downs), so look for Red Alpha formations in that stock.
Once the back testing is turned on, code will generate buy/sell signals, otherwise it will work as an indicator. But please keep in mind….. For day trading, the stock has to be abnormally trading, so the chart patterns and the Alpha Candles work correctly. Volume has to be more than usual. It is the best way to have predictable results for day trading. If the volume of the stock is 2-5 times or more than the average of 20 days period (early in the morning), and even more later in the day, it is a good indication that the stock is trading on an abnormal volume with some news (pre-market abnormality is a good sign for possible abnormality for that stock).
For back testing, user can select from the user input area :
• Long or Short Trades or both or use the script as an indicator
• Close any open position if an Alpha candle forms in the opposite direction
• Pyramid the trades up to 4 levels (allow to buy/sell 4 times in the same direction every time another Alpha Candle forms)
• Breakout/breakdown look back period (every time an Alpha Candle forms and breaks this look back period, it will be a trade opportunity)
• Target Reward areas
• Stop Loss area
• Time frame (change the time frame and observe which time frame made good profit. Test the plan for future trades. Test it in as many abnormal stocks for the day they were behaving abnormal as possible). Time frame is not a user input field, just the time frame of the chart, 2,5,10 min, 1 hour etc.
• Selective date testing (between two dates/times). This is very important as most of the good opportunities comes from abnormal price action with volume . If you back test with the maximum amount of data for that abnormal stock on that day, it will produce unrealistic results, because the stock will have a normal course of trend before the news. Remember, we are looking for stocks that are trading abnormal in both price and volume or stocks like AAPL , TSLA which are trading heavily on each day. It is also a good way to learn, how and when to buy/sell, where to put stop losses by observing the chart with the Alpha Candles showing the results.
• All the above values will have an impact on the total profit / loss.
F (Ford Motors)
Now that we’ve covered what the script does, let’s plan the trade and trade the plan.
Side Note:
-------------
We started coding this as an indicator to show the Alpha Candles to find opportunities in the market. Later in the development, we implemented it as a Strategy, to be able to back test the ideas, to tweak some rules for entry/exit and see the effects on our profit/loss percentages in general. We kept the original idea being an Indicator, to show us the Alpha Candles in real time. This requires the option “Indicator Mode” is to be selected from the User Input area, and leaving the “Recalculate On Every Tick” is selected from the Properties tab of the strategy (as of Pine Script v5). Strategy is turning this “On” by default.
Disclaimer: This script is an educational and personal use only tool and should be used accordingly. User can not publish any images created with this code. Do your own due diligence, do not buy / sell stocks based on any indicator, always use stop losses. We do not make any promises as this indicator or any indicator will make you a profitable trader. Trading and technical analysis is difficult, it takes time to build confidence and experience. Study the charts and candlestick formations. Study support/resistance areas and how to identify them. This will help you to tweak the script’s stop loss areas and 2R-3R targets. Do not invest any money you are not comfortable loosing.
This is an invite only strategy. We will give ample time to test it out. After that you will need to subscribe. To get access to this strategy trader can send me an email from the links below.
All the Best
Happy Trading

LPB MicroCycles StrategyWhat it is:
We use the Hodrick-Prescott filter applied to the closing price, and then take the outputted trendline and apply a custom vwap, the time frame of which is based on user input, not the default 1 day vwap . Then we go long if the value 2 bars ago is greater then one bar ago. We sell and color the bars and lines when the if the value of 2 bars ago is less than one bar ago.
Also included:
GUI for backtesting
ATR Based Stop Loss
How to use:
Go long when the indicators suggest it, and use the stop losses to reduce risk.
Best if paired with a volatility measurement (inside candles, average true range , bollingerband%B)
AleemTalks Crypto MachineOne of best Trend Trading Systems
It Included Moving Averages
Multi Time Frame Analysis
Order blocks
Support and Resistance
To understand it completely
You can Inbox me

Moon Phases Strategy [LuxAlgo]Trading moon phases has become quite popular among traders, believing that there exists a relationship between moon phases and market movements. This strategy is based on an estimate of moon phases with the possibility to use different methods to determine long/short positions based on moon phases.
Note that we assume moon phases are perfectly periodic with a cycle of 29.530588853 days (which is not realistically the case), as such there exists a difference between the detected moon phases by the strategy and the ones you would see. This difference becomes less important when using higher timeframes.
Settings
New Moon Reference Date: Date of a new moon to be used as starting point for the cycle calculation. Buy: Determine the condition to be used to open a long position Sell: Determine the condition to be used to open a short position
Description
The strategy can use different buy/sell conditions, these are determined in the Buy/Sell settings drop-down menu.
By default, the strategy goes long on a new moon and short on a full moon. This setup is common since full moons are said to be related to depressed mood. However, it is possible to use inverse conditions.
Users can also go long on higher moons (new moons or full moons occurring at a price that is higher than the previous one when a new/full moon occurred) and short on lower moons, this would return a trend following strategy, using the inverse conditions (buy lower moons/sell higher moons) would return a contrarian strategy.
The above chart displays the strategy using default conditions.
The above chart displays the strategy of going long on a higher moon and selling on a lower moon.
Quick Summary
We provide a quick summary of the strategy using default conditions (buy on a new moon, sell on a full moon) on various tickers using the 4h timeframe (note that using a lower timeframe would return a backtest executing a lower number of trades).
Constant position sizing is used and no frictional costs are considered.
BTCUSD
The moon phases strategy has been regularly tested with BTCUSD, with traders highlighting how moon phases tend to occur during tops/bottoms. We test the strategy from 2019-01-06 00:00.
Net Profit: $68544.86 Closed Trades : 67 % Profitability : 50.75 Max Drawdown : $18541.24 Max
TSLA
The strategy is tested from 2011-01-04 14:30
Net profit: $349.17 Closed Trades : 265 % Profitability : 54.34 Max Drawdown : $262.72
EURUSD
The strategy is tested from 2018-01-16 14:00.
Net profit: $-0.18 Closed Trades : 91 % Profitability : 50.55 Max Drawdown : 0.36

Simple Ema_ATR Strategy HulkTradingSimple EMA strategy, based on ema55+ema21 and ATR(Average True Range) and it enters a deal from ema55 when the other entry conditions are met
Basically long and short conditions
If long:
1) close must be less than open (because we are searching for a pullback)
2) emaFast(21) must be bigger than emaSlow(55) - for a trend detection
3) Difference between emaFast and emaSlow must be greater than ATR(14) - for excluding flat
For short conditions are opposite
Stop levels and take profits, based on ATR multiplier.
You can change it in input field.
I recommended values between 1 and 4, not more.
This strategy was tested on pairs BTCUSDT and ETHUSDT and have a nice results.

Cava Signals Backtesting/VisualizerPLEASE READ THE DESCRIPTION CAREFULLY
Trying this again, as it seems I keep violating the rules unintentionally. Moderator, please forgive me as I try to make this right.
This backtesting/visualizer script was created for me to get a visual idea of the Cava Signals indicator throughout its development time and continuous optimization.
This script is to be used on the 30-minute timeframe on supported markets, and whether I can only publish strategies on regular candles, the indicator is meant to trigger on heikin ashi candles.I understand backtesting on non-regular candles produces unrealistic results, but I emphasize that this script is more for visualization purposes rather than accurate $ amounts from the trades. The signals are used along with a dedicated bot configuration, so part of the strategy is not managed by the script, but by the bot's config.
Some behind the scenes on what we are looking at:
a combination of ema and sma crosses on different time frames (5m, 15m, 30m, 60m and 90m) - we call this the wave trend
a combination of stochastic rsi on different time frames (10m, 30m)
a combination of schaff trend cycles on different time frames (5m, 20m and 30m)
a combination of money flow index on different time frames (10m and 30m)
volume information for each supported market/pair
and a couple of other info particular to each pair
With the above combination of data points, we try to optimize our strategy for an entry, for dca'ing down in case the coin goes down as well as dca'ing up to maximize profit when a coin is going up, take profit levels when we recognize a good time to do so, and of course, a closing level. I would like to emphasize the *visualization* purpose of this script in recognizing lows, highs, and market structure to identify the important levels to signal - this script is NOT to be used for accurate backtesting, but for an idea of the overall performance of when signals are triggered.
Let me try to explain the workflow and icons you see on the chart:
The colored circles on the bottom of the chart are all buy signals; each color corresponds to a particular buy signal, we have a combination of 9 possible situations that would trigger a buy signal. Some would trigger a buy signal only in combination with other buy signals or other indicators within the script. we also display a green upwards arrow below bars when a buy signal is triggered.
The colored arrows pointing down on the top of the chart are close signals. We have a combination of 5 closing criteria each color corresponds to one, just like the buy signals do. We only close a trade in profit. If not in profit, we will look to DCA down.
DCA signals are shown by the green flag above bars. they are signals to DCA up or down depending on the trade being negative or positive. DCA'ing up or down is also managed by the bot's configuration for limits on when to accept the signal.
Take Profit levels are shown by the green diamond above bars and work in conjunction with the bot's config on when to take the signal if at all and other take profit levels. Usually, when we hit the first take profit level we move our stop loss to entry via the bot's take profit safety feature. You can see this call with the close entry named TPS .
The black bars you may see on the chart is to illustrate when the market is extended based on a particular strategy. During this period we will not trigger a buy signal unless there is a huge spike in positive volume .
The green number below the bars is the total positive delta volume on the buy candles.
On the table on the right upper corner, we show some information on the market and performance of the backtesting - for visualization purposes only!
Currently, the script is tailored to work with the following markets/pairs:
Binance Spot: ADA, ALGO, ATOM, AVAX, BNB, BTC , DOT, ETH, LINK, LUNA, MATIC, SOL, VET, XRP, XTZ
Binance Futures: BTC , ETH, ADA, ALGO, ATOM, BNB, COMP, DOT, ENJ , LINK, OCEAN, OMG, SOL, VET, XMR, XRP, XTZ, AVAX, AAVE, DOGE, LTC, LUNA, MKR , NEAR, ONT, RUNE, SUSHI, LTC, XLM , COMP, ONT, THETA, FTM , EGLD , WAVES, ONE, HTN , CHZ , HOT, MANA, CRV , RVN, BAT, ANKR, 1INCH, ALICE, ATA , AXS , CHR , COTI, NKN , RAY, REN, SRM , SXP , TLM
ByBit Inverse Perpetual: BTCUSD , ETHUSD
ByBit Futures: AAVE, ADA, ALGO, AVAX, AXS , BNB, BTC , DOT, ETH, LINK, LTC, MATIC, SOL, SUSHI, UNI , XEM, XRP, XTZ
The chosen pairs are subject to change based on the best-performing assets we are constantly analyzing.
I hope this helps to understand the script, its purpose and ideas. I hope this satisfies the community rules - it was not my intention to break them - if there's anything on the above or the script that still violates the guidelines, please let me know and accept my apologies in advance.
If anyone would like to know more, let me know in the comment section.
Thank you!

Keltner Channel + DMI + EMA Strategy @DaviddTechThis strategy is a long only strategy that evolves 3 main indicators.
It is optimised for ETH USDT and LONG ONLY
Long positions :
* EMA 50 is above the EMA 400 to define our trend direction.
* Price breaks above the upper band of the the Keltner Channel.
* Confirmation is found with the DMI + being over the DMI -
Other indicators :
ADX set to above 20
The TP I put at 20% and I use Multiple TP levels.
If the price crosses and closes below the Keltner Channel lower band I close the trade.
WARNING:
- For purpose educate only - My mission is to debunk fake strategies with code to find THE ONE.
- Plots EMAs and other values on chart.
- This script to change bars colours.

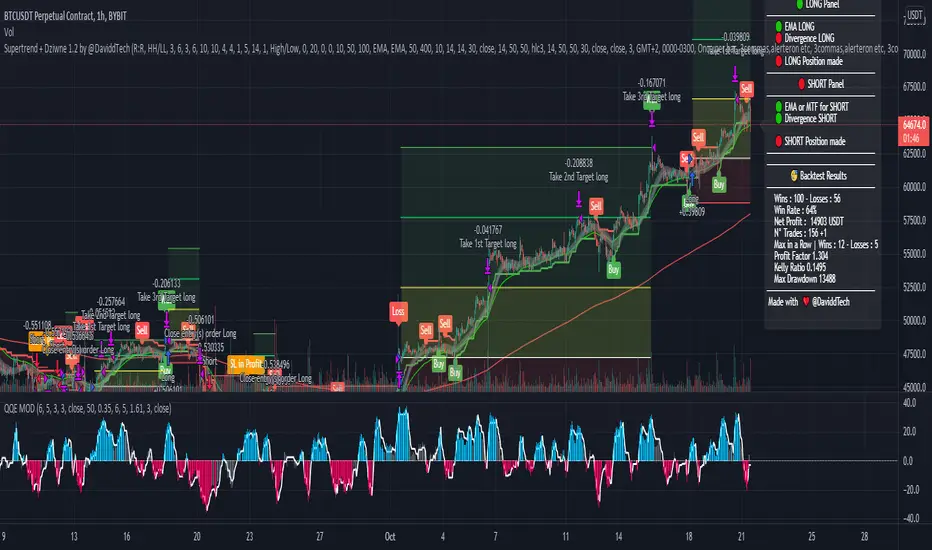
Supertrend + Dziwne 1.2 by @DaviddTechThis strategy uses the supertrend, Dziwne and the QQE.
Take a LONG :
* When the Supertrend is green.
* Dziwne Is in a long trend in green.
* QQE is in the blue.
Take SHORT
* When the Supertrend is red.
* Dziwne Is in a long trend in red.
* QQE is in the red.
TP can use either ATR or a %
Trend Indicator A-V2" and "Trend Indicator B-V2" are updated and improved versions of my initial trend indicators. Totally rethinking the code, adding highs and lows in the calculations, including some more customisation through colour schemes.
In practice, this indicator uses EMAs and Heikin Ashi to provide an overall idea of the trend.
The "Trend Indicator A-V2" is an overlay showing “Smoothed Heikin Ashi”.
Please, take into account that it is a lagging indicator.
WARNING:
- For purpose educate only - My mission is to debunk fake strategies with code to find THE ONE.
- Plots EMAs and other values on chart.
- This script to change bars colours.
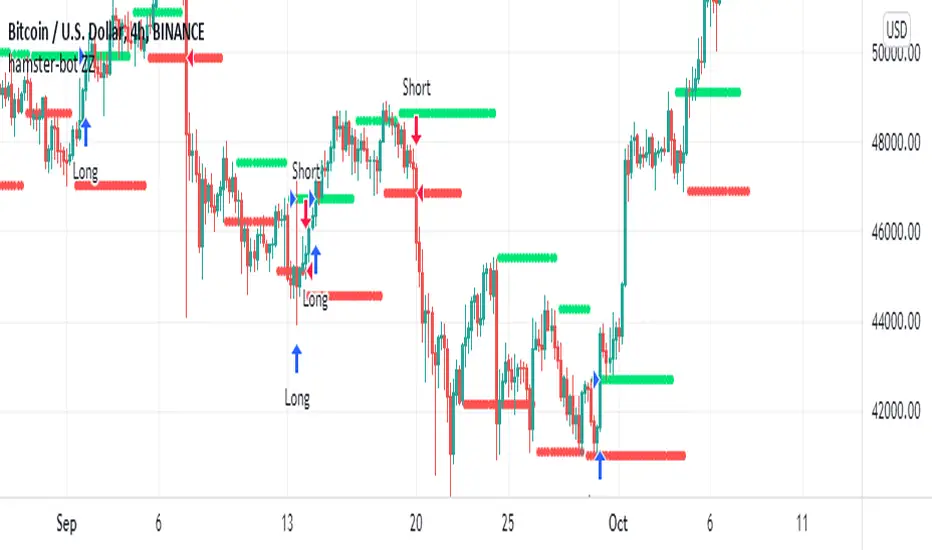
hamster-bot ZZCompilation of various modifications of the trend breakout reversal strategies based on the ZigZag .
Includes past versions of scripts:
version 1 ZZ2 Breakout reversal strategy
version 2 ZZ2 with experimental options hamster-bot ZZ Breakout reversal strategy
version 3 ZZ6 Noro's ZZ-6 by hamster-bot The original script is available here
The original script is available here
Description ZZ6 :
New version of ZZ-strategy.
Repaint?
Normal lines are not redrawn. Dotted lines repaint, but do not affect trading (do not affect backtests). You can turn off repaint in the script settings. Repaint (dotted lines) are needed only for clarity. To make it clear from which bar the level is created.
Levels
Lime lines above - level from a local high bar. To open a long position. Using a market stop order.
Red line at the bottom - the level from a local low bar. To open a short position. Using a market stop order.
Trading
You can trade without short positions. Then the red line is the level for a stop-loss order.
Reverse trading can be used. Without stop-loss orders.
Risk size
Order size depends on the risk size parameter and possible loss. If risk size = 2%, it means that the loss will be no more than 2%.
For crypto
Symbols: XBT/USD, BTC /USD, BTC /USDT, ETH/USD, etc - need USD(T)
Timeframes: 1h, 4h, 1d
This new ZZ strategy includes all the best practices for this strategy. the script has great flexibility of settings.
Instructions for script parameters:
Parameter ZZ Type - is responsible for the basic type of strategy used (usually it is responsible for building levels)
then you will need to configure the settings block corresponding to the selected ZZ type .
At the moment the script contains types: ZZ2 + ZZ6
The rest of the parameters are common for any type of ZZ.
Further development will be done in this script. The above scripts will not be updated.
At the moment the options are already available:
- Take Profit
- Stop Loss
- One entry Long/Short
- Single entry
- Levels offset
- Levels multiplier
- Levels angle
SirSeff's EMA RainbowThis strategy uses divergences between three exponential moving averages and their slope directions as well as crosses between the price and these moving averages to switch between a long or short position. The strategy is non-stop in the market and always either long or short.\
This trend trading strategy uses exponential moving averages of 10, 20, 50, 100, 150, 200 to gauge the price action cycle if it is on Stage 2 aka Mark up famously coined by Dr.Wykcoff.
It opens a position when the closing price crosses above the 10ema and all the exponential moving averages are stacked up together. Stacked-up Moving averages are used by Mark Minervini and Oliver Kell.
I close a position at an 8% trailing stop from the opened position which makes the succeeding buy orders as scaling up or averaging up from an established bullish trend.
All trading involves high risk; past performance is not necessarily indicative of future results. Hypothetical or simulated performance results have certain inherent limitations. Unlike an actual performance record, simulated results do not represent actual trading. Also, since the trades have not actually been executed, the results may have under-or over-compensated for the impact, if any, of certain market factors, such as lack of liquidity. Simulated trading programs in general are also subject to the fact that they are designed with the benefit of hindsight. No representation is being made that any account will or is likely to achieve profits or losses similar to those shown.

VCP pivot buyIt will buy the breakout of the pivot in a bullish trend which is defined by the Mark Minervini stage 2 template
Set the stop loss% and Target% in your favor ( recommend the stoploss% as the low percentile atrp )
It helps indicate the contraction point so that we can have a low-risk entry of a buy point.
It followed the strategy of Mark Minervini.
changing the lookback period input to change the percentile
changing the Pivot Length to decide how many bars you would consider as a pivot
changing the Close range to decide in how much percentage does the close range you would consider as a pivot
The percentile rank is represented in the colour of the background, you can alter how low you want to set to indicate lowering volatility.
The blue line shows the percentage range in ( pivot length) days/bars
The coloured background shows the signal of pivot point forming

Aphrodite// v4
// continuation of prime number checker with strat commands and normal distribution theory put in
//pump/dump trend following strategy idea added.
//Pseudo Random Number Generator Box Muller Normal Distribution Method - code from Function - Functions to generate Random values by RicardoSantos. Dots are calculated by an adaptation of the ideas
//in this script.
// volume accumulates when dots are green for buys, red for sells. This setup is just looking for buys but this is very easy to change
//just go to trading day and swap all strategy.long commands for strategy.short commands
// Exits on minutes where OHLC all return 'primeness'
//Reinforced dots (with black) when last three dots are all of same colour

Smart Entry BETAA Custom Unique indicator by NRTH_
Comes included with the Premium Package.
Indicator features
Built-In Alerts
Visual Risk Management
Customizable Entry Rules
Usage Tips
Smart Entry is currently a BETA algo. we are still in the process of tweaking and programming it only give entry signals when they are confirmed, and work of very strict parameters to allow for trading all the way down to the 5m timeframe. It is currently at a stage where it can produce profitable trades or even just act as a confirmation signal in use with another strategy, but this project will be ongoing until we can obtain high profitability levels on very low timeframes.
The algo uses both momentum and trend calculation to find an entry, highly recommended use with the built-in MA Filter for best results.
Works for all markets with the ability to customize to your liking.
Backtesting Results Info
Period 1/1/2021-1/10/2021
Entry value at $1000 with 10x leverage
Binance standard taker fee rate (0.04%)
ATR Exits : 1:2.9 RR
-------------------------------------------
Disclaimer
Copyright NRTH_ Indicators 2021.
NRTH_ and all affiliated parties are not registered as financial advisors. The products & services NRTH_ offers are for educational purposes only and should not be construed as financial advice. You must be aware of the risks and be willing to bear any level of risk to invest in financial markets. Past performance is not necessarily indicative of future results. NRTH_ and all individuals associated assume no responsibility for your trading results or investments.
All investments involve risk, and the past performance of a security, industry, sector, market, financial product, trading strategy, or individual’s trading does not guarantee future results or returns. Investors are fully responsible for any investment decisions they make. Such decisions should be based solely on an evaluation of their financial circumstances, investment objectives, risk tolerance, and liquidity needs.

Pullback AlgoFlagship NRTH_ Premium Strategy
Comes included with the Essentials or Premium Package.
Indicator features
Built-In Alerts
Visual Risk Management
Customizable Entry Rules
Usage Tips
This strategy is designed for Swing Trading and Intra-Day timeframes (1hr+)
The algo targets pullbacks in an up or down-trending scenario allowing for multiple entries in a strong trending market.
Works for all markets with the ability to customize to your liking.
Backtesting Results Info
Period 1/1/2021-1/10/2021
Entry value at $1000 with 10x leverage
Binance standard taker fee rate (0.04%)
ATR Exits : 1:2 RR
-------------------------------------------
Disclaimer
Copyright NRTH_ Indicators 2021.
NRTH_ and all affiliated parties are not registered as financial advisors. The products & services NRTH_ offers are for educational purposes only and should not be construed as financial advice. You must be aware of the risks and be willing to bear any level of risk to invest in financial markets. Past performance is not necessarily indicative of future results. NRTH_ and all individuals associated assume no responsibility for your trading results or investments.
All investments involve risk, and the past performance of a security, industry, sector, market, financial product, trading strategy, or individual’s trading does not guarantee future results or returns. Investors are fully responsible for any investment decisions they make. Such decisions should be based solely on an evaluation of their financial circumstances, investment objectives, risk tolerance, and liquidity needs.

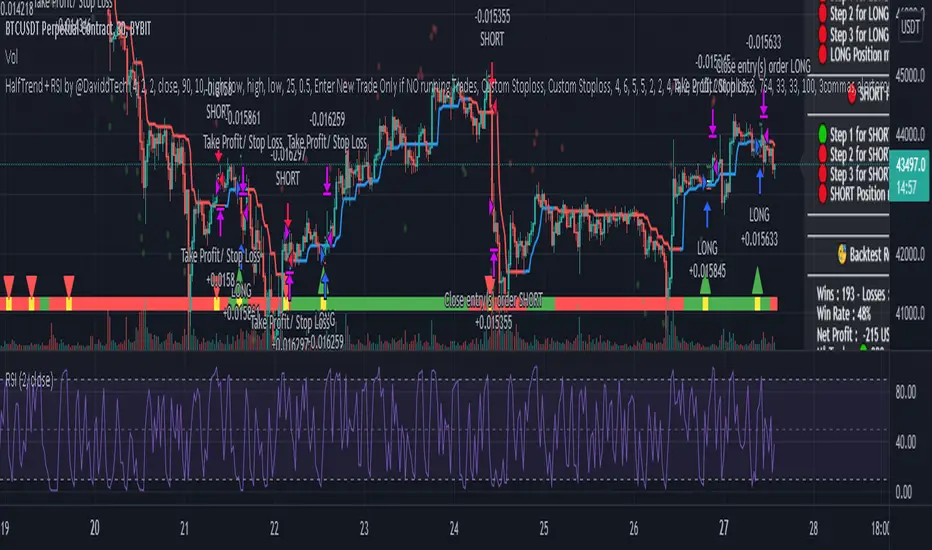
HT + RSI Pullback by @DaviddTechThis strategy uses the HT algo and the RSI.
The HT is used to find the global trend and RSI on a length of 2 to find pullbacks.
Long Positions :
* HT is in the blue.
* RSI on length 2 goes in to oversold < 10
* Trigger candle closes higher that the high of the previous candle.
Short Positions :
* HT is in the red.
* RSI on length 2 goes in to overbrough > 90
* Trigger candle closes lower that the low of the previous candle.
Stop loss is the swing low or high.
TP Short :
* The RSI moves back down below the 10
TP Long
* The RSI moves back up above the 90
WARNING:
- For purpose educate only - My mission is to debunk fake strategies with code to find THE ONE.
- Plots EMAs and other values on chart.
- This script to change bars colors.
If you have any questions or feedback, please let me know in the comments.
Ultimate ABC Reversal by @DaviddTechIn this indicator we are looking for HH & LL to create an ABC pattern.
Shorts are defined by an ABC pattern.
Short:
* Starting with a low to a Higher High
* Breaking that trend to a new low
* Creating a new Higher High (FOMO HH)
* If the price breaks below the previous HH we have our entry.
Longs:
* Starting with a Hight to a Lower Low
* Breaking that trend to a new high
* Creating a new Lower Low (FOMO LL)
* If the price breaks above the previous LL we have our entry.
Stop loss just above or below the FOMO LL/HH.
Take Profit using a Fib or Risk to Reward.
WARNING:
- For purpose educate only - My mission is to debunk fake strategies with code to find THE ONE.
- Plots EMAs and other values on chart.
- This script to change bars colors.
If you have any questions or feedback, please let me know in the comments.

The Cloud AIThis Script uses the DonChain + EMA and an Average to create a trend cloud.
* When the cloud crosses to red it will print a red triangle mean a potential pullback.
* In a Green cloud green dots are printed after small pullback for scalps or continuation.
* A green or red star is an entry for the strategy which is defined by the all the slow and fast parameters crossing.
Exits will happen when the red or green star is printed.
All these levels help traders see where the price could experience support or resistance, these support and resistance levels can be used by traders to determine entry and exit points.
Using Machine learning I optimised this to work with BTC you can optimise the settings to most markets.

Average Highest High and Lowest Low Swinger StrategyThis is a full price action strategy designed for trending markets such as crypto and stocks.
Its purely made on calculations for the highest high and lowest low using 2 different length , a faster and a slower one.
With those we make multiple averages.
Rules for entry:
For long: our close of the candle is above both the average using fast and slow line
For short: our close of the candle is below both the average using fast and slow line
Rules for exit
We always exit when we have an opposite order
Caution
This strategy use no risk management system, so be careful with it
If you have any questions, let me know

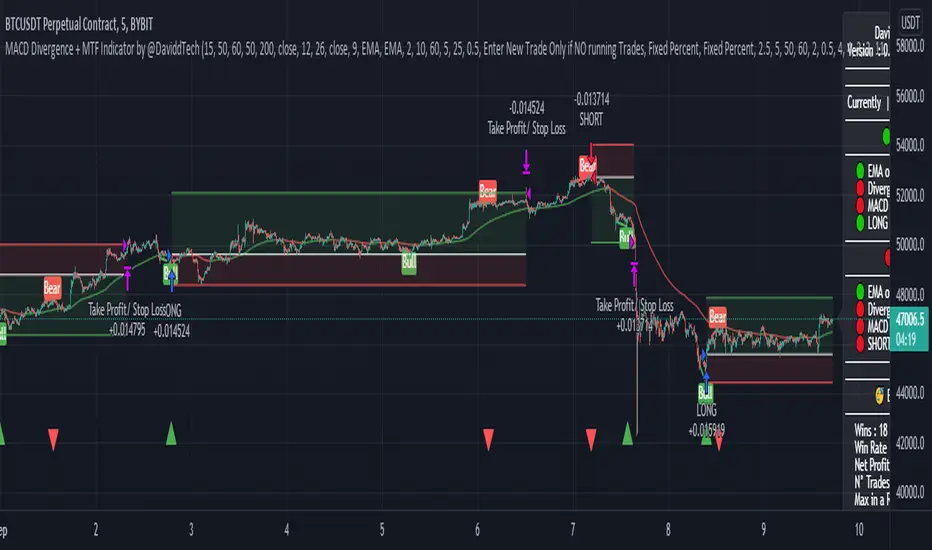
MACD Divergence + MTF EMA Reversal by @DaviddTechMACD Divergence + MTF Indicator / EMA by @DaviddTech
Long :
* Find Divergence in the MACD line
* Multi Time Frame EMA 50 15 minutes above Multi Time Frame EMA 50 60 minutes
* MACD and Signal line are below the 0 line
* MACD crosses above the Signal line
Short :
* Find Divergence in the MACD line
* Multi Time Frame EMA 50 15 minutes below Multi Time Frame EMA 50 60 minutes
* MACD and Signal line are above the 0 line
* MACD crosses below the Signal line
EMA usages instead.
* I found that as a strategy this could work better with the 200 EMA line.
* Trends reversals also gave good results.
Trend Reversals :
* Price is below EMA 200 - Take LONG on divergence.
* Price is above EMA 200 - Take SHORT on divergence.
** You may need to turn off MTF ema when using the Simple EMA 200
WARNING:
- For purpose educate only - My mission is to debunk fake strategies with code to find THE ONE.
- Plots EMAs and other values on chart.
- This script to change bars colors.
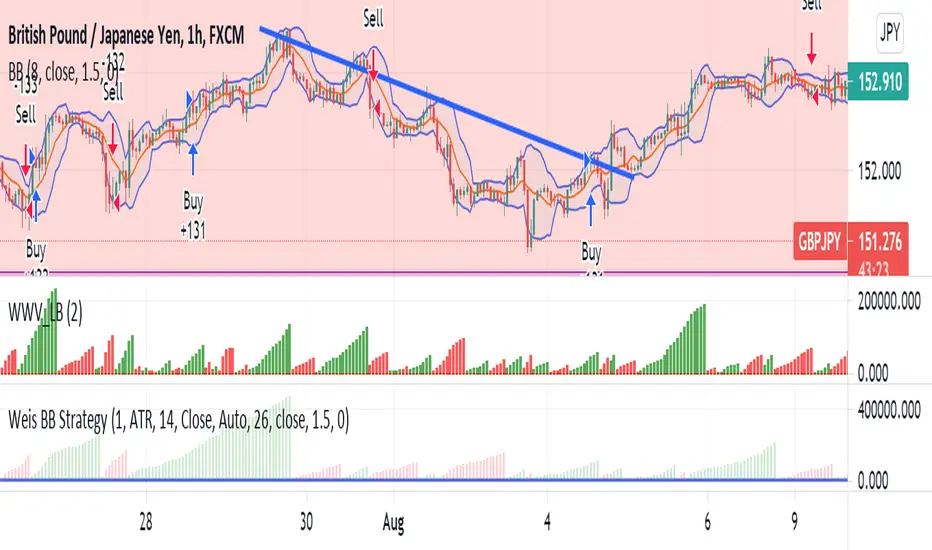
Weis BB StrategyThis is a strategy based on Weis Wave & EMA. Weis Wave Volume is used to determine the overall trend and Bollinger Band to determine the Price breaking out from resistance zones.
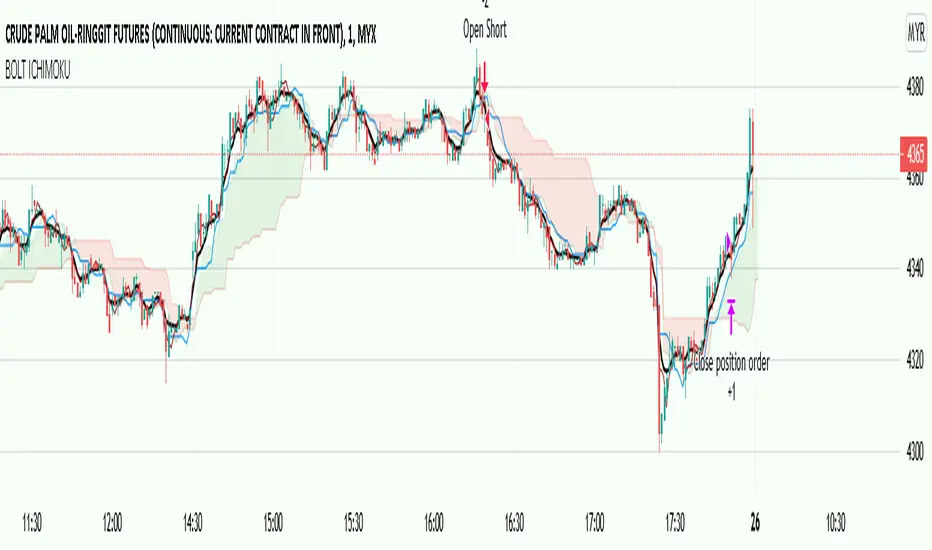
BOLT ICHIMOKUThis strategy is based on custom ichimoku cloud to be used best in 1 minute time-frame. The buy and sell condition must met 3 conditions before it is legit. The strategy backed by ichimoku cloud for initial trend identification, RSI for momentum bias and EMA for major trend bias.
Currently, only tested in Futures Crude Palm Oil (FCPO) market. Maybe can be used in other different markets, user have to test it by themselves.
User can toggle/enable the stop-loss and take-profit value at the bottom of the settings.