Trend Line RegressionThis is a fast trend line regressor based on least squares regression.
(1) Supports setting regression from the Nth candle
(2) Supports the minimum and maximum regression candle interval length
(3) Supports finding the optimal regression region based on the length step among the minimum and maximum regression region lengths
(4) Supports displaying the optimal regression level
(5) The size of the regression region is 0.5 times the standard deviation by default
(6) You can filter the trend line by setting minimum trend line regression level
(6) Please properly set the parameters to avoid calculation timeout
Enjoy!
这是一个基于最小二乘法回归的快速趋势线回归
(1) 支持从第N根蜡烛开始设置回归
(2) 支持最小和最大的回归蜡烛区间长度
(3) 支持在最小和最大回归区间长度的基础上寻找最佳回归区域
(4) 支持显示最佳回归水平
(5) 回归区域的大小默认为标准差的0.5倍
(6) 可以通过设置最小趋势线回归等级来过滤趋势线
(6) 请正确设置参数以避免计算超时
使用愉快!
Cerca negli script per "trend"

Trend Trading with Currency Strength MeterThis is a trend trading strategy designed mainly for forex made of two big components:
First we have the currency meter, which is made of taking TSI of different INDEXes such as EUR, USD, GBP, JPY, NZD, AUD , CHF and CAD.
Once we establish which one is the weakest and most powerful, we pair them together and we go on that chart.
Lastly we check with the EMA 200 to confirm our direction.
We can see in this example for the USDJPY chart, that USD is the strongest, JPY is the weakest and ema confirm our bullish trend.
For timeframe in general I recommend big timeframes, 1-4h+ , and as a mentality a swing trading mentality, we can stay in trade for days/weeks.
For exit in general I recommend to exit when either one of the pairs losses/gain power or when the EMA is crossing with current candle
If you have any questions, let me know !

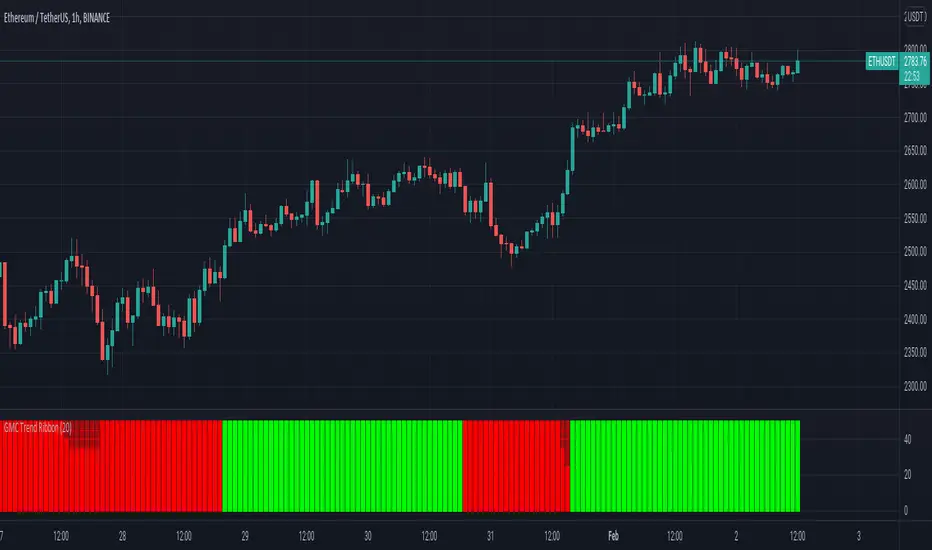
GMC Trend FilterAvoid Fake Signals, and identify the trend.
How it works ?
- it calculates main trend direction by using the length that is user-defined. so you can change it as you wish
- then it calculates trend direction for each 9 lower lengths. if you set the length = 20 then the lengths are 19, 18,...11
- and it checks if the trend directions that came from lower lengths is same or not with main trend direction.
- it changes the trend color of the ribbon.
Super Multi Trend [Salty]This script uses the 5, 8, 13, 21, 34 low, 34 close, 34 high, and 55 EMAs in comparison to each other to gauge momentum and trend strength for the current ticker. Additionally, it provides the ability to compare to 3 additional tickers at the same time (Uncheck boxes in settings to hide if desired). For the Super Trend Row darker colors are more bearish than lighter colors, and consequently lighter colors are more bullish than darker colors. Yellow indicates a neutral or choppy market. Fully stacked EMAs are shown with a Light Green (Lime) color for the bullish condition, and Dark Red for the bearish condition.

Fusion: Trend and thresholdsThis is your basic single moving average but with a "slope" component. The idea here is that once a slope reaches a value great enough you should probably only trade with the trend so this indicator allows you to set that threshold separately for going long and short.
The indicator is designed to display on both the main chart and a separate chart area. If you want to display it on the main chart then the quick way is to just check the "On main chart" option and it will disable off main chart items and then just move it to the main chart.
There's half a dozen or so moving average types to select from so you will probably find one that suits you pretty well.
Once a threshold is reached you will get a signal showing the trend is strong enough where you probably should not trade in the opposite direction.
There is a "normalize" option which will fix the oscillator to a maximum of 100. The upside of this is that you can be more consistent in your settings of a threshold. The down side is that normalization happens over a predefined number of bars so it's a floating number, not an absolute number however I set the number of bars default to 3,000 so it should be pretty close to ideal. I haven't found a perfect way of getting a consistent maximum on the oscillator as a benchmark yet so if anyone has any ideas please contact me and I'll do an update. I may look into using percentage rank instead of normalization.
I like to see it as both an oscillator and on the main chart so I generally have two copies.
The settings are certainly not optimized so set to whatever suits your needs as my defaults will probably be wrong for you.
The code is structured to easily drop into a bigger system so use it as a lone indicator or add the code to some bigger project you are creating. If you do, send me a note, it would be nice to know it's being well used.
Finally, if you find value please do make a comment, give a thumbs up etc.
Enjoy and good luck!

[Sextan] %R Trend Exhaustion BacktestLevel: 1
NOTE: This is a request by @upslidedown to backtest %R Trend Exhaustion by upslidedown with my Sextan framework. You can backtest many of my indicators in minutes now! Of course,you can define your own indicator in the highlighted area in compliance with the uniform format, which guarantee when you use "Indicator on Indicator" function, it would not produce any error.
Courtesy of upslidedown for his %R Trend Exhaustionindicator
Background
Backtesting of technical indicators and strategies is the most common way to understand a quantitative strategy. However, the complicated configuration and adaptation work of backtesting many quantitative tools makes many traders who do not understand the code daunted. Moreover, although I have written a lot of strategies, I am still not very satisfied with the backtest configuration and writing efficiency. Therefore, I have been thinking about how to build a backtesting framework that can quickly and easily evaluate the backtesting performance of any indicator with a "long/short entry" indicator, that is, a "simple backtesting tool for dummies". The performance requirements should be stable, and the operation should be simple and convenient. It is best to "copy", "paste", and "a few mouse clicks" to complete the quick backtest and evaluation of a new indicator.
Luckily, I recently realized that TradingView provides an "Indicator on Indicator" feature, which is the perfect foundation for doing "hot swap" backtesting. My basic idea is to use a two-layer design. The first layer is the technical indicator signal source that needs to be embedded, which is only used to provide buy and sell signals of custom strategies; the second layer is the trading system, which is used to receive the output signals of the first layer, and filter the signals according to the agreed specifications. , Take Profit, Stop Loss, draw buy and sell signals and cost lines, define and send custom buy and sell alert messages to mobile phones, social software or trading interfaces. In general, this two-layer design is a flexible combination of "death and alive", which can meet the needs of most traders to quickly evaluate the performance of a certain technical indicator. The first layer here is flexible. Users can insert their own strategy codes according to my template, and they can draw buy and sell signals and output them to the second layer. The second layer is fixed, and the overall framework is solidified to ensure the stability and unity of the trading system. It is convenient to compare different or similar strategies under the same conditions. Finally, all trading signals are drawn on the chart, and the output strategy returns. test report.
The main function:
The first layer: "{Sextan} Your Indicator Source", the script provides a template for personalized strategy input, and the signal and definition interfaces ensure full compatibility with the second layer. Backtesting is performed stably in the backtesting framework of the layer. The first layer of this script is also relatively simple: enter your script in the highlighted custom script area, and after ensuring the final buy and sell signals long = bool condition, short = bool condition, the design of the first layer is considered complete. Input it into the PINE script editor of TradingView, save it and add it to the chart, you can see the pulse sequence in yellow (buy) and purple (sell) on the sub-picture, corresponding to the main picture, you can subjectively judge that the quality of the trading point of the strategy is good Bad.
The second layer: "{Sextan} PINEv4 Sextans Backtest Framework". This script is the standardized trading system strategy execution and alarm, used to generate the final report of the strategy backtest and some key indicators that I have customized that I find useful, such as: winning rate , Odds, Winning Surface, Kelly Ratio, Take Profit and Stop Loss Thresholds, Trading Frequency, etc. are evaluated according to the Kelly formula. To use the second layer, first load it into the TrainingView chart, no markers will appear on the chart, since you have not specified any strategy source signals, click on the gear-shaped setting next to the "{Sextan} PINEv4 Sextans BTFW" header button, you can open the backtest settings, the first item is to select your custom strategy source. Because we have added the strategy source to the chart in the previous step, you can easily find an option "{Sextan} Your Indicator Source: Signal" at the bottom of the list, this is the strategy source input we need, select and confirm , you can see various markers on the main graph, and quickly generate a backtesting profit graph and a list of backtesting reports. You can generate files and download the backtesting reports locally. You can also click the gear on the backtest chart interface to customize some conditions of the backtest, including: initial capital amount, currency type, percentage of each order placed, amount of pyramid additions, commission fees, slippage, etc. configuration. Note: The configuration in the interface dialog overrides the same configuration implemented by the code in the backtest script.
How to output charts:
The first layer: "{Sextan} Your Indicator Source", the output of this script is the pulse value of yellow and purple, yellow +1 means buy, purple -1 means sell.
The second layer: PINEv4 Sextans Backtest Framework". The output of this script is a bit complicated. After all, it is the entire trading system with a lot of information:
1. Blue and red arrows. The blue upward arrow indicates long position, the red downward arrow indicates short position, and the horizontal bar at the end of the purple arrow indicates take profit or stop loss exit.
2. Red and green lines. This is the holding cost line of the strategy, green represents the cost of holding a long position, and red represents the cost of holding a short position. The cost line is a continuous solid line and the price action is relatively close.
3. Green and yellow long take profit and stop loss area and green and yellow long take profit and stop loss fork. Once a long position is held, there is a conditional order for take profit and stop loss. The green horizontal line is the long take profit ratio line, and the yellow is the long stop loss ratio line; the green cross indicates the long take profit price, and the yellow cross indicates the long position. Stop loss price. It's worth noting that the prongs and wires don't necessarily go together. Because of the optimization of the algorithm, for a strong market, the take profit will occur after breaking the take profit line, and the profit will not be taken until the price falls.
4. The purple and red short take profit and stop loss area and the purple red short stop loss fork. Once a short position is held, there will be a take profit and stop loss conditional order, the red is the short take profit ratio line, and the purple is the short stop loss ratio line; the red cross indicates the short take profit price, and the purple cross indicates the short stop loss price.
5. In addition to the above signs, there are also text and numbers indicating the profit and loss values of long and short positions. "L" means long; "S" means short; "XL" means close long; "XS" means close short.
TradingView Strategy Tester Panel:
The overview graph is an intuitive graph that plots the blue (gain) and red (loss) curves of all backtest periods together, and notes: the absolute value and percentage of net profit, the number of all closed positions, the winning percentage, the profit factor, The maximum trading loss, the absolute value and ratio of the average trading profit and loss, and the average number of K-lines held in all trades.
Another is the performance summary. This is to display all long and short statistical indicators of backtesting in the form of a list, such as: net profit, gross profit, Sharpe ratio, maximum position, commission, times of profit and loss, etc.
Finally, the transaction list is a table indexed by the transaction serial number, showing the signal direction, date and time, price, profit and loss, accumulated profit and loss, maximum transaction profit, transaction loss and other values.
Remarks
Finally, I will explain that this is just the beginning of this model. I will continue to optimize the trading system of the second layer. Various optimization feedback and suggestions are welcome. For valuable feedback, I am willing to provide some L4/L5 technical indicators as rewards for free subscription rights.

Trend Volatility Tops and Bottoms
Big Picture:
Overall what this script try's to capture is bounces off of moving trend lines.
What you will see when using this script
one Green line, one red line, two gray lines and circles in colors blue, green, red, and purple.
RED AND GREEN LINES:
There are two trend lines, an upper and a lower line that are 1 to 2 standard deviations from the linear regression line formed by the closing price for a look back period. The green is the distance from the close price and the lower line. The red is the list from the close and the upper line. (you don't see the lower and upper lines, but yo do see the green and red lines)
The goal is too easily see when price is approaching those support and resistance levels.
GRAY LINES:
GRAY lines are a form of volatility metric. GRAYS represent the distance from the RED and GREEN lines talked about above. low volatility mean the two GRAY lines will be close and times of high volatility will be father apart.
COLORED CIRCLES:
the color circles represent possible bounce zones, when price is high or low for for a given time period.
PURPLE is caution that there could be a possible price drop
RED is a critical zone for rejection and price drop
BLUE is caution that there could be a possible price increase
GREEN is a critical zone for bounce and price increase
how its used
feel free to play around and Try new things but, how its intended to be used is on 4hr time Frame looking for longer term trends on assets that tend to be less volatile on average.
settings
some settings:
buy deviation, this will say how many standard deviations do you want the lower bounce line to be from the linear regression line
sell deviation, this will say how many standard deviations do you want the upper bounce line to be from the linear regression line
dist to zero buy: how close dose the price has to be to put out a possible bounce.
Recap
-red and purple = possible upcoming price drop... red is more critical than purple
-green and blue = possible upcoming price increase... green is more critical than blue
-use on less volatile assents and on 4hr timeframe
good luck!

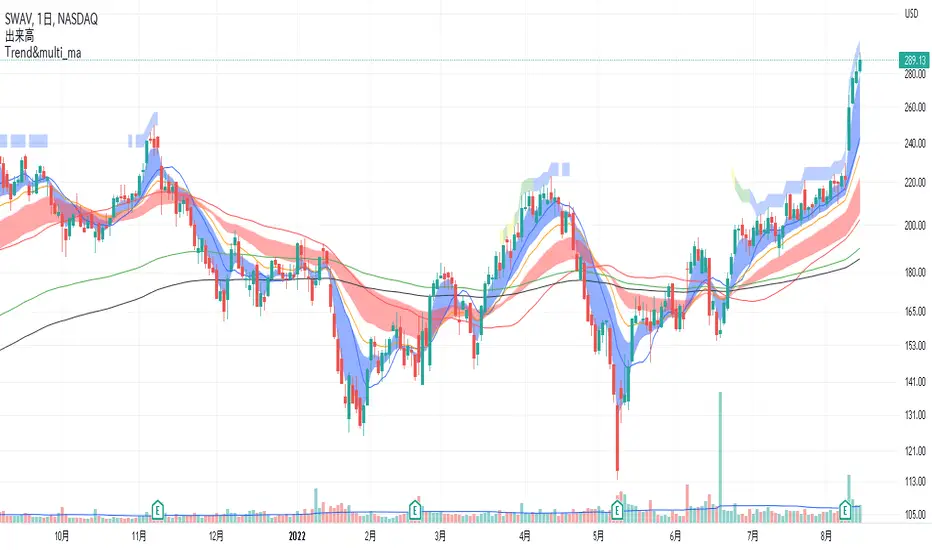
trend judgment & multi ma1 The background is filled with the number of matches to the trend template.
For the following conditions, 7 matches are yellow, 8 matches are green, and 9 matches are blue.
1. the stock price is above the 150-day MA and 200-day MA
2. the 50-day MA is above the 200-day MA
3. 200-day MA is in an uptrend for at least one month
4. 50-day MA is above 150-day MA and 200-day MA
5. stock price is 25% or more above 52-week low
6. stock price is 0 - 25% below 52-week high
7. IBD RS is above 70, preferably in the 90s → I don't know the exact formula, so I'm approximating with a formula that gives similar values.
8. when the stock is breaking above the base, the stock price is above the 50MA → It is difficult to judge the base itself, so it is not included in the conditions.
9. volume is high during an upward and low during a downward → volume during an upward > volume during a downward in the past 20 periods.
ex1. the 5-day MA is above the 20-day MA.
2 multi moving averages are shown.
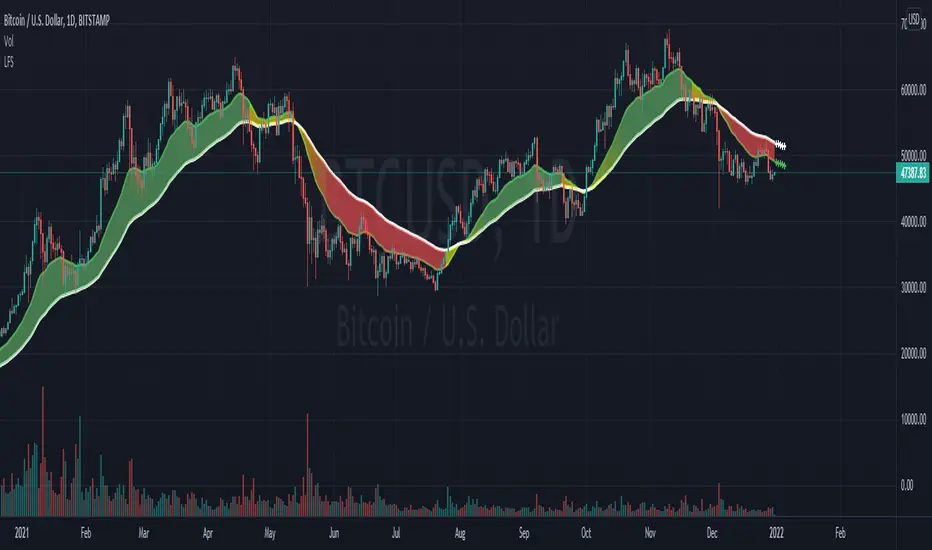
Leonidas Trend Following SystemThis indicator is the combination of the Exponential Moving Averages 55, 21.
This indicator is indicator will help to identify when the trend is reversing because the gradient of the colors.
this indicator is projecting the Moving Averages according to the slope.
Kijun Trend IndicatorName: Kijun Trend Indicator
Category: Trend Analysis
Timeframe: All timeframes
Suggested usage: In a trending market, to understand when it is good to enter short (red line) and when to enter long (blue line).
Technical Analysis: The original idea was taken from Larry Williams: an uptrend is identified when the price is above an 18-period simple moving average (SMA) and when at least two candles do not touch the simple moving average with their lows. The opposite is true for a downtrend.
Corrado Rondelli has therefore reinterpreted with Ichimoku aka "ichimokized" replacing the 18-period Simple Moving Average with the 26-period Kijun - as per the original Ichimoku settings.
In order to make the indicator more flexible an Exponential Moving Average (EMA) has also been added.
The indicator plots the chosen line that becomes red when it is good to enter short and blue when it is good to enter long.
Configuration:
- Length: period to be used to calculate the line.
- Type: the line type that can be the Kijun (26-period) or SMA/EMA (18-period)

[mdeacey] EMA% Channel + Bollinger Band Trending StrategyThis strategy is based off the users selection of an EMA and percentage defined middle, upper and lower channels. The strategy longs if the price crosses the middle to upper channel until such time that a "reversal candle" (that exceeds the averages of 3 and 9 above the EMA 3) is found – and then shorts that reversal candle in the hope the price will change state from trending to ranging and move back to the middle channel. The same but opposite process for shorts.
The two obvious fallbacks to this strategy are that:
- Once trending the price can continue upwards. We try to mitigate this through use of a stoploss defined by ATR.
- Certain percentage thresholds can trigger a long/short with not much room to move before coming back to the middle channel. This is a tightrope exercise as making the percentage channels tighter misses earlier entries in more optimal cases. Change the parameters to find an EMA and percentages to find the best R/R.
All options are configurable and code open source. Happy trading!

TrendStrength Turbo Bars - Directional TrendsMy interpretation of Danielle Shay's popular SimplerTrading TrendStrength Turbo indicator.
The TrendStrength indicator is based on a Fibonacci-based stacked EMA arrangement using the 5, 8, 13, 21 and 34 EMAs:
-> Green bars indicate an uptrend i.e. when the EMAs are positively stacked - there is more upward pressure than downward pressure in the price;
-> Red bars indicate a downtrend i.e. i.e. when the EMAs are negatively stacked - there is more downward pressure on the price; and
-> Yellow bars indicate no strong directional trend and potential for a reversal.
Volume spikes 50% above average volume are then flagged as dots at the bottom of the chart further confirming price momentum.
This indicator should compliment other popular indicators, as confirmation whether to stay in a position or not.
[LanZhu] - Bursa Index/Sector Trend With PortfolioDescription
Hi all, this is a simple indicator that shows trend of both KLCI and sectors of Bursa . The sector finding is using my Bursa_Sector library. Besides, I have also included portfolio tracker which is by Mohamed3nan in this script.
Usage
Top Trend - Malaysia KLCI Index Trend
Bottom Trend - Any Bursa Sector Trend
Portfolio Table - Copy from Portfolio Tracker by Mohamed3nan

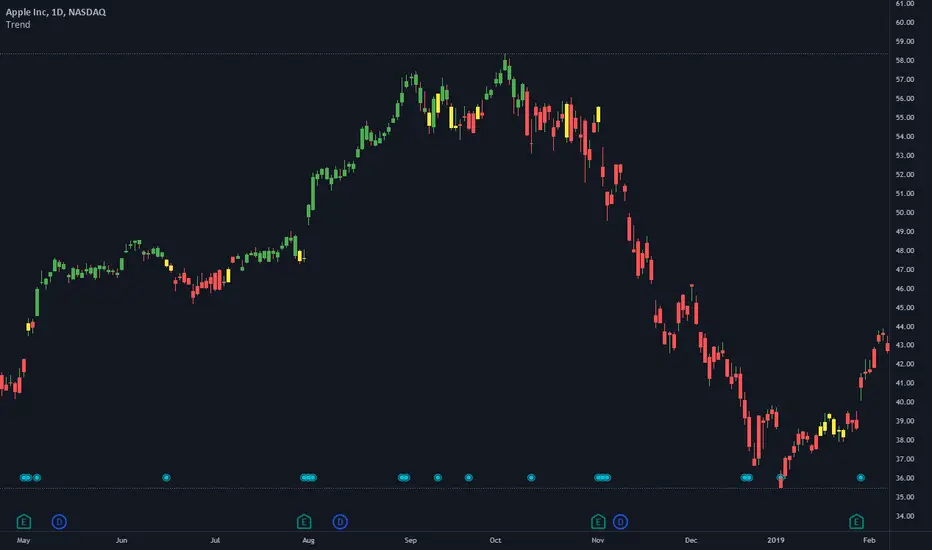
Baekdoo arrows (white : long term CCI trend changing signal)Hi forks,
I'm trader Baekdoosan who trading Equity from South Korea. This long term CCI trend changing signal will gives you good buy point for a long term trading.
As you know, CCI ( Commodity Channel Index ) is the indicator of how difference from MA(Moving Average). If CCI (period) value is 0 then it is the same value of the SMA (price, period). Indication of overselling or overbuying will be counted by -100 and 100 value of CCI . What I chose value is 240. which is almost a year of period. My signal will be plotted this long term CCI indicator cross over -100. But I don't want it to be marked in case of long term CCI value fluctuating from -101 to -99 which will be marked frequently. Thus I put candle counter of 60 days after cross under -100 then only I count for cross over -100. By this I have very good signal to mark on the chart. Please enjoy my signal and have good profit from it~! Gazua~!

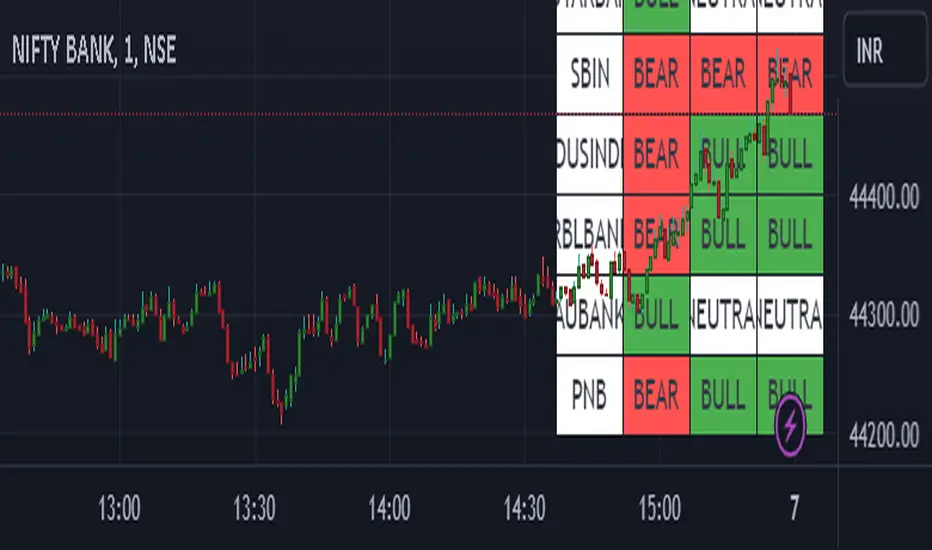
BANKNIFTY list of stocks RSI trend on multi time frame This script gives you an overview of banknifty and its underlying heavy weight stocks based on RSI
You can view the trend in single chart in 3 different time frames.
Color indication green for bullish and red for bearish trend and white for neutral
Symbol name shows green if the current day change is positive. Else red color
Multi TimeFrame (MTF) Trend StrengthCalculate and display simple multi timeframe (3 timeframe) trend strength using heikin ashi.

Jacky Trend ExpertThe Trend expert is a calculation of SMA and MA for a special trend formula to estimate the momentum of the daily Trend.
Basically, it is how it read:
1. Red candle is shorterm uptrend.
2. Green candle is a short-term downtrend.
3. The height of the candle is momentum price bet stronger or weaker.
4. Maroon color line is the EMA 20 days. The trend above EMA20 is stronger.

FXFUNDINGMATE TREND INDICATORA simple trend continuation strategy based on Ichimoku, moving average, Stochastic and MACD

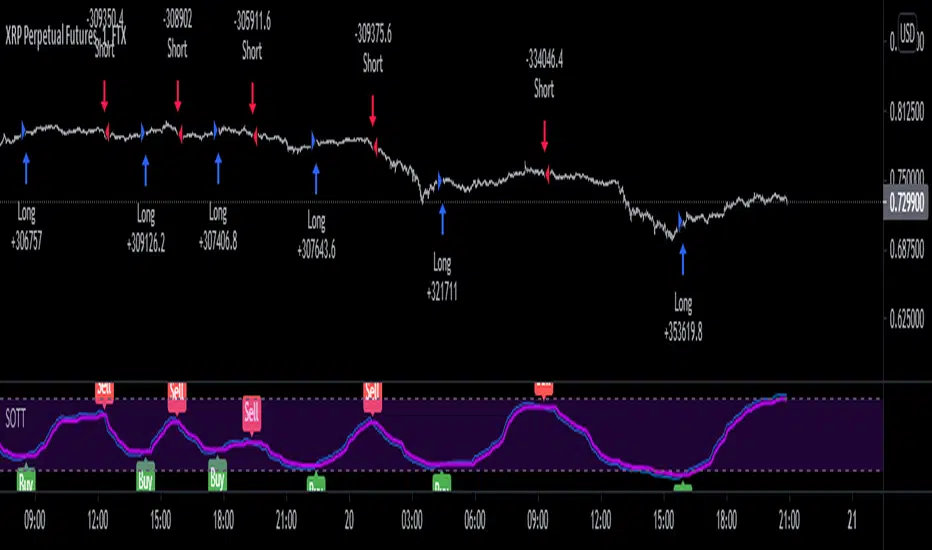
Stochastic Optimized Trend Tracker *Strategy*Stochastic OTT is Anıl Özekşi's latest derived version of Optimized Trend Tracker on Stochastic Oscillator.
He tried to solve the fake signals of Stochastic Oscillator by adopting OTT on the indicator.
He advised users to set the stochastic smoothing parameters to 500 and 200 on his latest video about SOTT.
He personally uses 1 min charts on stock market so the parameters of the indicator might have to be optimized for other time frames nad markets.
He exaggerated the Stochastic to 1000's to have better signals of percent values of OTT .
Also hes used VIDYA in both calculations of OTT and Stochastic smoothing.
Said, Kıvanç Özbilgiç.
I just made a Strategy version of the script so that we lads can backtest it. The codes for that are yet again from Kıvanç Özbilgiç :) I just copy-pasted a few and did some adjustments. Hope you enjoy!
#betonyetmez
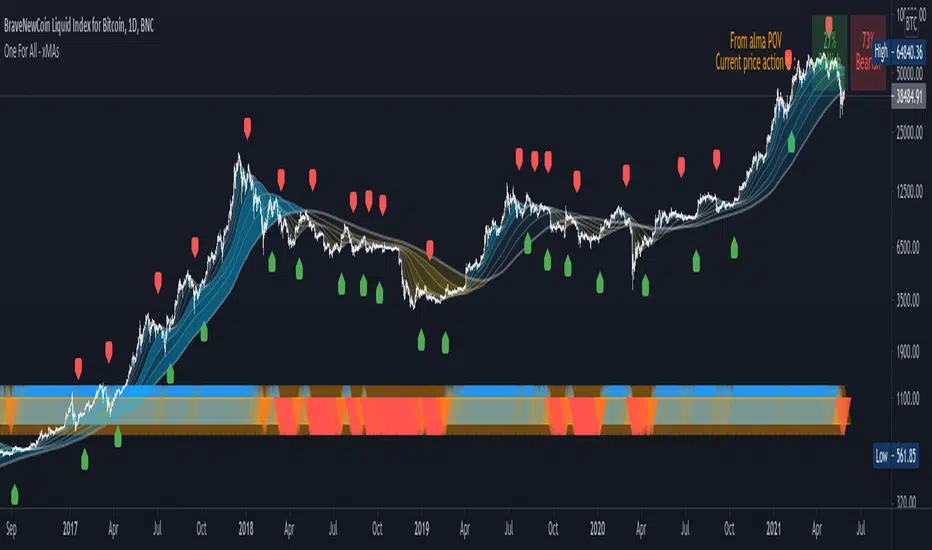
One For All - xMAs : wave ribbon + trend strenght + xMAcrossThis script is not intended to bring anything new or original, but mainly for educational purposes and aesthetic visualization of 10 moving average behavior.
Main features :
Moving Averages : as shown by the wave ribbon (the gradient colored areas opacity is correlated with the distance from the Nth xMA to the last xMA)
Trend Strenght : as shown by the blue/orange/red triangle shape plotted at the bottom of the chart
Moving Average Cross Signal : as shown by the labels green LabelUp and red LabelDown
Also it is designed to be easily customizeable as the settings allow to:
Chose different smoothing method for the 10 xMAs plotted
Manually setup the length of each xMA or simply select a predefined list of convenient length
Choose different MA length not only for crossover but also for crossunder
Trend Strenght explanation :
When all the "fast xMA" are above "slow xMA" there is an opaque Blue UpTriangle plotted at bottom (bull trend)
As more "fast xMA" fall/cross below "slow xMA", the Blue UpTriangle will start fading to a translucid orange UpTriangle
As even more "fast xMA" fall/cross below "slow xMA", a Red DownTriangle is plotted insteand and become more and more opaque as more MA fall below others
Overall, this means that the opacity of the triangles represent trend strenght and a fading trend is shown by the color fading into a translucid orange color
p.s. : If you would like to see some other MA calculation method included, please comment below, I'd be happy to update this script
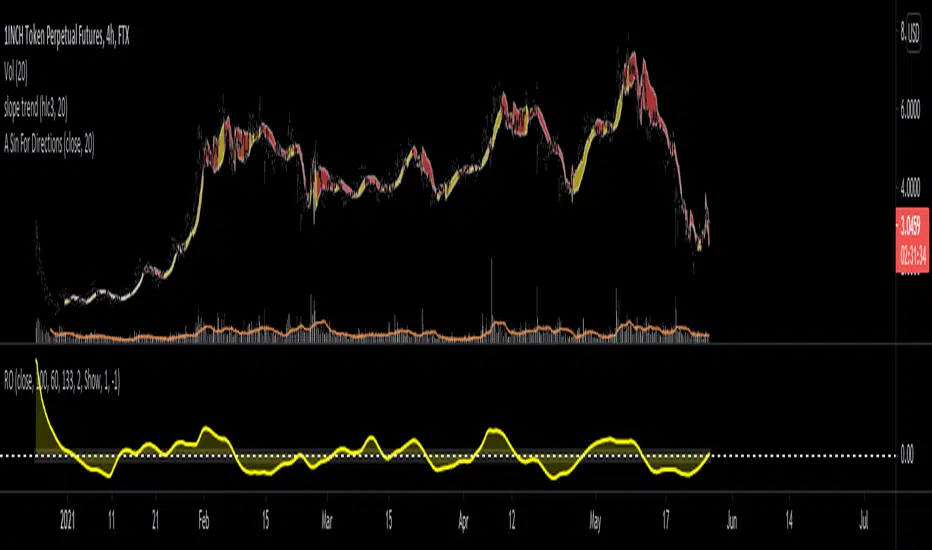
A Sin For Directions ROC Adaptive Length Trend Following In the same family as the slope trend indicator, but with this one being based on the function x - sinx , which mimics prices moving down and up. Using this we use ROC to determine a lower and upper level which will indicate whether not the path is still being followed.
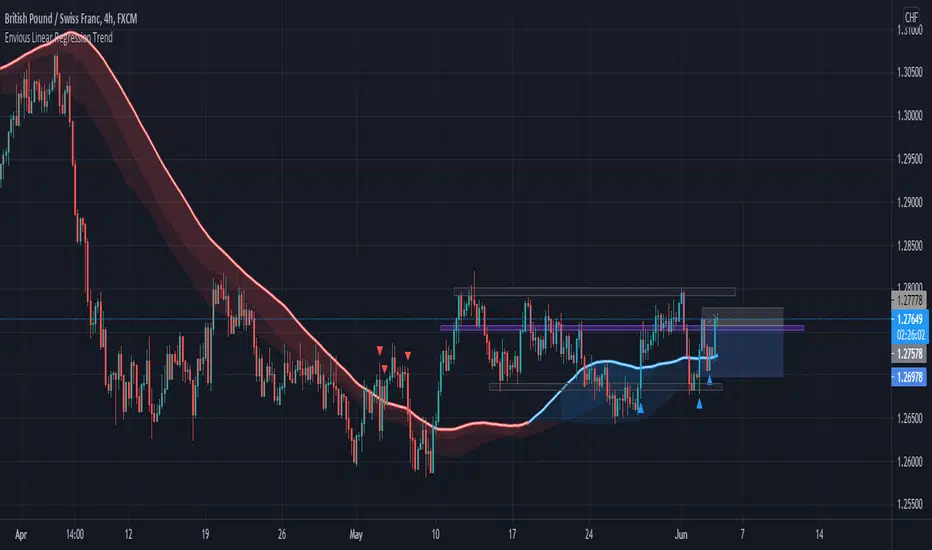
Envious Linear Regression TrendHey traders, this is a linear regression moving average trend indicator that is designed to filter out noise and give you a better insight of the current trend in the market. The design is a linear regression cloud that covers above the price or below the price and it changes colour based on the current dominant line through the crossover and crossunder feature. This indicator should be used as a confluence and not as a "trade the crossover indicator" and it is recommended that you combine this with analysis such as support and resistance to see how the market is doing. This indicator works best with Heikin Ashi candlesticks and it supports all chart types too.
Features:
3 Length Modes that are changeable via input on the settings.
Custom Bar Colour
Crossover Markups
Re-Entry Markups
RedK_Larry William's TrendI'm not the author of this indicator or the concept behind it
i found this code - written for another platform - while researching "Larry William's Trend" - while i also couldn't find that specific keyword in the TV public library. So thought to bring this in.
Also unfortunately there was no coder details to give credit to with the code i found. it seems this may somehow be related to the famous SuperTrend - but i have no idea how they are connected. i simply ported this to Pine in my own way.
will be happy if this is useful to some traders who use these types of trend indicators. if you do find it useful, pls leave a comment here - or feel free to take this code and modify it in any further way for your specific need.
we continue to learn and explore new tools everyday. good luck!
