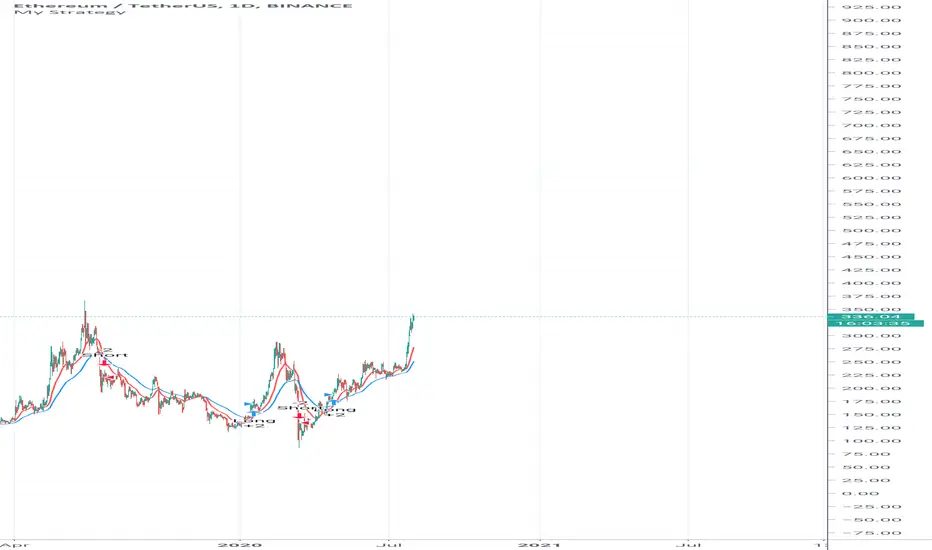
Ema-Weighted-GainStrategy Inputs: Capital=$10,000, Pyramiding=3, Default Quantity=1
Please note that the strategy buys when the WMA (Blue line) cross under zero and sell above it, your experience is very important in using this indicator. Do not follow the buy/sell signals. Read the plot as I explain in the Uses Section and make your own conclusion on how to use it.
Description,
This Strategy uses multiple Ema’s to calculate Weighted HPR's.
I have calculated the weight numbers based on Fibonacci.
Uses:
NOTE!! (Please Do not take those uses to be 100% Guaranteed. User your experience and judgment to decide your trade).
Zoom out to see all the arrows
White line (MA)
Blue line (WMA)
First
Ride Trends,
1-Downtrend: short
a-MA IS going down
b-Entry: WMA cross above or near the MA (White Arrows).
2-Uptrend:long
a-MA is going up
b-Entry: WMA goes below MA or Near it(Green Arrows).
Second
Trend Reversal
1-buy entry.
WMA at zero, or very close to it, in pullback (Yellow Arrows).
2-short entry
WMA at zero, or very close to it, in a bounce (Orange Arrows).
Third
Divergence as explained in the Red Arrows.
Conclusion,
Red Arrows= Divergence
Green Arrows= Buy entry (The stock is in uptrend)
Yellow Arrows= Buy entry (the stock is in downtrend and could reverse)
White arrows= short entry (the stock is in downtrend)
Orange arrows=short entry (the stock in uptrend and can reverse)
If you are interested, send a private message
Cerca negli script per "trend"

T3-CCI Strategy [SystemAlpha]This is a strategy based on FX Sniper's T3-CCI indicator. Instead of using just the normal buy and sell signal, we added an option to use trend filters, trailing stop loss and take profit targets.
In this strategy you have a choice of:
Trend Filters:
- Average Directional Index ( ADX ) – buy when price is trend is up and sell when trend is down.
- Moving Average (MA) – buy when price close above the defined moving average and sell when price close below moving average
- Parabolic SAR – buy when SAR is above price is above price and sell when SAR is below price.
- All - Use ADX , MA and SAR as filters
For MA Filter , you can use the “TF MA Type” and "TF MA Period" parameter to select Simple or Exponential Moving Average and length.
Stop Loss:
- Average True Range (ATR) – ATR % stop as trailing stop loss.
- Parabolic SAR ( SAR ) – Parabolic SAR adapted as trailing stop loss.
For ATR , you can use the “ATR Trailing Stop Multiplier” parameter to set an initial offset for trailing stop loss.
Take Profit Target:
- Average True Range (ATR) – ATR % stop as trailing stop loss.
- Standard % – Percent as target profit
For ATR , you can use the “ATR Take Profit Multiplier” parameter to set an initial offset for trailing stop loss.
Additional feature include:
- Show Bar Colors
STRATEGY ONLY:
- Set back test date range
- Set trade direction - Long, Short or Both
- Use timed exit - Select method and bars
- Method 1: Exit after specified number of bars.
- Method 2: Exit after specified number of bars, ONLY if position is currently profitable.
- Method 3: Exit after specified number of bars, ONLY if position is currently losing.
TradingView Links:
Alerts:
T3-CCI Indicator:
Advance ADX:
How to use:
1. Apply the script by browsing through Indicators --> Invite-Only scripts and select the indicator
2. Once loaded, click the gear (settings) button to select/adjust the parameters based on your preference.
3. Wait for the next BUY or SELL signal to enter the trade!
Disclaimer:
The indicator and signals generated do not constitute investment advice; are provided solely for informational purposes and therefore is not an offer to buy or sell a security; are not warranted to be correct, complete or accurate; and are subject to change without notice.

Combo Backtest 123 Reversal & Finite Volume Elements (FVE) This is combo strategies for get a cumulative signal.
First strategy
This System was created from the Book "How I Tripled My Money In The
Futures Market" by Ulf Jensen, Page 183. This is reverse type of strategies.
The strategy buys at market, if close price is higher than the previous close
during 2 days and the meaning of 9-days Stochastic Slow Oscillator is lower than 50.
The strategy sells at market, if close price is lower than the previous close price
during 2 days and the meaning of 9-days Stochastic Fast Oscillator is higher than 50.
Second strategy
The FVE is a pure volume indicator. Unlike most of the other indicators
(except OBV), price change doesn?t come into the equation for the FVE (price
is not multiplied by volume), but is only used to determine whether money is
flowing in or out of the stock. This is contrary to the current trend in the
design of modern money flow indicators. The author decided against a price-volume
indicator for the following reasons:
- A pure volume indicator has more power to contradict.
- The number of buyers or sellers (which is assessed by volume) will be the same,
regardless of the price fluctuation.
- Price-volume indicators tend to spike excessively at breakouts or breakdowns.
WARNING:
- For purpose educate only
- This script to change bars colors.

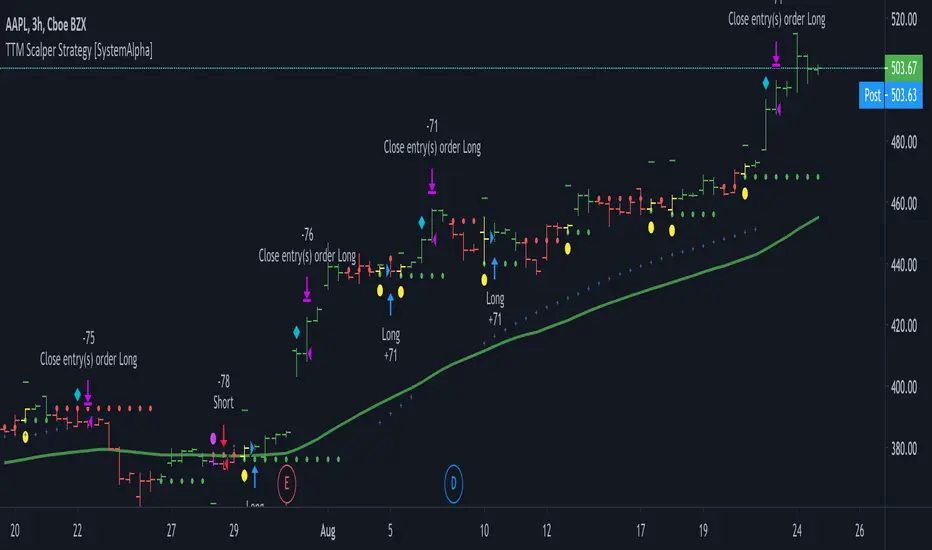
TTM Scalper Strategy [SystemAlpha]This is a strategy based on TTM scalper indicator. Instead of using just the normal buy and sell signal, we added an option to use trend filters, trailing stop loss and take profit targets.
The TTM scalper indicator of John Carter’s Scalper Buys and Sells was originally created by HPotter and is as a close approximation of the one described in his book Mastering the Trade.
In this study you have a choice of:
Trend Filters:
- Average Directional Index ( ADX ) – buy when price is trend is up and sell when trend is down.
- Moving Average (MA) – buy when price close above the defined moving average and sell when price close below moving average
- Parabolic SAR – buy when SAR is above price is above price and sell when SAR is below price.
- All - Use ADX , MA and SAR as filters
For MA Filter , you can use the “TF MA Type” and "TF MA Period" parameter to select Simple or Exponential Moving Average and length.
Stop Loss:
- Average True Range (ATR) – ATR % stop as trailing stop loss.
- Parabolic SAR ( SAR ) – Parabolic SAR adapted as trailing stop loss.
For ATR , you can use the “ATR Trailing Stop Multiplier” parameter to set an initial offset for trailing stop loss.
Take Profit Target:
- Average True Range (ATR) – ATR % stop as trailing stop loss.
- Standard % – Percent as target profit
For ATR , you can use the “ATR Take Profit Multiplier” parameter to set an initial offset for trailing stop loss.
Additional feature include:
- Show Bar Colors
STRATEGY ONLY:
- Set back test date range
- Set trade direction - Long, Short or Both
- Use timed exit - Select method and bars
- Method 1: Exit after specified number of bars.
- Method 2: Exit after specified number of bars, ONLY if position is currently profitable.
- Method 3: Exit after specified number of bars, ONLY if position is currently losing.
TradingView Links:
Alerts:
How to use:
1. Apply the script by browsing through Indicators --> Invite-Only scripts and select the indicator
2. Once loaded, click the gear (settings) button to select/adjust the parameters based on your preference.
3. Wait for the next BUY or SELL signal to enter the trade!
Disclaimer:
The indicator and signals generated do not constitute investment advice; are provided solely for informational purposes and therefore is not an offer to buy or sell a security; are not warranted to be correct, complete or accurate; and are subject to change without notice.
M4x Rainbow V4i strat LINK-USDTGRID & TREND Multiplier Experiment
// "M4x Rainbow" is a Strategy Grid Trend Multiplier bot, who is following the trend.
// I built it as an experimental tool with Strategy implemented, even if that numbers are far out...!
// Because.....it not only depends on the bot setup, the timings of the TradingBot (eg.3Commas) are very relevant too!
// Like amount of Trades, Security Orders, Deviation and so on...
// Please feedback your experience with a Comment , as I would like to improve this bot.
// Updates will follow ;-)
//
// "M4x Rainbow" is not bound on FIFO, each trade get's his own exit.
// It is set for Pyramiding, which can be changed in the "Strategy" line
// Fees are set equal to Binance numbers at 0.1%, about...
// The coloring of the lines is:
//
// green = linestate is LONG
// blue = linestate is WAIT
// yellow = linestate is SHORT
//
// Give it a try and let me know.
//
// ...have fun ;-)

ATFMWHAT TYPE OF MARKET TO USE?
ATFM indicator focus mainly on very short term trades specifically for 5min expiry. You can use this indicator in any type of market as long as theres 5 min expiry option available.
HOW IT WORKS?
ATFM indicator uses a combination of moving averages and trend analysis to trigger a BUY (blue arrow pointing up) or a SELL (red arrow pointing down) signal. When certain condition is met, it will immediately pop up an alert signal for you to take. It will trigger with all types of market condition. There is no repaint since it is based of the previous closed candle.
HOW TO USE?
When the signal triggers a “BUY” or “SELL” you want to wait for that candle to close and then you enter the next candle as your entry. If you’re trading binary options, you want to take the ATM (At the Money) contracts but make sure you enter the 5 min expiry. This indicator works best when you scalp. You can hold till expiry as well. You can turn on push notification on your phone so you won’t have to miss any signals.
This indicator is a month to month subscription. No Free trial. PM me to access the ATFM.

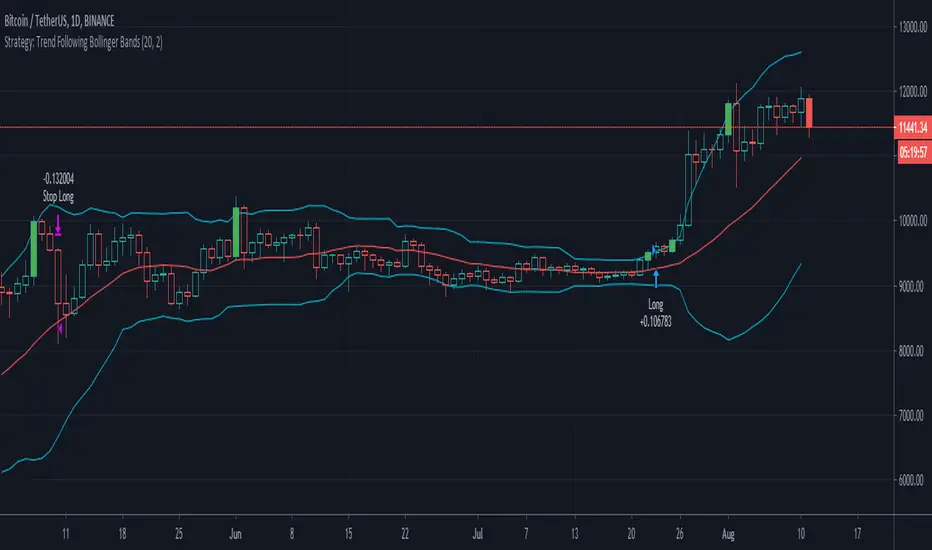
Setup Trend Following Bollinger Bands - ValenteBuy when the candle closes above upper BB
Sell when the candle closes bellow lower BB
Stop always on base line
Donchian Channel Strategy [for free bot]
I present to you a script for testing the Donchian channel breakout strategy for the Binance_exchange.
This strategy is trending, and is especially effective for trading cryptocurrency futures.
This strategy is very flexible, and you can configure virtually all possible parameters, moreover, separately for longs and separately for shorts.
In the script, you can configure the parameters of the channel for entry and exit, the exit method, enable or disable purchases / sales, specify take profit and stop loss, and more.
On the example of optimization, only 20% of the deposit is used. This is done for diversification, since there are 37 contracts on binance_futures (at the time of writing the script description). That is, by optimizing the parameters for different currencies, you can very well reduce risks.
Представляю Вам скрипт для тестирования стратегии пробоя канала Дончиана для биржи Бинанс.
Данная стратегия относится к трендовым, и особенно эффективная на торговли криптовалютных фьючерсов.
Данная стратегия очень гибкая, и можно настроить фактически все возможные параметры, при чем, отдельно для покупок и отдельно для продаж.
В скрипте можно настроить параметры канала на вход и на выход, метод выхода, разрешить или запретить покупки/проаджи, указать тейк-профит и стоп-лосс и другое.
На примере оптимизации используется всего 20% от депозита. Это сделано для диверсификации, так как на фьючерсах бинансе присутсвует 37 контрактов (на момент написания описания скрипта). Т.е., оптимизировав параметры под разные валюты, можно очень хорошо снизить риски.

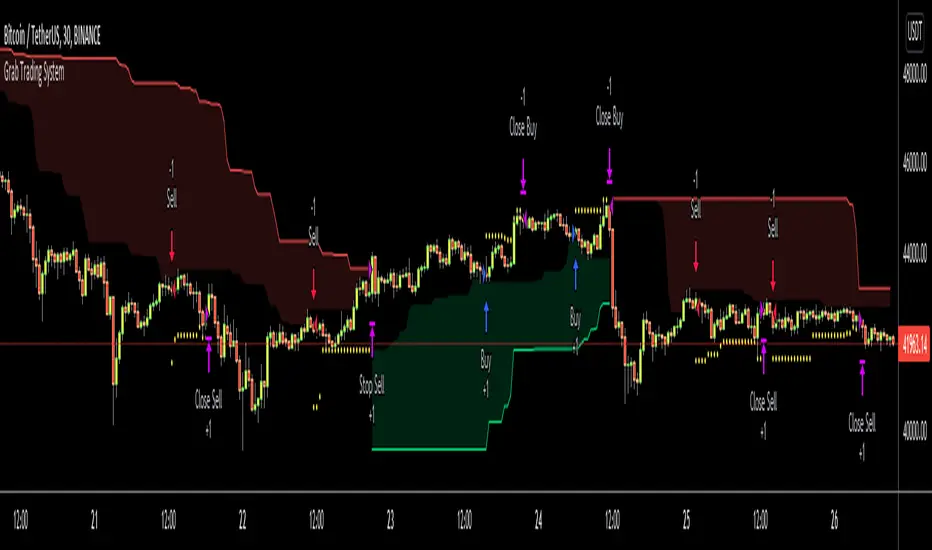
Grab Trading SystemHello All,
This is "Grab Trading System" script defined in the book "Trend Following" by Michael W. Covel. also named as "Two-box system". I made small changes and I guess that it can be improved more.
The definition: Far box defines major trend; system trades only in same direction as major trend, meanwhile fading the signals of near box. Last trade in each trend exits at break of far box - at the same time as the trend reverses. All trades, except the last in the trend, use a limit order, as they are fading the near box. The last trade exits on a stop, as the trend changes.
As you can see there is Longterm Period and Shortterm Period in the indicator options. Longterm period is used for major trend and shortterm period is used to take position according to major trend. in my test I got better performance in small time frames. you need to set longterm/shortterm periods by your trading strategies.
Enjoy!
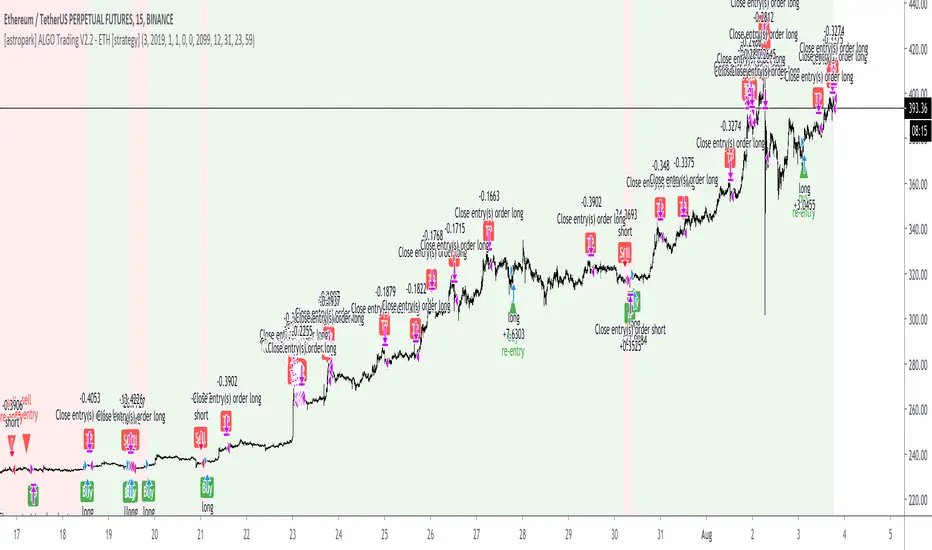
[astropark] ALGO Trading V2.2 - ETH [strategy]Dear Followers,
today another awesome Swing and Scalping Trading Strategy indicator : the upgraded version of ALGO Trading V2 for Binance Ethereum PERP on 15m timeframe!
It is runnable on a bot , just write me in order to help you do it.
If you are a scalper or you are a swing trader, you will love suggested entries for fast and long-lasting profit.
Keep in mind that a proper trailing stop strategy and risk management and money management strategies are very important (DM me if you need any clarification on these points).
This is an upgrade version of ALGO Trading V2 for Ethereum.
You can find ALGO Trading V2 indicator here below:
If you are interested in Bitcoin Trading , you will like for sure ALGO Trading V1.2, which is a customized version for Bitcoin trading:
This strategy has the following options:
enable/disable signals on chart
enable/disable bars and background coloring based on trend
enable/disable a Filter Noise option, which reduces overtrading
enable/disable a Trailing Stop option
enable/disable/config a Take Profit option, with Re-Entry
enable/disable a secret Smart Close Option which may improve profit on your chart (again, check it on you chart if it helps or not)
This strategy only trigger 1 buy (where to start a long trade) or 1 sell (for short trade). If you enable Take Profit / Stop Loss option, consider that many TP can be triggered before trend reversal, so take partial profit on every TP an eventually buy/sell back lower/higher on RE-ENTRY signal to maximize your profit.
Strategy results are calculated on the time window from December 2019 to now, so on more than 7 months, using 1000$ as initial capital and working at 1x leverage (so no leverage at all! If you like to use leverage, be sure to use a safe option, like 3x or 5x at most in order to have liquidation price very far).
This is not the "Holy Grail", so use proper money and risk management strategies.
In order to get notified when a signal is triggered, you need to use the "alarms" version of this indicator (just search for astropark's "ALGO Trading V2.2 - ETH" indicator and choose the one with "alarms" suffix).
This is a premium indicator , so send me a private message in order to get access to this script.
CROSSOVER LONG N SHORTThis is a algo bot which identifies the trend with the help of ema and give buy signals..
It is backtested personaly by me and has shown good results
This script is intended to educational purpose only ...
SIDD-Master-Moving-AverageSIDD-Master-Moving-Average is based on RSI average calculation Moving average plotted on chart.
This Moving Average is giving 2 signals Bullish and Bearish .
Whenever Bullish signals is coming price is doing crossover with moving average on upside and this indicate price will go up from current market price.
Whenever Bearish signals is coming price is doing cross-under with moving average on downside and this indicate price will go down from current market price.
Moving average color is changing based on upside movement or downside movement , for upside its green and for downside its orange color.
This indicator i have created with stop loss line means any price close below cross line for bullish position then that trade should be closed and take the stop loss. similarly for Bearish trade and candle close above stop loss line means trade should be closed and take the stop loss.
Stop loss i have taken care with ATR and Super trend you can see the settings.
I have defined setting for general use of indicator if any modification on setting then result may vary.
Its multi time frame moving average. And I have given time frame for indicator as well so if any trending move need to capture then that setting need to be increased with respect to chart time frame else keep it same.
I have added commission and slippages as well in indicator.
Ping me or DM me to subscribe this indicator.
I have given all my indicator details below link (Signature URL). You can check indicators and call me on given number or email me on given email to access the scripts and indicators. Telegram link is also given you can ping me there.
--------------------------------------------------------------------------------------------------------------------------------------
Disclaimer : Past performance of the indicator is not giving guarantee for future performance as well, it may change as per market condition.
-------------------------------------------------------------------------------------------------------------------------------------

Combo Backtest 123 Reversal & Ergodic MDI This is combo strategies for get a cumulative signal.
First strategy
This System was created from the Book "How I Tripled My Money In The
Futures Market" by Ulf Jensen, Page 183. This is reverse type of strategies.
The strategy buys at market, if close price is higher than the previous close
during 2 days and the meaning of 9-days Stochastic Slow Oscillator is lower than 50.
The strategy sells at market, if close price is lower than the previous close price
during 2 days and the meaning of 9-days Stochastic Fast Oscillator is higher than 50.
Second strategy
This is one of the techniques described by William Blau in his book "Momentum,
Direction and Divergence" (1995). If you like to learn more, we advise you to
read this book. His book focuses on three key aspects of trading: momentum,
direction and divergence. Blau, who was an electrical engineer before becoming
a trader, thoroughly examines the relationship between price and momentum in
step-by-step examples. From this grounding, he then looks at the deficiencies
in other oscillators and introduces some innovative techniques, including a
fresh twist on Stochastics. On directional issues, he analyzes the intricacies
of ADX and offers a unique approach to help define trending and non-trending periods.
WARNING:
- For purpose educate only
- This script to change bars colors.
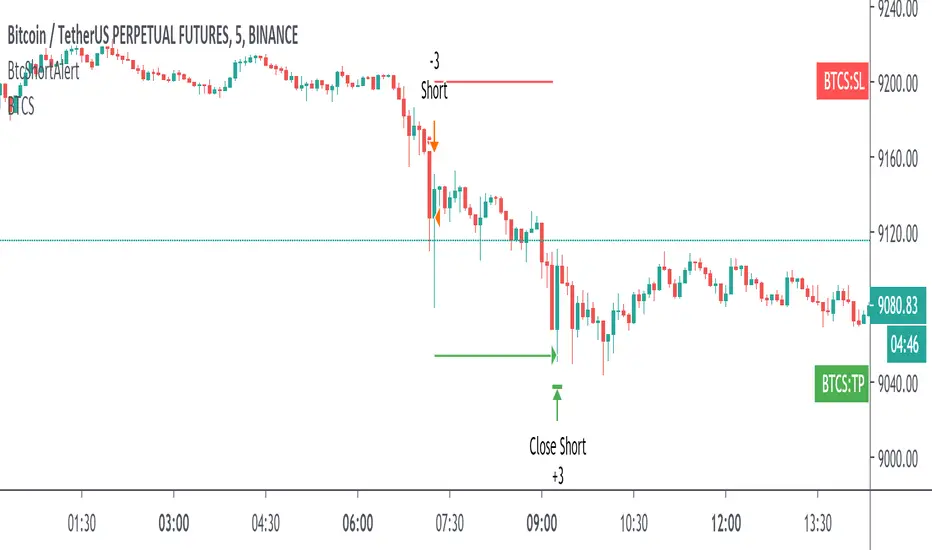
Btc Short StrategyBINANCE:BTCUSDTPERP
Developed for the btc perpetual future contract on Binance Futures .
How to Use:
It's based on a complex strategy for short positions that involves volume analysis, trend analysis, moving averages, supports and resistances and more.
Concretely this indicator opens a short position when there is a bearish trend and a breakout of a support zone and uses fear and volatility to take an edge on the market.
It runs on the 5 min chart for the entry , and it analyses higher timeframes.
It opens and close sell positions and automatically draws SL and TP. The R/R is 1:1.
It's possible to enable alerts of the strategy in order to be notified whenever the indicator opens or closes a position . You can use it in addiction of your strategy or for educational purposes .
(This indicator will be updated when/if there will be a change in the bias of the market)
Access must be given by me to test this. Once access given you can test.
PM me or use the links below to obtain access to this indicator.
Backtesting Results:
Initial Capital= 10000
Order Size= 3 contracts (max loss 2.15% of the capital)
Commission= 0.075% (same of VIP0 of binance)
Slippage=10 ticks
Reviews and Feedback are welcome.
Refer the Release notes for any updates and my posts below and in my idea page for more details.
Report any issues or ideas to me, I'll fix them !
Thank you !
DISCLAIMER:
All trading involves high risk: past performance is not necessarily indicative of future results. Hypothetical or simulated performance results have certain inherent limitations. Unlike an actual performance record, simulated results do not represent actual trading. Also, since the trades have not actually been executed, the results may have under- or over-compensated for the impact , if any, of certain market factors, such as lack of liquidity. Simulated trading programs in general are also subject to the fact that they are designed with the benefit of hindsight. No representation is being made that any account will or is likely to achieve profits or losses similar to those shown.
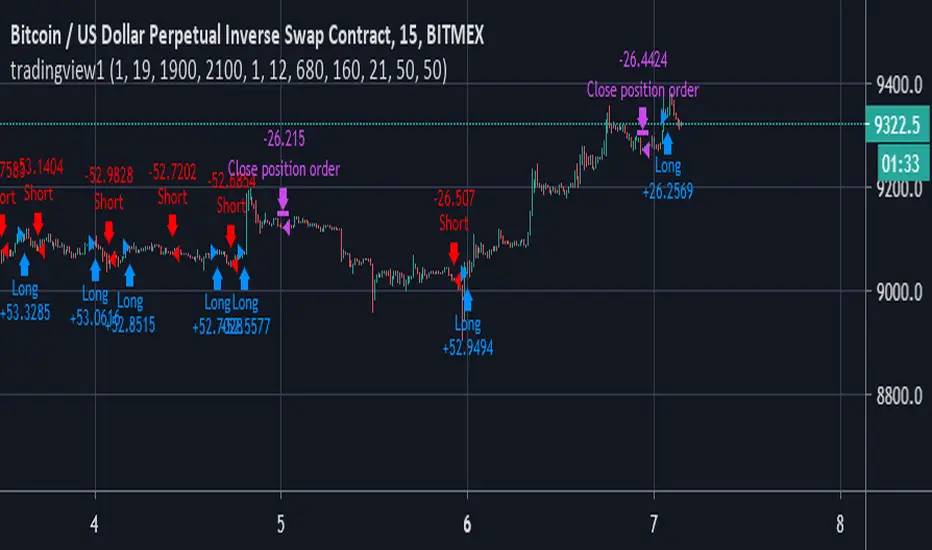
mark strategy1 band+rsi filter for xbtusdHi first of all thanks for read this.
This is my first strategy for make trading, I optimized it for xbtusd and 15 min or 30 min charts.
You can personalize some setting for reach a better result then me, these are the setting:
1) trend bars
U can change this value for trade after a prefix number of candle who confirm signals
2) time frame
U can change this value for use a different number of candle for take signals
3) date setting:
U can change this value for test strategy in a specific period
4) rsi period
U can change this value for use a differt rsi timeframe for rsi filter
5) rsi up
U can change this value for enter a trade after rsi is > of value
6) rsi low
U can change this value for enter a trade after rsi is < of value
7) take profit
U can change this value for exit trade after a prefix $ price change
8) stop loss
U can change this value for stop trade after a prefix $ price change
9) trailing stop
U can change this value for use trailing stop option, u can follow the price with this setting
10) trailing stop offset
U can change this value for a retard of trailing stop option this can help to understand the real earning with stop loss because sometimes broker's stop loss is not perfect
Have nice day and send me a message if u will earn with my strategy.
If u want my code send me a message
Anchored VWAP Large Swings Strategy [1H]Customized anchored VWAPs with 50,100,200,500 periods lookbacks. Weekly opens are used as a confluence regarding the trend.
Best use on 1H timeframe. Feel free to ask questions.

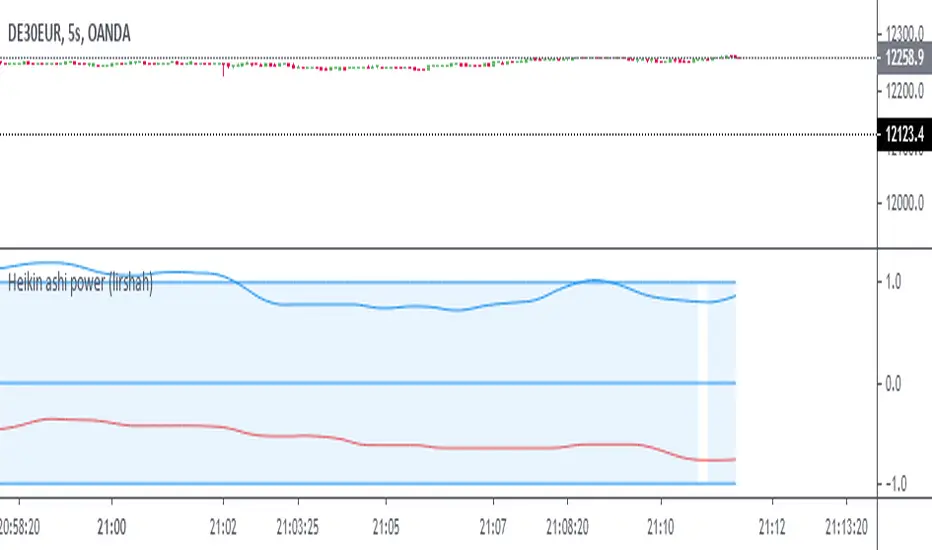
Heikin ashi power (lirshah)Heikin Ashi power strategy has been written based on the heikin ashi candles movement.
the strategy is composed from two different line, bullish candle line and bearish candle line.
the bullish line is a representative of bull power which is directly related to number of positive candles and also power of candles.
so the more positive candles and the more upward trends causes the powerful bullish line and conducted to an extreme level.
the strategy trigger buy signals when bullish line passes the extreme and similar scenario for selling signals.
this strategy has very good results on 5 Sec , 5 min and 15 min time frames.
also it can be applied to variety of markets, crypto, indices , cfd and futures.
the standard parameters are as below:
period:200
internal smooth: 5
external smooth: 10
extreme level: 1
take profit
stop-loss
below overview is results of XBTUSD on 5 min chart, with 1 contract trade and 0.075% commission per trade.
in order to access scripts contact me directly.
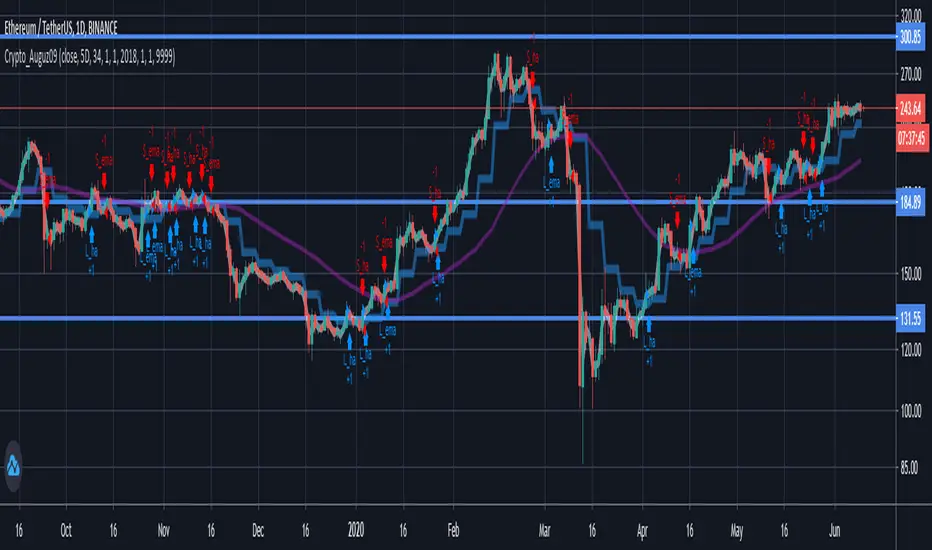
Tan_Aug09Crypto pairs: ETH/USDT
Time-frame: D1
Based on Heikin Ashi Candle and Exponential Moving Average Indicators
Crypto pick: 5D
Stock pick: 8D
Best work in strong trend.
Recommend using with trend line .
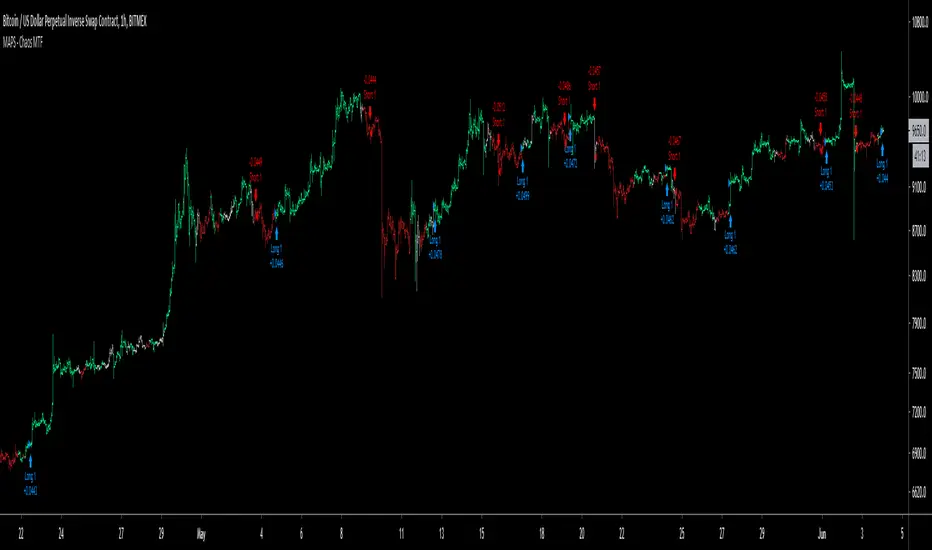
MAPS - Chaos MTFSearches for a probable trend and sets a position. Ideally, we'd set a stop loss at an opposite fractal two positions away from the entry.
Use the link below to obtain access to this indicator
Trend Reversal / Potential pressureThis strategy looks for potential trend reversals by looking at hammer candles (defined in the is_hammer and is_stick functions). After getting confirmation a trade is open with determined SL/TP. ATR is used to justify the volatility. Fine-tune the parameters for your specific use case.
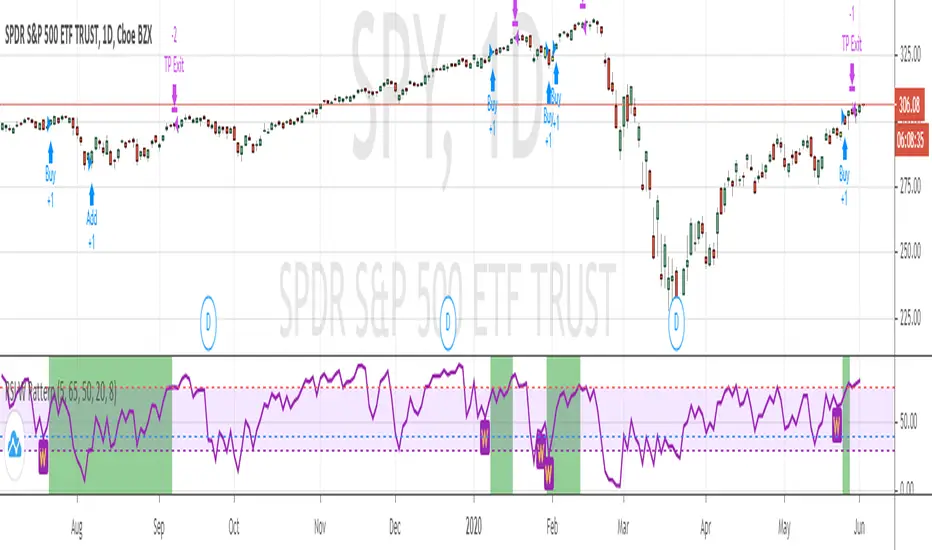
RSI W Pattern strategyThis strategy is similar to RSI V pattern strategy, but it looks for W pattern in RSI chart.
RULES
======
BUY
1. ema20 is above ema50
2. RSI5 crossing up 30 from oversold area
3. and RSI5 must be below overbought area (default value set to 65)
Add to existing Position
1. You can add on the next W pattern OR
2. if RSI5 is crossing up from below 20
Exit
1. when RSI5 reaches 75
Note: This is for short term/swing trading . which gets on when price dip in trending and quickly gets you out on RSI overbought area
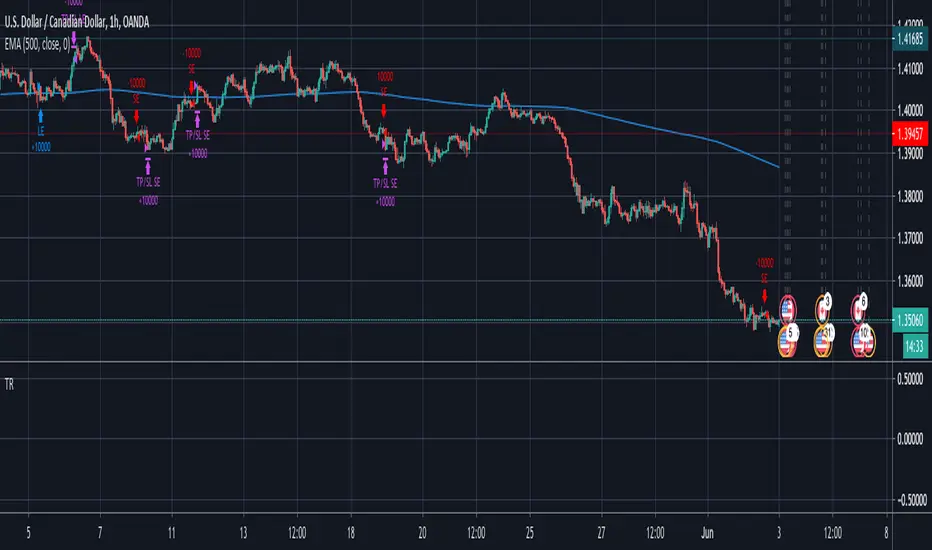
Intraday Strategy - NIFTY INTRADAY STRATEGY - NIFTY (Index)
INSTRUMENT TO TRADE - Nifty Futures, Nifty Options (Buy) - In The Money Call / Put Options
TIME FRAME - 05 mins
DURATION TYPE - Intraday , every trade must be closed at End Of Trading Day.
STRATEGY TYPE - Trend following, Intraday
The script will indicate when to BUY / SHORT the Index instruments and when to EXIT the trade.
The backtesting is done using 1 qty of NIFTY on intraday trade.
Brokerage and commissions are included in backtest results.
Tradingview doesn't have Nifty futures data hence strategy is build on Nifty spot price.
The purpose of the scipt is for self learning / improvement and analysis.
Trading is a risky business and a trader must take any trade at their own RISK.
The author shall not be held responsible for Losses / Profits

PS3X Strategy TesterPS3X Strategy Tester is a completely new strategy built from the ground up as a successor to previous 1.0 and 2.0 versions of Profit Sniper.
Offering up huge improvements, including multiple position triggers, derived from Bollinger Bands and Chande Momentum as well as our own bespoke stochastic ribbons that provide trend pivots.
So how does it work?
PS3X Strategy Tester allows you to tailor your preference for waiting for either Stochastic Ribbon cross only, Ribbon Cross followed by Chande Confirmation, or Ribbon Cross followed by rising/falling MACD for additional market structure confidence.
Strategy exits can be configured to exit on % change of MACD histogram indicating a direction change, and additionally using our revolutionary "Profit Lockin" to provide a stepped lock in of profits according to your preferred risk strategy. Commision of 0.05% has been added to represent "limit in-market out" trading, but please tailor this again to your preferred trading approach.
If you would like access, please send me a PM.
