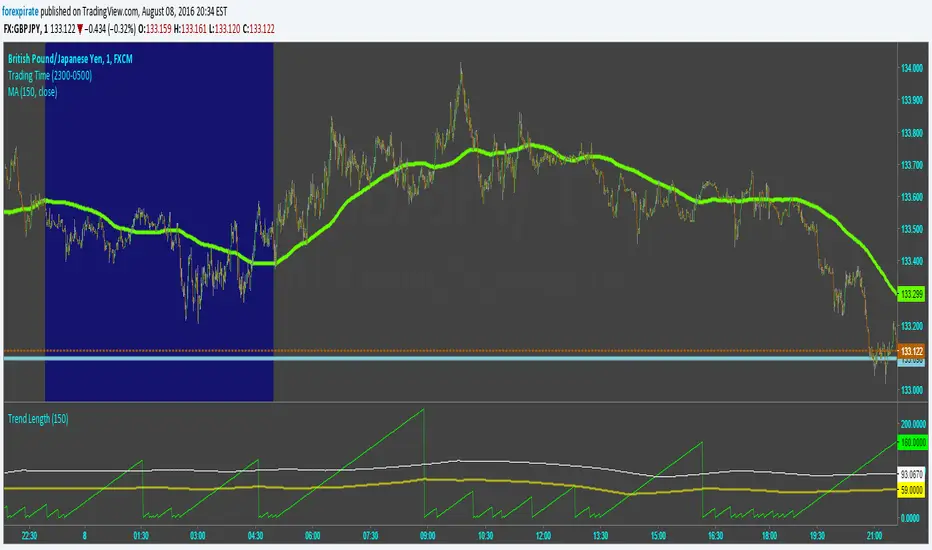
Trend LengthScript tries to capture the length of trends. It calculates an SMA and then determines the slope of the SMA using a simple momentum function. From there it counts bars from when the slope changed directions last. The lime green line is the count from when the slope changed. The yellow line is the average time of a trend. The white line is "trying" to capture the length of a full healthy pip running trend. Pick and SMA you like and then run through many currencies. I find that trends tend to be the same length. Not surprising as the markets are extremely correlated to each other. The trick is to find the most active pair for action. To do that look up my Pairs Range script.
Comments are welcome.
Cerca negli script per "trend"
Trend Continuation [OmegaTools]Trend Continuation is a trend-following and trend-continuation tool designed to highlight high-probability pullbacks within an existing directional bias. It helps discretionary and systematic traders visually isolate “continuation zones” where a retracement is more likely to resolve in favor of the prevailing trend rather than trigger a full reversal.
1. Concept and Objective
The indicator combines two key components:
1. A trend bias engine (based either on a Rolling VWAP regime or on swing market structure).
2. A pullback pressure model, which quantifies how deep and “aggressive” the recent retracement has been relative to the trend.
The goal is to identify moments where the market pulls back against the trend, builds enough “reversal pressure,” and then shows signs that the trend is likely to **continue** rather than flip. When specific conditions are met, the indicator highlights bars and plots reference levels that can be used as potential continuation zones, filters, or confluence areas in a broader trading plan.
2. Trend Bias Modes
The primary trend direction is defined through the `Trend Mode` input:
* **RVWAP Mode (default)**
The script computes two rolling volume-weighted average prices over different lengths:
* A **shorter-term rolling VWAP**
* A **longer-term rolling VWAP**
When the shorter RVWAP is above the longer one, the bias is set to **bullish (+1)**. When it is below, the bias is **bearish (-1)**.
This creates a smooth, volume-weighted trend definition that tends to adapt to shifting regimes and filters out minor noise.
* **Market Structure Mode**
In this mode, trend bias is derived from **pivot highs and lows**:
* When price breaks above a recent pivot high, the bias flips to **bullish (+1)**.
* When price breaks below a recent pivot low, the bias flips to **bearish (-1)**.
This approach is more structurally oriented and reacts to significant swing breaks rather than just moving-average style relationships.
If no clear condition is met, the internal bias can temporarily be neutral, though the main design assumes working with clearly bullish or bearish environments.
3. Pullback and Reversal Pressure Logic
Once the trend bias is defined, the indicator measures **pullback intensity** against that trend:
* A **lookback window (“Pullback Length”)** scans recent highs and lows:
* In an uptrend, it tracks the **highest high** over the window and measures how far the current low pulls back from that high.
* In a downtrend, it tracks the **lowest low** and measures how far the current high bounces up from that low.
* This distance is converted into a **“reversal pressure” value**:
* In a bullish bias, deeper pullbacks (lower lows relative to the recent high) indicate stronger counter-trend pressure.
* In a bearish bias, stronger rallies (higher highs relative to the recent low) indicate stronger counter-trend pressure.
The raw reversal pressure is then smoothed with a long-term moving average to separate normal retracements from **statistically significant extremes**.
4. Thresholds and Histogram Coloring
To avoid reacting to every minor pullback, the indicator builds a **dynamic threshold** using a combination of:
* Long-term averages of reversal pressure.
* Standard deviation of reversal pressure.
* High-percentile values of reversal behavior over different sample sizes.
From this, a **threshold line** is derived, and the script then compares the current reversal pressure to this adaptive level:
* The **Reversal Histogram** (column plot) represents the excess reversal pressure above its own long-term average.
* When:
* There is a valid bullish or bearish bias, and
* The histogram is above the dynamic threshold,
the bars of the histogram are **colored**:
* Blue (or a similar “positive” color) in bullish bias.
* Red/pink (or a similar “negative” color) in bearish bias.
* When reversal pressure is below threshold or bias is not relevant, the histogram remains **neutral gray**.
These colored histogram segments represent **“high-tension” pullback states**, where counter-trend pressure has reached an extreme that, historically, often resolves with the original trend continuing rather than fully reversing.
5. Continuation Level and Bar Coloring on Price Chart
To connect the oscillator logic back to the chart:
* A **continuation reference level** is computed on the price series:
* In an uptrend, this is derived by subtracting the threshold from recent highs.
* In a downtrend, it is derived by adding the threshold to recent lows.
* This level is plotted as a **line on the price chart** (only when the trend bias is stable), acting as a visual guide for:
* Potential continuation zones,
* Possible stop-placement or invalidation areas,
* Or filters for entries/exits.
The bars are then **colored** when price crosses or interacts with these levels in the direction of the trend:
* In a bullish bias, bars closing below the continuation level can be highlighted as potential **deep pullback/continuation opportunities** or as warning signals, depending on the user’s playbook.
* In a bearish bias, bars closing above the continuation level are similarly highlighted.
This makes it easy to see where the oscillator’s “extreme pullback” conditions align with structural movements on the actual price bars.
6. Embedded Win-Rate Estimation (WR Table)
The script also includes an internal **win-rate style metric (WR%)** displayed in a small table on the chart:
* It tracks occurrences where:
* A valid bullish or bearish bias is present, and
* The Reversal Histogram is **above the threshold** (i.e., histogram is colored).
* It then approximates the **probability that the trend bias does not change** following such high-pressure pullback events.
* The WR value is shown as a percentage and represents, in essence, the **historical trend-continuation rate** under these specific conditions over the most recent sample of events.
This is not a formal statistical test and does not guarantee future performance, but it provides a quick visual indication of how often these continuation setups have led to **trend persistence** in the recent past.
7. How to Use in Practice
Typical applications include:
Trend-following entries on pullbacks
Identify the main trend using either RVWAP or Market Structure mode.
Wait for a colored histogram bar (reversal pressure above threshold).
Use the continuation reference line and bar coloring on the price chart to refine entry zones or invalidation levels.
Filtering signals from other systems
Run the indicator in the background to confirm trend continuation conditions before taking signals from another strategy (e.g., breakouts or momentum entries).
Only act on long signals when the bias is bullish and a high-pressure pullback has recently occurred; similarly for short signals in bearish conditions.
Risk management and trend monitoring
Monitor when reversal pressure is building against your current position.
Use shifts in bias combined with high reversal pressure to re-evaluate or scale out of trend-following trades.
Recommended steps:
1. Choose your Trend Mode:
- RVWAP for smoother, regime-style trend detection.
- Market Structure for swing-based structural changes.
2. Adjust Trend Length and Pullback Length to match your timeframe (shorter for intraday, longer for swing/position trading).
3. Observe where histogram colors appear and how price reacts around the continuation line and highlighted bars.
4. Integrate these signals into a pre-defined trading plan with clear entry, exit, and risk rules.
8. Limitations and Disclaimer
* This tool is a **technical analysis aid**, not a complete trading system.
* Past behavior of trend continuation or reversal pressure does **not** guarantee future results.
* The embedded WR metric is a **descriptive statistic** based on recent historical conditions only; it is not a promise of performance or a robust statistical forecast.
* All parameters (lengths, thresholds, modes) are user-configurable and should be **tested and validated** on your own data, instruments, and timeframes before any live use.
Disclaimer
This indicator is provided for informational and educational purposes only and does not constitute financial, investment, or trading advice. Trading and investing in financial markets involve substantial risk, including the possible loss of all capital. You are solely responsible for your own trading decisions and for evaluating all information provided by this tool. OmegaTools and the author of this script expressly disclaim any liability for any direct or indirect loss resulting from the use of this indicator. Always consult with a qualified financial professional before making any investment decisions.

TrendMaster V2TrendMaster V2 is a comprehensive Pine Script indicator designed for TradingView. It combines multiple technical indicators and an advanced scoring logic to provide actionable trading signals. The script is highly customizable, allowing users to adjust trading modes, color themes, and signal filters according to their preferences and risk tolerance.
Key Features
Composite Scoring System:
The script calculates a composite score based on trend, momentum, pattern recognition, volume, volatility, divergence, Pearson correlation, and the CCI index. This score helps identify the best buy or sell opportunities.
Customizable Parameters:
Users can choose between “Aggressive,” “Balanced,” or “Conservative” trading modes, adjust indicator periods, and customize the color scheme of all visual elements.
Confluence Analysis:
The script evaluates the number of matching bullish or bearish signals, providing a confluence summary for higher-confidence trades.
Visual Signals:
Clear visual cues (triangles, circles, crosses) are displayed on the chart for strong buy/sell signals, confluences, and divergences.
Information Panels:
Two panels display real-time data such as score, RSI, volume, volatility, Pearson, CCI, trend, signal, and mode, along with the confluence status for quick reference.
Alert Conditions:
The script supports alerts for strong buy/sell signals, confluences, and divergences.
How It Works
Main Configuration:
Users select a trading mode (Aggressive, Balanced, or Conservative) and a color theme (Dark or Light).
Custom colors can also be set for bullish, bearish, strong, neutral, and signal elements.
Technical Indicators
Moving Averages (SMA/EMA) for trend analysis.
RSI to assess momentum and overbought/oversold conditions.
MACD for trend confirmation.
Volume and Volatility (ATR) for market activity evaluation.
Advanced Indicators
Pearson Correlation to measure trend strength.
CCI for cyclic momentum analysis.
Pattern Recognition
The script identifies common bullish and bearish reversal patterns (e.g., engulfing, hammer, morning/evening star) and continuation patterns (e.g., three white soldiers/black crows).
Composite Score
Each indicator contributes to a composite score, weighted according to the selected trading mode.
The score determines the strength of buy/sell signals.
Confluence Analysis
The script counts the number of matching bullish or bearish signals, providing a confluence summary for higher-confidence trades.
Visual Signals and Alerts
Strong buy/sell signals: triangles
Confluence signals: circles
Divergences: crosses
Alerts are triggered for strong buy/sell signals, confluences, and divergences.
Usage Instructions
Add the script to your TradingView chart.
Adjust the settings in the configuration panel to match your trading style.
Monitor the information panels and visual signals to spot trading opportunities.
Set up alerts for your preferred signal types.

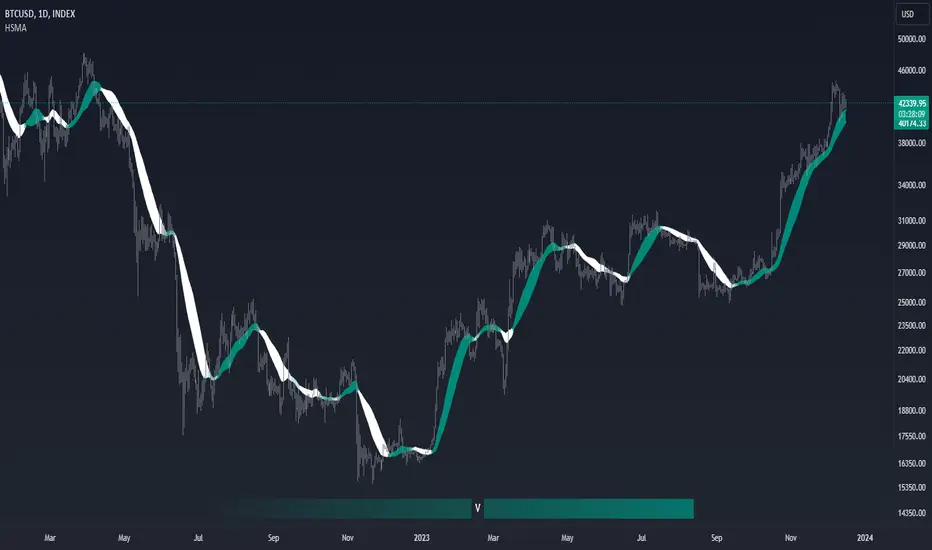
Trend Duration Forecast [ChartPrime]⯁ OVERVIEW
The Trend Duration Forecast indicator is designed to estimate the probable lifespan of a bullish or bearish trend. Using a Hull Moving Average (HMA) to detect directional shifts, it tracks the duration of each historical trend and calculates an average to forecast how long the current trend is statistically likely to continue. This allows traders to visualize both real-time trend strength and potential exhaustion zones with exceptional clarity.
⯁ KEY FEATURES
Dynamic Trend Detection: Utilizes the Hull Moving Average to identify when price transitions into a new uptrend or downtrend.
Trend Duration Counting: Measures the number of bars in each completed bullish and bearish phase to understand trend persistence.
Forecast Projection: Automatically projects an estimated trend continuation line based on the average length of recent trends.
Real-Time Updates: Continuously updates the “Real Length” label as the trend develops.
Historical Data Table: Displays previous trend durations for both bullish and bearish cycles, along with their averages.
Adaptive Sampling: Uses a customizable sample size to smooth out volatility in the forecast and provide statistically meaningful projections.
Color-Based Clarity: Highlights uptrends in green and downtrends in orange for instant visual interpretation.
⯁ USAGE
Use the Trend Detection Sensitivity setting to control how fast or slow the indicator reacts to trend changes — lower values increase responsiveness, while higher values smooth out noise.
Compare the Real Length of the ongoing trend with the Probable Length forecast to estimate whether the move is nearing exhaustion.
Observe the historical duration table to understand the average lifespan of trends in the current market structure.
Use the color-coded HMA line and projection arrows to identify when momentum strength is fading and prepare for possible reversals.
Ideal for swing or trend-following strategies where trend longevity is crucial to managing entries and exits effectively.
⯁ CONCLUSION
The Trend Duration Forecast gives traders a quantitative edge by combining real-time trend tracking with statistical forecasting. It helps identify not only when a new trend begins, but also how long it’s likely to persist based on past market behavior. This indicator enhances timing precision for both entries and exits, supporting smarter trend-following decisions with clear, data-driven insights.

Trend TraderThe Trend Trader indicator is a trend-following tool based on a triple EMA (Exponential Moving Average) setup designed to help traders identify market direction and potential reversal zones. It plots three customizable EMAs on the chart to highlight bullish and bearish momentum, then generates trade signals when price shows a strong likelihood of continuing in the direction of the prevailing trend.
EMA Alignment: The indicator checks for bullish stacking (fast EMA above medium, medium above slow) and bearish stacking (fast EMA below medium, medium below slow). This alignment defines the prevailing market trend.
Trend Validation: A user-defined lookback period ensures signals are only taken if the market recently displayed a stacked trend, thus filtering false entries during consolidations.
Signal Generation: Buy signals appear when price dips into the zone between the fast and medium EMAs during a bullish trend. Sell signals appear when price rallies into the zone between the fast and medium EMAs during a bearish trend.
Alerts: Built-in alerts notify traders of new trade opportunities without having to constantly watch the chart.
This indicator is suitable for swing trading and intraday strategies across multiple markets, including forex, stocks, indices, and crypto.
Suggested Strategy for Profitability
This tool is best used as part of a structured trend-trading plan. Below is a suggested framework:
Entry Rules
Long (Buy Trade):
Confirm that EMA alignment is bullish (EMA1 > EMA2 > EMA3).
Wait for a Buy Signal (triangle up below price).
Ensure the higher timeframe (e.g., 4H if trading 1H) trend is also bullish to filter trades.
Short (Sell Trade):
Confirm EMA alignment is bearish (EMA1 < EMA2 < EMA3).
Wait for a Sell Signal (triangle down above price).
Higher timeframe should also be bearish to increase probability.
Stop Loss
For long positions, place the stop loss just below EMA3 or the most recent swing low.
For short positions, place the stop loss just above EMA3 or the most recent swing high.
Take Profit
Conservative: Set TP at 1.5x to 2x the stop loss distance.
Aggressive: Trail stop loss below EMA2 (for longs) or above EMA2 (for shorts) to capture larger trends.
Risk Management
Use no more than 1–2% of account risk per trade.
Trade only when the signal aligns with overall market context (higher timeframe, support/resistance, or volume confirmation).
This indicator is very similar to the indicator "Trend Scalper" by the same developer, the difference is this indicator is used to just find the trade and hold the trade or to find the reversal of a trend instead of triggering alerts every time price enters between EMA1 and EMA2.
Trend Fib Zone Bounce (TFZB) [KedArc Quant]Description:
Trend Fib Zone Bounce (TFZB) trades with the latest confirmed Supply/Demand zone using a single, configurable Fib pullback (0.3/0.5/0.6). Trade only in the direction of the most recent zone and use a single, configurable fib level for pullback entries.
• Detects market structure via confirmed swing highs/lows using a rolling window.
• Draws Supply/Demand zones (bearish/bullish rectangles) from the latest MSS (CHOCH or BOS) event.
• Computes intra zone Fib guide rails and keeps them extended in real time.
• Triggers BUY only inside bullish zones and SELL only inside bearish zones when price touches the selected fib and closes back beyond it (bounce confirmation).
• Optional labels print BULL/BEAR + fib next to the triangle markers.
What it does
Finds structure using confirmed swing highs/lows (you choose the confirmation length).
Builds the latest zone (bullish = demand, bearish = supply) after a CHOCH/BOS event.
Draws intra-zone “guide rails” (Fib lines) and extends them live.
Signals only with the trend of that zone:
BUY inside a bullish zone when price tags the selected Fib and closes back above it.
SELL inside a bearish zone when price tags the selected Fib and closes back below it.
Optional labels print BULL/BEAR + Fib next to triangles for quick context
Why this is different
Most “zone + fib + signal” tools bolt together several indicators, or fire counter-trend signals because they don’t fully respect structure. TFZB is intentionally minimal:
Single bias source: the latest confirmed zone defines direction; nothing else overrides it.
Single entry rule: one Fib bounce (0.3/0.5/0.6 selectable) inside that zone—no counter-trend trades by design.
Clean visuals: you can show only the most recent zone, clamp overlap, and keep just the rails that matter.
Deterministic & transparent: every plot/label comes from the code you see—no external series or hidden smoothing
How it helps traders
Cuts decision noise: you always know the bias and the only entry that matters right now.
Forces discipline: if price isn’t inside the active zone, you don’t trade.
Adapts to volatility: pick 0.3 in strong trends, 0.5 as the default, 0.6 in chop.
Non-repainting zones: swings are confirmed after Structure Length bars, then used to build zones that extend forward (they don’t “teleport” later)
How it works (details)
*Structure confirmation
A swing high/low is only confirmed after Structure Length bars have elapsed; the dot is plotted back on the original bar using offset. Expect a confirmation delay of about Structure Length × timeframe.
*Zone creation
After a CHOCH/BOS (momentum shift / break of prior swing), TFZB draws the new Supply/Demand zone from the swing anchors and sets it active.
*Fib guide rails
Inside the active zone TFZB projects up to five Fib lines (defaults: 0.3 / 0.5 / 0.7) and extends them as time passes.
*Entry logic (with-trend only)
BUY: bar’s low ≤ fib and close > fib inside a bullish zone.
SELL: bar’s high ≥ fib and close < fib inside a bearish zone.
*Optionally restrict to one signal per zone to avoid over-trading.
(Optional) Aggressive confirm-bar entry
When do the swing dots print?
* The code confirms a swing only after `structureLen` bars have elapsed since that candidate high/low.
* On a 5-min chart with `structureLen = 10`, that’s about 50 minutes later.
* When the swing confirms, the script plots the dot back on the original bar (via `offset = -structureLen`). So you *see* the dot on the old bar, but it only appears on the chart once the confirming bar arrives.
> Practical takeaway: expect swing markers to appear roughly `structureLen × timeframe` later. Zones and signals are built from those confirmed swings.
Best timeframe for this Indicator
Use the timeframe that matches your holding period and the noise level of the instrument:
* Intraday :
* 5m or 15m are the sweet spots.
* Suggested `structureLen`:
* 5m: 10–14 (confirmation delay \~50–70 min)
* 15m: 8–10 (confirmation delay \~2–2.5 hours)
* Keep Entry Fib at 0.5 to start; try 0.3 in strong trends, 0.6 in chop.
* Tip: avoid the first 10–15 minutes after the open; let the initial volatility set the early structure.
* Swing/overnight:
* 1h or 4h.
* `structureLen`:
* 1h: 6–10 (6–10 hours confirmation)
* 4h: 5–8 (20–32 hours confirmation)
* 1m scalping: not recommended here—the confirmation lag relative to the noise makes zones less reliable.
Inputs (all groups)
Structure
• Show Swing Points (structureTog)
o Plots small dots on the bar where a swing point is confirmed (offset back by Structure Length).
• Structure Length (structureLen)
o Lookback used to confirm swing highs/lows and determine local structure. Higher = fewer, stronger swings; lower = more reactive.
Zones
• Show Last (zoneDispNum)
o Maximum number of zones kept on the chart when Display All Zones is off.
• Display All Zones (dispAll)
o If on, ignores Show Last and keeps all zones/levels.
• Zone Display (zoneFilter): Bullish Only / Bearish Only / Both
o Filters which zone types are drawn and eligible for signals.
• Clean Up Level Overlap (noOverlap)
o Prevents fib lines from overlapping when a new zone starts near the previous one (clamps line start/end times for readability).
Fib Levels
Each row controls whether a fib is drawn and how it looks:
• Toggle (f1Tog…f5Tog): Show/hide a given fib line.
• Level (f1Lvl…f5Lvl): Numeric ratio in . Defaults active: 0.3, 0.5, 0.7 (0 and 1 off by default).
• Line Style (f1Style…f5Style): Solid / Dashed / Dotted.
• Bull/Bear Colors (f#BullColor, f#BearColor): Per-fib color in bullish vs bearish zones.
Style
• Structure Color: Dot color for confirmed swing points.
• Bullish Zone Color / Bearish Zone Color: Rectangle fills (transparent by default).
Signals
• Entry Fib for Signals (entryFibSel): Choose 0.3, 0.5 (default), or 0.6 as the trigger line.
• Show Buy/Sell Signals (showSignals): Toggles triangle markers on/off.
• One Signal Per Zone (oneSignalPerZone): If on, suppresses additional entries within the same zone after the first trigger.
• Show Signal Text Labels (Bull/Bear + Fib) (showSignalLabels): Adds a small label next to each triangle showing zone bias and the fib used (e.g., BULL 0.5 or BEAR 0.3).
How TFZB decides signals
With trend only:
• BUY
1. Latest active zone is bullish.
2. Current bar’s close is inside the zone (between top and bottom).
3. The bar’s low ≤ selected fib and it closes > selected fib (bounce).
• SELL
1. Latest active zone is bearish.
2. Current bar’s close is inside the zone.
3. The bar’s high ≥ selected fib and it closes < selected fib.
Markers & labels
• BUY: triangle up below the bar; optional label “BULL 0.x” above it.
• SELL: triangle down above the bar; optional label “BEAR 0.x” below it.
Right-Panel Swing Log (Table)
What it is
A compact, auto-updating log of the most recent Swing High/Low events, printed in the top-right of the chart.
It helps you see when a pivot formed, when it was confirmed, and at what price—so you know the earliest bar a zone-based signal could have appeared.
Columns
Type – Swing High or Swing Low.
Date – Calendar date of the swing bar (follows the chart’s timezone).
Swing @ – Time of the original swing bar (where the dot is drawn).
Confirm @ – Time of the bar that confirmed that swing (≈ Structure Length × timeframe after the swing). This is also the earliest moment a new zone/entry can be considered.
Price – The swing price (high for SH, low for SL).
Why it’s useful
Clarity on repaint/confirmation: shows the natural delay between a swing forming and being usable—no guessing.
Planning & journaling: quick reference of today’s pivots and prices for notes/backtesting.
Scanning intraday: glance to see if you already have a confirmed zone (and therefore valid fib-bounce entries), or if you’re still waiting.
Context for signals: if a fib-bounce triangle appears before the time listed in Confirm @, it’s not a valid trade (you were too early).
Settings (Inputs → Logging)
Log swing times / Show table – turn the table on/off.
Rows to keep – how many recent entries to display.
Show labels on swing bar – optional tags on the chart (“Swing High 11:45”, “Confirm SH 14:15”) that match the table.
Recommended defaults
• Structure Length: 10–20 for intraday; 20–40 for swing.
• Entry Fib for Signals: 0.5 to start; try 0.3 in stronger trends and 0.6 in choppier markets.
• One Signal Per Zone: ON (prevents over trading).
• Zone Display: Both.
• Fib Lines: Keep 0.3/0.5/0.7 on; turn on 0 and 1 only if you need anchors.
Alerts
Two alert conditions are available:
• BUY signal – fires when a with trend bullish bounce at the selected fib occurs inside a bullish zone.
• SELL signal – fires when a with trend bearish bounce at the selected fib occurs inside a bearish zone.
Create alerts from the chart’s Alerts panel and select the desired condition. Use Once Per Bar Close to avoid intrabar flicker.
Notes & tips
• Swing dots are confirmed only after Structure Length bars, so they plot back in time; zones built from these confirmed swings do not repaint (though they extend as new bars form).
• If you don’t see a BUY where you expect one, check: (1) Is the active zone bullish? (2) Did the candle’s low actually pierce the selected fib and close above it? (3) Is One Signal Per Zone suppressing a second entry?
• You can hide visual clutter by reducing Show Last to 1–3 while keeping Display All Zones off.
Glossary
• CHOCH (Change of Character): A shift where price breaks beyond the last opposite swing while local momentum flips.
• BOS (Break of Structure): A cleaner break beyond the prior swing level in the current momentum direction.
• MSS: Either CHOCH or BOS – any event that spawns a new zone.
Extension ideas (optional)
• Add fib extensions (1.272 / 1.618) for target lines.
• Zone quality score using ATR normalization to filter weak impulses.
• HTF filter to only accept zones aligned with a higher timeframe trend.
⚠️ Disclaimer This script is provided for educational purposes only.
Past performance does not guarantee future results.
Trading involves risk, and users should exercise caution and use proper risk management when applying this strategy.

Trend CandlesTrend Candles
Overview
The Trend Candles indicator is a simple yet effective tool designed to help traders visually identify the prevailing market trend. By combining candle coloring with a trend-based Exponential Moving Average (EMA), it enhances chart readability and makes trend-following strategies easier to apply.
Concepts
Exponential Moving Average (EMA): The EMA is a moving average that places more weight on recent price data. It reacts faster to price changes compared to a Simple Moving Average (SMA), making it well-suited for trend detection.
Trend Determination:
- If the EMA is rising (current EMA > previous EMA), the market is considered bullish.
- If the EMA is falling (current EMA < previous EMA), the market is considered bearish.
- If the EMA is flat (no significant change), no trend color is applied.
Candle Coloring:
- Green candles = Uptrend
- Purple candles = Downtrend
- Default candles = Sideways/Flat EMA
Features
- Trend Visualization: Candles automatically change color based on EMA slope, making it easy to spot bullish and bearish phases.
- Customizable EMA Length: The trader can set the EMA period (default is 50), allowing flexibility for short-term or long-term trend analysis.
- Overlay EMA Line: An orange EMA line is plotted on the chart for additional confirmation of the trend.
- Clean & Minimalist: Focuses on trend clarity without cluttering the chart with unnecessary signals.
How to Use
1. Apply the indicator to your chart.
2. Adjust the EMA Length as per your trading style (shorter = faster signals, longer = smoother trend).
3. Follow the candle color:
- Green = Favor long entries.
- Purple = Favor short entries.
- No color = Stay cautious, as trend is unclear.
4. Use with other confirmation tools (support/resistance, volume, or oscillators).
5. Users are encouraged to experiment with different EMA lengths. The default length is 50, but you can explore other values based on your needs. In particular, try Fibonacci numbers such as 13, 21, 34, 55, 89, 144, and 233 to observe how trends behave differently.
Disclaimer
The information provided by the Trend Candles indicator is for educational purposes only. It should not be considered financial advice. Trading involves substantial risk, and past performance is not necessarily indicative of future results. Always do your own research and use risk management practices.

Trend Scanner ProTrend Scanner Pro, Robust Trend Direction and Strength Estimator
Trend Scanner Pro is designed to evaluate the current market trend with maximum robustness, providing both direction and strength based on statistically reliable data.
This indicator builds upon the core logic of a previous script I developed, called Best SMA Finder. While the original script focused on identifying the most profitable SMA length based on backtested trade performance, Trend Scanner Pro takes that foundation further to serve a different purpose: analyzing and quantifying the actual trend state in real time.
It begins by testing hundreds of SMA lengths, from 10 to 1000 periods. Each one is scored using a custom robustness formula that combines profit factor, number of trades, and win rate. Only SMAs with a sufficient number of trades are retained, ensuring statistical validity and avoiding curve fitting.
The SMA with the highest robustness score is selected as the dynamic reference point. The script then calculates how far the price deviates from it using rolling standard deviation, assigning a trend strength score from -5 (strong bearish) to +5 (strong bullish), with 0 as neutral.
Two detection modes are available:
Slope mode, based on SMA slope reversals
Bias mode, based on directional shifts relative to deviation zones
Optional features:
Deviation bands for visual structure
Candle coloring to reflect trend strength
Compact table showing real-time trend status
This tool is intended for traders who want an adaptive, objective, and statistically grounded assessment of market trend conditions.

Trend Targets [AlgoAlpha]OVERVIEW
This script combines a smoothed trend-following model with dynamic price rejection logic and ATR-based target projection to give traders a complete visual framework for trading trend continuations. It overlays on price and automatically detects potential trend shifts, confirms rejections near dynamic support/resistance, and displays calculated stop-loss and take-profit levels to support structured risk-reward management. Unlike traditional indicators that only show trend direction or signal entries, this tool brings together a unique mix of signal validation, volatility-aware positioning, and layered profit-taking to guide decision-making with more context.
CONCEPTS
The core trend logic is built on a custom Supertrend that uses an ATR-based band structure with long smoothing chains—first through a WMA, then an EMA—allowing the trend line to respond to major shifts while ignoring noise. A key addition is the use of rejection logic: the script looks for consolidation candles that "hug" the smoothed trend line and counts how many consecutive bars reject from it. This behavior often precedes significant moves. A user-defined threshold filters out weak tests and highlights only meaningful rejections.
FEATURES
Trend Detection : Automatically identifies trend direction using a smoothed Supertrend (WMA + EMA), with shape markers on trend shifts and color-coded bars for clarity.
Rejection Signals : Detects price rejections at the trend line after a user-defined number of consolidation bars; plots ▲/▼ icons to highlight strong continuation setups.
Target Projection : On trend confirmation, plots entry, stop-loss (ATR-based), and three dynamic take-profit levels based on customizable multiples.
Dynamic Updates : All levels (entry, SL, TP1–TP3) auto-adjust based on volatility and are labeled in real time on the chart.
Customization : Users can tweak trend parameters, rejection confirmation count, SL/TP ratios, smoothing lengths, and appearance settings.
Alerts : Built-in alerts for trend changes, rejection events, and when TP1, TP2, or TP3 are reached.
Chart Overlay : Plots directly on price chart with minimal clutter and clearly labeled levels for easy trading.
USAGE
Start by tuning the Supertrend factor and ATR period to fit your asset and timeframe—higher values will catch bigger swings, lower values catch faster moves. The confirmation count should match how tightly you want to filter rejection behavior—higher values make signals rarer but stronger. When the trend shifts, the indicator colors the bars and line accordingly, and if enabled, plots the full entry-TP-SL structure. Rejection markers appear only after enough qualifying bars confirm price pressure at the trend line. This is especially useful for continuation plays where price retests the trend but fails to break it. All calculations are based on volatility (ATR), so targets naturally adjust with market conditions. Add alerts to get notified of important signals even when away from the chart.

Trend CounterTREND COUNTER is a Trend Exhaustion Indicator that tracks the persistence of price movements over a series of bars, helping traders identify potential trend exhaustion and reversals.
It compares each bar's value (typically the closing price) to a previous bar from a set lookback period (the lookback bar), counting consecutive bullish or bearish price movements.
The count resets when the trend reverses, signaling a potential shift in momentum.
• Price movement is considered bullish if the current price exceeds the lookback bar's price, incrementing the bullish count with each consecutive occurrence.
• Price movement is considered bearish if the current price is lower than the lookback bar's price, incrementing the bearish count with each consecutive occurrence.
• The count resets when the trend reverses.
• The user sets the threshold for sequence resets by defining the maximum number of consecutive occurrences.
• The count may reset before a trend reversal if it surpasses the user-defined threshold.
This type of indicator is useful for detecting trends, trend exhaustion, overbought or oversold conditions, and potential reversal points, helping traders anticipate market turns.
• Sequential occurrences gauge trend strength.
A long sequence of bullish bars suggests strong upward momentum, while consecutive bearish bars indicate sustained downward pressure.
This helps traders assess whether a trend is likely to continue or weaken.
• Identify thresholds for potential reversal points.
Counting consecutive bullish or bearish price movements can highlight overextended trends.
A trend reaching a predefined threshold may signal an upcoming reversal or momentum slowdown.
• Identify potential entry or exit points.
If trends are showing signs of exhaustion after a certain number of consecutive price movements, traders may use this for timing adjustments to their position.
• Assess risk.
Understanding trend strength helps traders better adjust stop-loss or take-profit levels.
Sequential counting provides a structured approach to trade management.
Visualization & Customization
The Sequential Momentum indicator visually represents consecutive bullish or bearish price movements to define trends and highlight key shifts.
• The bullish/bearish bar sequences are based on user-defined thresholds.
• Customizable bar coloring, labels, and plot shapes enhanced trend visualization.
• Dynamic color transitions make trend shifts easily identifiable.
Tracking consecutive bullish or bearish price movements can be effective when combined with other indicators or applied in specific market conditions (e.g., trending or volatile markets).
However, its reliability depends on market conditions and the trader’s interpretation.
This indicator is best used as a complementary tool rather than a standalone signal, helping traders visualize and quantify market momentum within a broader strategy.
Trend Trading IndicatorTrend Trading Indicator – Pine Script v5
Overview
The Trend Trading Indicator is designed to help traders identify market trends quickly and effectively. It highlights uptrends and downtrends using Exponential Moving Averages (EMAs) and provides clear buy and sell signals. The indicator is especially useful for detecting insider movements, marketing-driven price pumps, and potential death spirals in crypto and stock markets.
Key Features
✅ Fast-acting trend detection based on EMAs
✅ Clear buy & sell signals marked in blue (BUY) and red (SELL)
✅ Trend zones visually highlighted:
Green for bullish trends (uptrend)
Red for bearish trends (downtrend)
✅ Bold and visible labels for buy and sell signals
✅ Protects against insider selling & marketing hype cycles
✅ Alerts for crossover events
How It Works
Exponential Moving Averages (EMAs)
Short EMA (default: 50-period) represents fast market movement.
Long EMA (default: 100-period) represents slower trends.
When short EMA crosses above long EMA, it signals a buy opportunity.
When short EMA crosses below long EMA, it signals a sell opportunity.
Trend Zones
The area between the two EMAs is color-filled for better trend visualization.
Green Fill: Indicates a bullish trend where short EMA is above long EMA.
Red Fill: Indicates a bearish trend where short EMA is below long EMA.
Buy & Sell Labels
Buy Signal: Blue label “BUY” appears below the candle.
Sell Signal: Red label “SELL” appears above the candle.
Text is in black & bold for better visibility.
Alerts
Custom alerts notify traders when buy or sell conditions occur.
How to Use
Works best in crypto, forex, and stock markets.
Can be used in trend-following or breakout strategies.
Best suited for medium to long-term trades (adjust EMA settings for scalping).
This Trend Trading Indicator helps traders stay ahead of the market by visually identifying strong trends while reducing risks from insider manipulation and death spirals. 🚀
Trending Market Toolkit [LuxAlgo]The Trending Market Toolkit focuses exclusively on trending market structures and high-confluence, high-risk-to-reward entry models. It is designed to complement discretionary trading by offering different entry strategies based on market structure.
🔶 USAGE
In the chart above we can see how the tool detects several reversals, draws the broken trendlines, the reversal areas from which the tool starts looking for a trigger, and when it finally happens, a potential trade with risk and reward areas and the risk/reward ratio.
🔹 Detection Mode
Traders can choose between three different modes: trend only, reversal only, or both.
If both are active, reversals have priority over trends, so the tool will not detect a trend if a reversal is active.
In the chart above we can see all three modes.
🔹 Detection on Higher Timeframes
Traders can choose to identify structures on the chart timeframe or on a higher timeframe.
In the chart above, we have the SP500 futures on the 5m timeframe with different settings: chart timeframe, 30m, and 1H.
🔹 Risk And Targets
Depending on whether the high-risk/reward parameter is enabled, traders can choose between three different targets and two different stops.
The chart above shows how different choices affect the risk/reward ratio for the same potential trade on the Gold Futures 2m chart.
🔶 SETTINGS
Show: Traders can choose between Trends, Reversals or Both.
🔹 Structures
Swing Length: Number of candles to confirm a swing high or swing low. A higher number detects larger swings.
Custom Timeframe: Traders can make use of the current chart timeframe, or choose a custom timeframe.
Reversal Area Threshold: A higher number increases the reversal area.
🔹 Trades
Trade Trigger Length: Number of candles to confirm an internal high or internal low. A lower number detects smaller swings. It must be the same size or smaller than the swing length.
Target: Traders can choose between the default target (0) or two extended targets (0.27 or 0.618).
Risk to Reward Threshold: Set the minimum risk-to-reward ratio to detect trades. Use the 0 value to detect all trades.
High Risk to Reward: Enable/Disable the high risk to reward mode.

Trend Signals with TP & SL [UAlgo] StrategyThe "Trend Signals with TP & SL Strategy" is a trading strategy designed to capture trend continuation signals while incorporating sophisticated risk management techniques. This strategy is tailored for traders who wish to capitalize on trending market conditions with precise entry and exit points, automatically calculating Take Profit (TP) and Stop Loss (SL) levels based on either Average True Range (ATR) or percentage values. The strategy aims to enhance trade management by preventing multiple simultaneous positions and dynamically adapting to changing market conditions.
This strategy is highly configurable, allowing traders to adjust sensitivity, the ATR calculation method, and the cloud moving average length. Additionally, the strategy can display buy and sell signals directly on the chart, along with visual representation of entry points, stop losses, and take profits. It also features a cloud-based trend analysis using a MACD-driven color fill that indicates the strength and direction of the trend.
🔶 Key Features
Configurable Trend Continuation Signals:
Source Selection: The strategy uses the midpoint of the high-low range as the default source, but it is adjustable.
Sensitivity: The sensitivity of the trend signals can be adjusted using a multiplier, ranging from 0.5 to 5.
ATR Calculation: The strategy allows users to choose between two ATR calculation methods for better adaptability to different market conditions.
Cloud Moving Average: Traders can adjust the cloud moving average length, which is used in conjunction with MACD to provide a visual trend indication.
Take Profit & Stop Loss Management:
ATR-Based or Percent-Based: The strategy offers flexibility in setting TP and SL levels, allowing traders to choose between ATR-based multipliers or fixed percentage values.
Dynamic Adjustment: TP and SL levels are dynamically adjusted according to the selected method, ensuring trades are managed based on real-time market conditions.
Prevention of Multiple Positions:
Single Position Control: To reduce risk and enhance strategy reliability, the strategy includes an option to prevent multiple positions from being opened simultaneously.
Visual Trade Indicators:
Buy/Sell Signals: Clearly displays buy and sell signals on the chart for easy interpretation.
Entry, SL, and TP Lines: Draws lines for entry price, stop loss, and take profit directly on the chart, helping traders to monitor trades visually.
Trend Cloud: A color-filled cloud based on MACD and the cloud moving average provides a visual cue of the trend’s direction and strength.
Performance Summary Table:
In-Chart Statistics: A table in the top right of the chart displays key performance metrics, including total trades, wins, losses, and win rate percentage, offering a quick overview of the strategy’s effectiveness.
🔶 Interpreting the Indicator
Trend Signals: The strategy identifies trend continuation signals based on price action relative to an ATR-based threshold. A buy signal is generated when the price crosses above a key level, indicating an uptrend. Conversely, a sell signal occurs when the price crosses below a level, signaling a downtrend.
Cloud Visualization: The cloud, derived from MACD and moving averages, changes color to reflect the current trend. A positive cloud in aqua suggests an uptrend, while a red cloud indicates a downtrend. The transparency of the cloud offers further nuance, with more solid colors denoting stronger trends.
Entry and Exit Management: Once a trend signal is generated, the strategy automatically sets TP and SL levels based on your chosen method (ATR or percentage). The stop loss and take profit lines will appear on the chart, showing where the strategy will exit the trade. If the price reaches either the SL or TP, the trade is closed, and the respective line is deleted from the chart.
Performance Metrics: The strategy’s performance is tracked in real-time with an in-chart table. This table provides essential information about the number of trades executed, the win/loss ratio, and the overall win rate. This information helps traders assess the strategy's effectiveness and make necessary adjustments.
This strategy is designed for those who seek to engage with trending markets, offering robust tools for entry, exit, and overall trade management. By understanding and leveraging these features, traders can potentially improve their trading outcomes and risk management.
🔷 Related Script
🔶 Disclaimer
Use with Caution: This indicator is provided for educational and informational purposes only and should not be considered as financial advice. Users should exercise caution and perform their own analysis before making trading decisions based on the indicator's signals.
Not Financial Advice: The information provided by this indicator does not constitute financial advice, and the creator (UAlgo) shall not be held responsible for any trading losses incurred as a result of using this indicator.
Backtesting Recommended: Traders are encouraged to backtest the indicator thoroughly on historical data before using it in live trading to assess its performance and suitability for their trading strategies.
Risk Management: Trading involves inherent risks, and users should implement proper risk management strategies, including but not limited to stop-loss orders and position sizing, to mitigate potential losses.
No Guarantees: The accuracy and reliability of the indicator's signals cannot be guaranteed, as they are based on historical price data and past performance may not be indicative of future results.

Trend Strength GaugeTrend Strength Gauge with Modified Hull Moving Average (HMA)
Overview:
The indicator combines a modified Hull Moving Average (HMA) with a visual gauge that represents the strength and direction of the current trend. This helps traders quickly assess the trend's vigor and direction.
Key Features:
Modified Hull Moving Average (HMA):
Purpose: The HMA is a smoothed moving average designed to reduce lag and provide more responsive trend signals.
The indicator displays two HMA line and SMA line on the chart and fill color between them
based on HMA is above SMA or not.
Trend Strength Gauge:
Visualization: Below the chart, there's a gauge represented by gradient line gauge with "V" symbol.
The gauge line change color based on the direction of the trend.
Additionally, symbol "V" moves from solid color to transparent, indicating the trend's strength gradient.
Up Trend:
Dn Trend:
Trend Assessment:
When "V" at the strong teal collor it represents a strong positive trend (uptrend).
When "V" at the strong white collor it Indicates a strong negative trend (downtrend).
Arrow Movement: The symbol 'V' transitions from a solid color (teal or white) to a more transparent shade based on the strength of the trend.
Usage:
Trend Confirmation: Traders can use this indicator to confirm trends and assess their strength before making trading decisions.
Entry/Exit Points: The changing colors and transparency levels of the 'V' symbols can assist in identifying potential entry or exit points.
Can be used as a simple Hull indicator
This combined indicator simplifies trend analysis by offering an easily understandable visual representation of trend strength and direction.
Remember, while indicators are valuable tools, successful trading requires a comprehensive approach that incorporates multiple sources of information and risk management strategies.
Always exercise caution, apply critical thinking, and consider the broader market context when using indicators to make informed trading decisions.
Trend Line XrossTrend Line Xross (TLX) Uses User Input Points to draw trendlines and displays the exact intersection point of those trendlines.
This is the public indicator of the practical application for this intersection method included in my entry for Pinefest #1.
To determine the exact intersection point I am using the y-intercept method as seen below.
The code is notated for more information on the technical workings.
One difference to note between this version and the pinefest version is that I had to change the line drawings to use bar_index values so that I can use line.get_price() to grab the current value of the line to make alerts from.
Additionally, there are alerts built-in to this version for every type of cross on all of the visible lines.
Enjoy!

Trendlines 2x ver. 5 plus GMMA modifiedthis is a copy of "Trendlines 2x +" Script by Lij_MC (but converted to Version 5 of Pine script), which draws trendlines from the pivot points in the price chart and also add some arrows from "Guppy Multiple Moving Averages" Indicator by optictropic for trend confirmation.
I Change this code from Pine script 4 to 5 to add some functionalities to it.
Some adjustments of parameters have been made by me to easy recognition of Trendline breaks.
These parameters are in the original code, but I make them default for nicer look of the indicator and easier recognition of Trendline breaks.
for example, breaking the primary trendlines are shown by color change of the candles and in the same time by a Break symbol as a label.
breaking the secondary trendlines are shown only by candle color. Extension of the secondary trendlines are set to 50 candles to better recognize the past trendlines .
color candles are set to default to easily see the trend direction of the chart.
I have also added some arrows by the help of "Guppy Multiple Moving Averages" indicator by optictropic, that can be used for confirmation of trend direction.
I think this can represent good looking trend direction and trendline breaks can help traders for a better trade decision.
for better trading with this indicator, buy when you have green or lime color for candles, and GMMA gives UP long arrow signals, check higher time frames, and at last, this is only a help but not a final decision making indicator. you must have your own price action analysis.
best wishes
Trend Following based on Trend ConfidenceThis is a Trend Following strategy based on the Trend Confidence indicator.
The goal of this strategy is to be a simple Trend Following strategy, but also to be as precise as possible when it comes to the question 'how confident are we that a linear trend is ongoing?'. For this we calculate the 'confidence' of a linear trend in the past number of closing prices. The idea of this strategy is that past a certain confidence, the ongoing linear trend is more likely to continue than not.
Trend Confidence:
The Trend Confidence shows us how strong of a linear trend the price has made in the past number (given by Length parameter) of closing prices. The steepness of the price change makes the Trend Confidence more extreme (more positive for an uptrend or more negative for a downtrend), and the deviation from a straight line makes the Trend Confidence less extreme (brings the confidence closer to 0). This way we can filter out signals by wild/sudden price moves that don't follow a clear linear trend.
Math behind the Trend Confidence:
A linear fit is made on the past number of closing prices, using Ordinary Linear Regression. We have the steepness of the linear fit: b in y=a+bx . And we have the standard deviation of the distances from the closing prices to the linear fit: sd . The Trend Confidence is the ratio b/sd .
Entries and Exits:
For entry and exit points we look at how extreme the Trend Confidence is. The strategy is based on the assumption that past a certain confidence level, the ongoing linear trend is more likely to continue than not.
So when the Trend Confidence passes above the 'Long entry" threshold, we go Long. After that when the Trend Confidence passes under the 'Long exit' threshold, we exit. The Long entry should be a positive value so that we go Long once a linear uptrend with enough confidence has been detected.
When the Trend Confidence passes below the 'Short entry' threshold, we go Short. After that when the Trend Confidence passes above the 'Short exit' threshold, we exit. The Short entry should be a negative value so that we go Short once a linear downtrend with enough confidence has been detected.
Default Parameters:
The strategy is intended for BTC-USD market, 4 hour timeframe. The strategy also works on ETH-USD with similar parameters.
The Length is arbitrarily set at 30, this means we look at the past 30 closing prices to determine a linear trend. Note that changing the length will change the range of Trend Confidence values encountered.
The default entry and exit thresholds for Longs and Shorts do not mirror each other. This is because the BTC-USD market goes up more heavily and more often than it goes down. So the ideal parameters for Longs and Shorts are not the same.
The positive results of the strategy remain when the parameters are slightly changed (robustness check).
The strategy uses 100% equity per trade, but has a 10% stop loss so that a maximum of 10% is risked per trade.
Commission is set at 0.1% as is the highest commission for most crypto exchanges.
Slippage is set at 5 ticks, source for this is theblock.co.

Trend-Quality IndicatorBINANCE:BTCUSDT
Open source version of the Trend-Quality Indicator as described by David Sepiashvili in [ Stocks & Commodities V. 22:4 (14-20) ]
Q-Indicator and B-Indicator are available both separately or together
█ OVERVIEW
The Trend-Quality indicator is a trend detection and estimation tool that is based on a two-step filtering technique. It measures cumulative price changes over term-oriented semicycles and relates them to “noise”. The approach reveals congestion and trending periods of the price movement and focuses on the most important trends, evaluating their strength in the process. The indicator is presented in a centered oscillator (Q-Indicator) and banded oscillator format (B-Indicator).
Semicycles are determined by using a short term and a longer term EMAs. The starting points for the cycles are determined by the moving averages crossover.
Cumulative price change (CPC) indicator measures the amount that the price has changed from a fixed starting point within a given semicycle. The CPC indicator is calculated as a cumulative sum of differences between the current and previous prices over the period from the fixed starting point.
The trend within the given semicycle can be found by calculating the moving average of the cumulative price change.
The noise can be defined as the average deviation of the cumulative price change from the trend. To determine linear noise, we calculate the absolute value of the difference between CPC and trend, and then smooth it over the n-point period. The root mean square noise, similar to the conventional standard deviation, can be derived by summing the squares of the difference between CPC and trend over each of the preceding n-point periods, dividing the sum by n, and calculating the square root of the result.
█ Q-INDICATOR
The Q-Indicator is a centered oscillator that fluctuates around a zero line with no upper or lower limits, is calculated by dividing trend by noise.
The Q-Indicator is intended to measure trend activity. The further the Q is from 0, the less the risk of trading with a trend, and the more reliable the trading opportunity. Values exceeding +2 or -2 can be qualified as promising
Values:
in the -1 to +1 range (GRAY) indicate that the trend is buried beneath noise. It is preferable to stay out of this zone
in the +1 to +2 or -1 to -2 range (YELLOW) indicate weak trending
in the +2 to +5 range (BLUE) or -2 to -5 range (ORANGE) indicate moderate trending
above +5 range (GREEN) or below -5 (RED) indicate strong trending
Readings exceeding strong trending levels can indicate overbought or oversold conditions and signal that price action should be monitored closely.
█ B-INDICATOR
The B-Indicator is a banded oscillator that fluctuates between 0 and 100, is calculated by dividing the absolute value of trend by noise added to absolute value of trend, and scaling the result appropriately.
The B-indicator doesn’t show the direction of price movement, but only the existence of the trend and its strength. It requires additional tools for reversal manifestations.
The indicator’s interpretation is simple. The central line suggests that the trend and noise are in equilibrium (trend is equal to noise).
Values:
below 50 (GRAY) indicate ranging market
in the 50 to 65 range (YELLOW) indicate weak trending
in the 65 to 80 range (BLUE) indicate moderate trending
above 80 (GREEN) indicate strong trending
The 65 level can be thought of as the demarcation line of trending and ranging markets and can help determine which type of technical analysis indicator (lagging or leading) is better suited to current market conditions. Readings exceeding strong trending levels can indicate overbought or oversold conditions.

Multi MA Trend Following Strategy TemplateTrend following is one of the better known technical trading strategies. But, which trend should you follow? Today I am sharing with the community a trend following template script that includes a selection of over 20 different trends / regressions. Some of these are in the Pine library, and some have been custom coded and contributed over time by the beloved Pine Coder community.
How it works:
This template will plot any of the 20+ trends that you can select in the settings. The strategy component will buy if the trend line is moving up, and will sell if it moves down. If the line is green that indicates that the trend is higher than the prior bar. If the line is red that indicates that the trend is lower than the prior bar. This script is different from many moving average scripts in that it follows the trend itself and doesn't look for a cross of multiple trends.
How to use it:
When wanting to trend follow an instrument, you can use this template to help identify what approach you might want to take and/or which indicator you might want to use. You can also modify the strategy as you see fit and make use of the 20+ incorporated indicators. Incorporate your trade and risk management strategy, or use it as an indicator.
Disclaimer: Open source scripts I publish in the community are largely meant to spark ideas that can be used as building blocks for part of a more robust trade management strategy. Even though this example script might beat buy and hold over the back-test time-frame, I wouldn't advise using it as a stand-alone strategy without significant additions/modifications to the strategy and risk management functions.

Trend Type Indicator by BobRivera990Usage:
The purpose of this indicator is to programmatically determine the type of price trend using technical analysis tools.
You can do a quick check on the asset’s higher and lower time frames. For example, if you are trading on an H1 chart, you can check the m5 chart to ensure that the trend is in the same direction and similarly check the H4 chart to ensure that the higher time frame price is also moving in the same direction.
If multiple time frame charts confirm a similar trend, then it is considered a very strong trend and ideal for Trend trading.
Remarks:
By default, the last status is related to 8 periods before the latest closing price.
Related definitions:
The three basic types of trends are up, down, and sideways.
1. Uptrend
An uptrend describes the price movement of a financial asset when the overall direction is upward. The uptrend is composed of higher swing lows and higher swing highs.
Some market participants ("long" trend traders) only choose to trade during uptrends.
2. Downtrend
A downtrend refers to the price action of a security that moves lower in price as it fluctuates over time.
The downtrend is composed of lower swing lows and lower swing highs.
3. Sideways
A sideways trend is the horizontal price movement that occurs when the forces of supply and demand are nearly equal. This typically occurs during a period of consolidation before the price continues a prior trend or reverses into a new trend.
How it works:
Step 1: Sideways Trend Detection
In this step we want to distinguish the sideways trend from uptrend and downtrend. For this purpose, we use two common technical analysis tools: ATR and ADX
1. Average True Range (ATR)
The average true range (ATR) is a technical analysis indicator that measures market volatility.
We also use a 20-period moving average of the ATR.
When the ATR is below the average of its last 20-periods, it means that the rate of price volatility has decreased and we conclude that the current trend is sideways
2. Average Directional Index (ADX)
The average directional index (ADX) is a technical analysis indicator used by some traders to determine the strength of a trend.
The trend has strength when ADX is above 25.
So when the ADX is less than or equal to 25, there is no strong trend, and we conclude that the current type of trend is sideways.
Step 2: Detect uptrend from downtrend
If it turns out that the current price trend is not sideways, then it is either uptrend or downtrend.
For this purpose, we use plus and minus directional Indicators (+ DI & -DI).
A general interpretation would be that during a strong trend, when +DI is higher than -DI, it is an uptrend. When -DI is higher than +DI, it is a downtrend.
Parameters:
"Use ATR …" ________________________// Use Average True Range (ATR) to detect Sideways Movements
"ATR Length"_______________________ // length of the Average True Range (ATR) used to detect Sideways Movements
"ATR Moving Average Type" ___________// Type of the moving average of the ATR used to detect Sideways Movements
"ATR MA Length" ____________________// length of the moving average of the ATR used to detect Sideways Movements
"Use ADX ..."_______________________ // Use Average Directional Index (ADX) to detect Sideways Movements
"ADX Smoothing”____________________// length of the Average Directional Index (ADX) used to detect Sideways Movements
"DI Length"_________________________// length of the Plus and Minus Directional Indicators (+DI & -DI) used to determine the direction of the trend
"ADX Limit" ________________________// A level of ADX used as the boundary between Trend Market and Sideways Market
"Smoothing Factor"__________________// Factor used for smoothing the oscillator
"Lag"______________________________// lag used to match indicator and chart
Resources:
www.investopedia.com

Trend ChannelMarket engineers can use channels to find out when a market has entered an undervalued or overvalued zone. Purchases and sales take place in these zones. Professionals use trending channels to find out when the market has overtaken itself and where it is likely to reverse.
Upper channel line = EMA + EMA x channel coefficient
Lower channel line = EMA - EMA x channel coefficient
The topline reflects the bulls' strength in raising prices above the average value consensus. This line marks the normal limit of optimism in the market.
The bottom line of the channel reflects the strength of the bears pushing prices below the average consensus of values. This line marks the normal limit of pessimism in the market.
The coefficient is used to correct the distance to the moving average until the channel contains 95% of all prices. Only the tips and the lowest bottoms are allowed to protrude. For these peaks and curves and sideways trends, I have added two more switchable lines to the border lines, with a distance of 23.6% (light blue).
The larger the time frame, the wider the channel.
If you buy near a rising moving average, you take profits near the upper line of the channel.
If you are short near a falling moving average, you should close out near the bottom of the channel.
If the moving average is essentially flat, then you should be long on the bottom of the channel and short on the top of the channel. You realize profits when the prices have returned to their moving average to normal.
Interesting for day traders:
Adjust the moving average so that it has the same slope as the quotes on the hourly chart. With the coefficient you set the distance between the border lines. Perhaps adding the 23.6% lines will help, where the sideways trends are starting. Set the resolution to "1 hour". If you want to trade with these settings in short time units, e.g. in the 3 minute chart or in the 1 minute chart, then you now have target marks and indications in which direction the prices will possibly move when the prices have reached the moving average or one of the border lines.
The text contains excerpts from "Come into my Trading Room" by Dr. Alexander Elder.
The indicator has an additional exponential moving average with adjustable period, adjustable shift and adjustable source for the narrow range of quotations and final determination of direction.
The chart shows how the trend channel and the Fibonacc trading indicator can complement each other.
The text contains excerpts from "Come into my Trading Room" by Dr. Alexander Elder.
Markttechniker können Kanäle verwenden um heraus zu finden, wann ein Markt eine unterbewertete oder überbewertete Zone erreicht hat. An diesen Zonen finden Käufe und Verkäufe statt. Profis benutzen Trendkanäle um herauszufinden, wann der Markt sich selbst überholt hat und wo er wahrscheinlich eine Umkehrbewegung vollziehen wird.
Obere Kanallinie = EMA + EMA x Kanalkoeffizient
Untere Kanallinie = EMA - EMA x Kanalkoeffizient
Die Oberlinie reflektiert die Kraft der Bullen, mit der sie die Kurse über den durchschnittlichen Wertekonsens anheben. Diese Linie kennzeichnet die normale Grenze des Optimismus im Markt.
Die untere Linie des Kanals reflektiert die Kraft der Bären, mit der sie die Kurse unter den durchschnittlichen Wertekonsens drücken. Diese Linie kennzeichnet die normale Grenze des Pessimismus im Markt.
Mit dem Koeffizienten wird der Abstand zum gleitenden Durchschnitt so lange korrigiert, bis der Kanal 95% aller Kurse enthält. Lediglich die Spitzen und die niedrigsten Böden dürfen herausragen. Für diese Spitzen und Bögen und Seitwärtstrends habe ich zu den Grenzlinien zwei weitere zuschaltbare Linien, mit einem Abstand von 23,6%, hinzugefügt (hellblau).
Je größer der Zeitrahmen ist, um so breiter ist der Kanal.
Wenn Sie in der Nähe eines ansteigenden gleitenden Durchschnitts kaufen, nehmen Sie die Gewinne in der Nähe der oberen Grenzlinie des Kanals mit.
Wenn Sie in der Nähe eines fallenden gleitenden Durchschnitts leerverkaufen, sollten Sie in der Nähe der unteren Grenzlinie des Kanals glattstellen.
Wenn der gleitende Durchschnitt im Wesentlichen flach ist, dann sollten Sie an der unteren Kanalbegrenzung eine Long-Position und an der oberen Kanalbegrenzung eine Short-Position einnehmen. Gewinne realisieren Sie jeweils, wenn die Kurse zu ihrem gleitenden Durchschnitt, zur Normalität zurückgekehrt sind.
Für Daytrader interessant:
Stellen Sie den gleitenden Durchschnitt so ein, dass er die gleiche Steigung wie die Notierungen im Stunden-Chart hat. Mit dem Koeffizienten Stellen Sie den Abstand der Grenzlinien ein. Vielleicht hilft die Zuschaltung der 23,6%-Linien, wo die Seitwärtstrends anstoßen. Stellen Sie die Auflösung auf „1 Stunde“. Wenn Sie mit diesen Einstellungen in niedrigen Zeiteinheiten traden wollen, z.B. im 3 Minuten-Chart oder im 1 Minuten-Chart, dann haben Sie jetzt Zielmarken und Hinweise in welche Richtung die Notierungen möglicherweise laufen werden, wenn die Notierungen den gleitenden Durchschnitt oder eine der Grenzlinien erreicht haben.
Der Text enthält Auszüge aus „Come into my Trading Room“ von Dr. Alexander Elder.
Der Indikator besitzt zur engen Umfang der Notierungen und endgültigen Richtungsbestimmung einen zusätzlichen exponentiellen gleitenden Durchschnitt mit einstellbarer Periode, einstellbarer Verschiebung und einstellbarer Quelle.
Der Chart zeigt wie sich Trendkanal und Fibonacc-Trading-Indikator ergänzen könne.
Der Text enthält Auszüge aus „Come into my Trading Room“ von Dr . Alexander Elder.

Trendy Bar Trend Color LiteLite version of the original Trendy Bar Trend Color
This will only color the candlestick body of your chart
Can be used with solid, hollow, renko, or any other chart type
Custom coloring for Highs, Lows, and consolidation is removed

Trends & RangesTrends & Ranges uses EMA ATR bands as a SuperTrend indicator.
How to use:
This indicator can be used to give you a direction bias, with the added function to create ranges which often lead to reversals or flat trading periods. Trade the break-out or wait for pull backs in the direction of the trend.
I'm not great at explaining stuff and will probably make things only more complicated, so I won't bother for now,
but if you have a question on how the script works I will gladly give it a try.
The option "Flexible Trends" will disable the min/max function (trailing or non trailing).
Flexible Trends enabled:
Flexible Trends disabled:
Settings are not optimized for any asset or time frame, you will have to do that for yourself. Feel free to share them in the comments.
Thanks for showing interest, enjoy and good luck! :)
