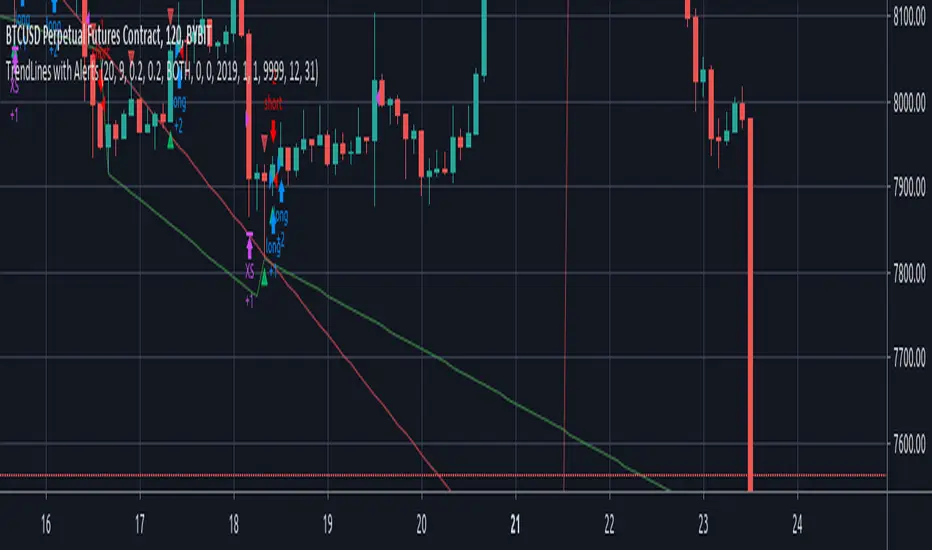
TrendLines with AlertsThis isn't my own work, hence giving it in Open Source library for others to benefit from it too.
I have tried to refin the output of trendlines in this Strategy
The original Code is available at
The script needs some modifications, so I'll be making further updates in future, but for now I'm publishing this because most people don't know how to track trandlines, moreover, some use Line.New() by tradingview Pinescript, which again is a bit difficult to deal with.
This script is a basic version of trendlines on a certain angle (anglecheck was provided by the original author in his script).
Nothing fancy in this script.
Also Converted the original Script to Pinescript v4.
Cerca negli script per "trend"
Trendlines 2x +Copy of "Trendlines - JD" script by Duyck, which draws Trendlines from the pivot points in the price chart.
I have simply Doubled the amount of Trendlines, so now there are;
A Primary set of Trendlines at a higher lookback length and Thicker Line Width
and
A Secondary set of Trendlines at a Lower lookback length and Thinner Line Width
The default values work well when comparing multiple time frames at 3x time difference, play around with these values for other x time variations
I have also simplyfied the Trendline Extension Function to make it more user friendly
Please use the Alerts with caution as the Trendline Break function still needs to be optimised
Also included are Trend Candles to color the bars according to momentum, Trencandles script is a copy of UCS_Trend by ucsgears

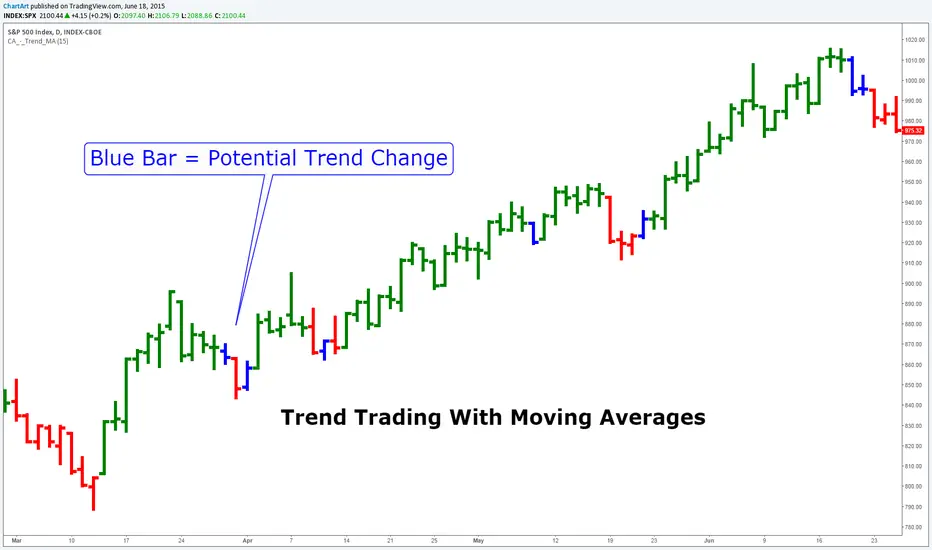
Trend Trading With Moving Averages (by ChartArt)This indicator is measuring if three different moving average calculations (EMA,WMA,SMA) with the same period length are aligned in an uptrend. If this is the case then the bar is colored in green. If only one or two of the three moving averages signals an uptrend then the bar is colored in blue. This can mean that the trend is changing.
Save another $999 bucks with this free indicator.
This is the ChartArt optimized version. Original idea: Steve Primo's Robbery Indicator (PET-D).
coded by UCSgears:
Trend lines & Pressure Zone Overview
This indicator intelligently identifies and plots dynamic support and resistance zones based on swing pivots and price action validation. It combines trend analysis with pressure zone detection to highlight key areas where price is likely to react.
Key Features
1.Smart Zone Detection
Automatically identifies the strongest resistance and support levels
Requires multiple price touches for validation (configurable)
Plots only the 2 most relevant trendlines to keep charts clean
Dynamic channel zones show the area of influence around each trendline
2.Dual Analysis Method
Uses swing pivot detection to find turning points
Validates zones through touch counting with price margin tolerance
Combines aspects of trendline analysis and pressure zone theory
Adapts to different timeframes and instruments
3.Contact Detection & Alerts
Visual circle markers when price contacts zones
Arrow indicators for zone interactions
Alert conditions for zone creation, breaks, and contacts
Customizable visual feedback
4.Flexible Configuration
Adjustable swing length for pivot detection
Configurable price margin tolerance
Minimum touch requirements prevent false signals
Optional line extension with custom length
Peak reset interval to refresh zones periodically
How It Works
Resistance Zones:
Identifies swing high pivots
Tracks the highest peak within the reset interval
When price drops below the peak, draws a downward trendline
Validates the zone by counting touches within the price margin
Only displays the zone after minimum touches are confirmed
Support Zones:
Identifies swing low pivots
Tracks the lowest trough within the reset interval
When price rises above the trough, draws an upward trendline
Validates the zone by counting touches within the price margin
Only displays the zone after minimum touches are confirmed
Zone Channels:
Each trendline includes a parallel channel showing the pressure zone width, making it easier to identify when price is interacting with the zone.
Pivot Detection:
Swing Length (default: 5) - Bars on each side to confirm pivot points
Peak Reset Interval (default: 100) - Bars before resetting tracked peak/trough
Zone Settings:
Price Margin % (default: 0.1%) - Tolerance for touch validation
Minimum Touches (default: 3) - Required touches before drawing zone
Channel Width % (default: 0.5%) - Visual width of pressure zone
Extension:
Extend Lines (default: off) - Project lines into the future
Extension Length (default: 50) - Bars to extend when enabled
Visual Styling:
Separate color/width controls for resistance and support
Customizable fill transparency for channels, Toggle contact arrows and circles
Trading Applications
Entry Signals:
Buy when price contacts support zone with confirmation
Sell when price contacts resistance zone with confirmation, Look for zone breaks as momentum signals
Stop Loss Placement:
Place stops beyond the opposite zone, Use channel width to gauge volatility
Target Setting:
Opposite zone acts as first profit target, Zone breaks signal potential trend continuation
Confluence:
Works well with volume analysis,Combine with RSI/MACD for confirmation,
Use multiple timeframes for stronger signals
Best Practices
✅ DO:
Adjust swing length based on timeframe (lower for intraday, higher for daily+)
Reduce minimum touches (2-3) for volatile markets
Increase price margin for choppy conditions
Wait for candle close confirmation on zone breaks
❌ DON'T:
Trade zones in isolation without other confirmation
Use overly tight parameters that generate false signals
Ignore the broader trend context
Chase price after zone breaks without pullback
Tips for Optimization
Scalping (1-5 min): Swing Length: 3-5, Min Touches: 2
Day Trading (15-60 min): Swing Length: 5-10, Min Touches: 3
Swing Trading (4H-Daily): Swing Length: 10-20, Min Touches: 3-4
Position Trading (Daily-Weekly): Swing Length: 15-25, Min Touches: 4-5
Alert Conditions
Zone Contact: Price touches resistance or support zone
Set up notifications for real-time trading opportunities
Disclaimer: This indicator is for educational and informational purposes only. It should not be considered financial advice. Always perform your own analysis and risk management before trading.

Trend Prediction Meter [PointAlgo]The Trend Prediction Meter & Levels is a composite market-bias and volatility visualization tool designed to summarize trend strength, momentum, price positioning, and volatility into a single normalized score.
It provides a structured framework to interpret directional bias and probable price expansion zones during active market conditions.
Concept Overview
Markets often reflect multiple conditions simultaneously—trend direction, momentum strength, price location within a range, and volatility.
This indicator combines these elements into a unified Bullish Score (0–100), displayed as a meter and supported by projected ATR-based levels.
Rather than focusing on a single signal, the script aims to present context about current market conditions.
Bullish Score Composition (0–100)
The meter represents a weighted blend of multiple market factors:
1. Trend Strength (EMA Structure)
Uses a fast and slow EMA to assess directional bias.
The distance between EMAs is normalized into a trend strength score.
Strong separation indicates directional conviction; compression suggests balance.
2. Momentum Strength (RSI Blend)
Combines a short-term and mid-term RSI.
Helps capture both immediate momentum and broader directional stability.
Higher readings indicate sustained bullish pressure, lower readings indicate bearish pressure.
3. Position Within Recent Range
Measures where price is trading relative to its recent high–low range.
Values near the top of the range reflect strength; values near the bottom reflect weakness.
Mid-range positioning indicates equilibrium.
4. Volume Participation
Compares current volume against its recent average.
Acts as a minor confidence modifier rather than a primary driver.
Each component is normalized and combined using fixed weights to produce a final Bullish Score between 0 and 100.
Bias Classification
The Bullish Score is translated into descriptive market states:
Extreme Bullish
Very Bullish
Bullish
Neutral
Bearish
Very Bearish
These labels describe current bias, not future certainty.
Meter Visualization
The meter plot dynamically changes color based on the score range.
A dashed midline at 50 represents balance.
Background shading highlights strong bullish or bearish dominance zones.
Crossovers of the 50-level indicate shifts in directional control.
ATR-Based Projection Levels:
To provide volatility context, the indicator calculates ATR-based upside and downside reference levels:
Two potential expansion levels (TP1 and TP2) are projected above and below price.
The distance of these levels adapts based on current bias strength.
These levels are contextual reference zones, not fixed targets.
Prediction Dashboard
An optional side table summarizes key readings at the most recent bar:
Symbol
Current bias label
Bullish Score
Current price
ATR value
Upside and downside projection levels
Directional comment (Upside favoured / Downside favoured / Balanced)
This dashboard is designed to provide a quick structural overview without requiring manual calculation.
Signals & Alerts
Built-in alerts are available for:
Bullish bias conditions
Bearish bias conditions
Bullish Score crossing above 50
Bullish Score crossing below 50
Alerts are informational and reflect internal state changes only.
Customization:
Users can adjust:
RSI lengths
EMA lengths
Range lookback period
ATR parameters
Display options for the meter and dashboard
This allows adaptation across different instruments and timeframes.
Usage Notes
Best suited for analytical interpretation rather than standalone decision-making.
Designed to complement price action, structure, or other indicators.
Works across multiple markets where volume and volatility data are available.
Disclaimer :
This indicator is intended for educational and analytical purposes only.
It does not provide investment, trading, or financial advice.
All signals and levels should be validated with independent analysis and appropriate risk management.

Trend Step Channel [BigBeluga]🔵 OVERVIEW
Trend Step Channel identifies directional bias by forming a dynamic volatility-based step channel. It detects trend shifts when candle lows close above the upper band (bullish) or when candle highs drop below the lower band (bearish). A step-style midline tracks the trend evolution, while an integrated dashboard shows price positioning percentages across multiple timeframes.
🔵 CONCEPTS
ATR-Based Channel — The indicator constructs upper and lower channel boundaries using ATR distance around a single adaptive trend line, providing automatic scaling with volatility.
Trend Direction Logic —
• Low above upper band → uptrend confirmation.
• High below lower band → downtrend confirmation.
Step Trend Line — A reactive midline that locks onto price swings, stepping upward or downward as new trend confirmations occur.
Channel Width — Defines the total volatility range around the midline; a wider channel smooths market noise, while a narrower one reacts faster.
Price Position Ratio — Calculates the relative position of the close within the channel, from 0% (bottom) to 100% (top).
🔵 FEATURES
Volatility-Adaptive Channel — Expands and contracts dynamically to match market volatility, maintaining consistent distance scaling.
Configurable MA Source — Choose from SMA, EMA, SMMA, WMA, or VWMA as the base smoothing method.
Color-Coded Step Line —
• Green indicates an uptrend.
• Orange indicates a downtrend.
Channel Fill Visualization — Semi-transparent fills highlight active volatility zones for clear trend identification.
Price Position Label — Displays a “<” marker and percentage at the channel edge showing how far the current close is from the lower or upper band.
Multi-Timeframe Dashboard —
• Displays alignment across 1H–5H charts.
• Each cell shows an arrow (↑ / ↓) with price % positioning.
• Cell background color reflects bullish or bearish bias.
Real-Time Updating — The channel, midline, and dashboard refresh dynamically every bar for continuous feedback.
🔵 HOW TO USE
Trend Confirmation —
• Bullish trend forms when candle low closes above the upper band.
• Bearish trend forms when candle high closes below the lower band.
Trend Continuation — Maintain bias while the step line color remains consistent.
Volatility Breakouts — Sudden candle breaks outside the band suggest new directional strength.
Dashboard Alignment — Confirm trend consistency across multiple timeframes before entering trades.
Entry Planning — In uptrends, consider entries near the lower band; in downtrends, focus on upper-band rejections.
Price Position Insight — Use the % label to judge whether price is extended (near 100%) or compressed (near 0%) within the channel.
🔵 CONCLUSION
Trend Step Channel delivers a precise, volatility-driven view of trend structure using ATR-based boundaries and a step-line framework. The integrated dashboard, color-coded channel, and live positioning metrics give traders a complete picture of market direction, trend strength, and price location within evolving conditions.

Trend Following Volatility Trail*Script was previously removed by Moderators at 1.8k boosts* - This was out of my control. This script was very popular and seemed to help a lot of traders. I am re uploading to help the community!
Trend Following Volatility Trail
The Trend Following Volatility Trail is a dynamic trend-following tool that adapts its stop, bias, and zones to real-time volatility and trend strength. Instead of using static ATR multiples like a normal Supertrend or Chandelier Stop, it continuously adjusts itself based on how stretched the market is and how persistent the trend has been. This indicator is based on volatility weighted EMAC
This makes the system far more reactive during momentum phases and more conservative during consolidation, helping avoid fake flips and late entries.
How It Works
The indicator builds an adaptive trail around a smoothed price basis:
– It starts with a short EMA as the “core trend line.”
– It measures volatility expansion versus normal volatility.
– It measures trend persistence by reading whether price has been rising or falling consistently.
– These two components combine to adjust the ATR multiplier dynamically.
As volatility expands or the trend becomes more persistent, the bands widen.
When volatility compresses or the trend weakens, the bands tighten.
These adaptive bands form the foundation of the trailing system.
Bull & Bear State Logic
The tool constantly tracks whether price is above or below the adaptive trail:
Price above the upper trail → Bullish regime
Price below the lower trail → Bearish regime
But instead of flipping immediately, it waits for confirmation bars to avoid noise.
This greatly reduces whipsaws and keeps the focus on sustained moves.
Once a new regime is confirmed:
– A coloured cloud appears (bull or bear)
– A label marks the flip point
– Alerts can be triggered automatically
Best Uses
Identifying regime shifts early
Riding sustained trends with confidence
Avoiding choppy markets by requiring confirmation
Using the adaptive cloud as a directional bias layer


Trend Strength Index Long Strategy📈 Trend Strength Index Long Strategy
This strategy combines the Trend Strength Index (TSI) with a Volume-Weighted Moving Average (VWMA) to identify high-probability long entries based on trend momentum and price confirmation.
📊 TSI Calculation : Measures correlation between price and time (bar index) over a user-defined period. Strong TSI values indicate trend momentum.
📏 VWMA Filter : Confirms bullish bias when price is above the VWMA.
🚀 Entry Condition : Long position is triggered when TSI crosses above -0.65 and price is above VWMA.
🔒 Exit Condition : Position is closed when TSI crosses above 0.65.
🎨 Visuals : Gradient fills highlight bullish and bearish zones. VWMA is plotted for trend context.
🧮 TSI Length: Adjustable (default 14)
📐 VWMA Length: Adjustable (default 55)
💸 Commission: 0.1% per trade
📊 Position Size: 75% of equity
⚙️ Slippage: 10 ticks
✅ Best used in trending markets with steady momentum.
⚠️ Avoid in choppy or range-bound conditions.

Trend Range Detector (Zeiierman)█ Overview
Trend Range Detector (Zeiierman) is a market structure tool that identifies and tracks periods of price compression by forming adaptive range boxes based on volatility and price movement. When prices remain stable within a defined band, the script dynamically draws a range box; when prices break out of that structure, the box highlights the breakout in real-time.
By combining a volatility-based envelope with a custom weighted centerline, this tool filters out noise and isolates truly stable zones — providing a clean framework for traders who focus on accumulation, distribution, breakout anticipation, and reversion opportunities.
Whether you're range trading, spotting trend consolidations, or looking for volatility contractions before major moves, the Trend Range Detector gives you a mathematically adaptive, visually intuitive structure that maps the heartbeat of the market.
█ How It Works
⚪ Range Formation Engine
The core of this indicator revolves around two conditions:
Distance Filter: The maximum distance between all recent closes and a dynamic centerline must remain within a volatility envelope.
Volatility Envelope: Based on an ATR(2000) multiplied by a user-defined factor to account for broader market volatility trends.
If both conditions are satisfied over the most recent length bars, a range box is drawn to visually anchor the zone.
⚪ Dynamic Breakout Coloring
When price breaks out of the top or bottom of the active range box, the box color shifts in real-time:
Blue Boxes represent areas where price has remained within a defined volatility envelope over a sustained number of bars. These zones reflect stable, low-volatility periods, often associated with consolidation, equilibrium, or market indecision.
Green Boxes for bullish breakouts.
Red Boxes for bearish breakdowns.
This allows traders to visually spot transitions from consolidation to expansion phases without relying on lagging signals.
█ Why Use a Weighted Close Instead of SMA?
A standard Simple Moving Average (SMA) treats all past closes equally, which works well in theory, but not in dynamic, fast-shifting markets. In this script, we replace the traditional SMA with a speed-weighted average that reflects how aggressively the market has moved bar-to-bar.
⚪ Here's why it matters:
Bars with higher momentum (larger price differences between closes) are given more weight.
Slow, sideways candles (typical in noise or low volume) contribute less to the calculated centerline.
This method creates a more accurate snapshot of market behavior, especially during volatile phases. As a result, the indicator adapts to market conditions more effectively, helping traders identify real consolidation zones, not just average lines distorted by flat bars or noise.
█ How to Use
⚪ Range Detection
Boxes form only when price remains consistently close to the speed-weighted mean.
Helps identify sideways zones, consolidations, and low-volatility structures where price is “charging up.”
⚪ Breakout Confirmation
Once price exits the top or bottom boundary, the box immediately highlights the direction of the break.
Use this signal in conjunction with your own momentum, volume, or trend filters for higher-confidence trades.
█ Settings
Minimum Range Length: Number of candles required for a valid range to form.
Range Width Multiplier: Adjusts the envelope around the weighted average using ATR(2000).
Highlight Box Breaks: Enables real-time coloring of breakouts and breakdowns for immediate visual feedback.
-----------------
Disclaimer
The content provided in my scripts, indicators, ideas, algorithms, and systems is for educational and informational purposes only. It does not constitute financial advice, investment recommendations, or a solicitation to buy or sell any financial instruments. I will not accept liability for any loss or damage, including without limitation any loss of profit, which may arise directly or indirectly from the use of or reliance on such information.
All investments involve risk, and the past performance of a security, industry, sector, market, financial product, trading strategy, backtest, or individual's trading does not guarantee future results or returns. Investors are fully responsible for any investment decisions they make. Such decisions should be based solely on an evaluation of their financial circumstances, investment objectives, risk tolerance, and liquidity needs.

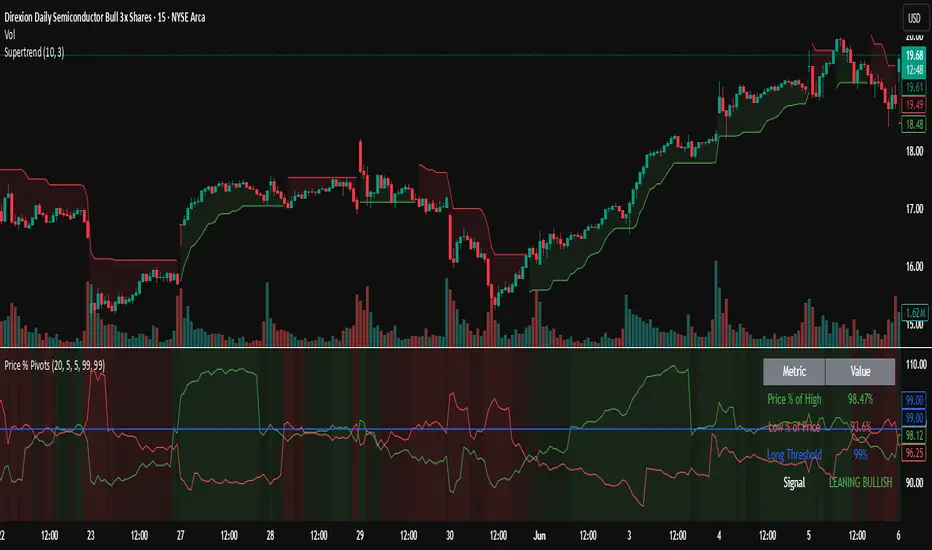
Trending Indicator: Price % of Pivots# Price % of Pivots Indicator
## Overview
A trend-following indicator that measures current price position relative to recent pivot highs and lows as percentages, providing normalized trend analysis across all timeframes and instruments.
## Key Features
- **Real-time trend table** with live signal updates (Strong Bullish/Bearish, Leaning Bullish/Bearish, Neutral)
- **Dual percentage tracking**: Price % of high pivot and low pivot % of current price
- **Universal compatibility** - works on any timeframe and asset class
- **Faster than some other trend indicators** - catches trend changes earlier with less lag
## Trading Signals
- **Bullish bias**: When price % of high pivot > low pivot % of price
- **Bearish bias**: When low pivot % of price > price % of high pivot
- **Customizable thresholds** (default 99%) with alert system
- **Color-coded backgrounds** for immediate visual confirmation
## Configuration
- Adjustable pivot lookback period (5-100 bars)
- Customizable left/right bars for pivot confirmation
- Threshold settings from 50-110% with 0.5% increments
- Full color customization for all elements
## Advantages
- **Speed**: More responsive than traditional ATR-based indicators
- **Clarity**: Clean percentage-based display with professional info table
- **Alerts**: Multiple conditions for automated and manual trading
- **Versatility**: Effective for day trading, swing trading, and multi-timeframe analysis
Perfect for traders seeking a fast, reliable trend indicator that works consistently across all markets and timeframes.
Trend Classifier [ChartPrime]Trend Classifier
This is a multi-level trend classification tool that detects bullish, bearish, and ranging conditions using an adaptive smoothing method. It highlights trend strength through color-coded candles and layered bands, making it easy to interpret market momentum visually.
⯁ KEY FEATURES
Classifies trend strength using 3 bullish and 3 bearish levels relative to an adaptive trend line.
Neutral (range) zones are marked when price stays between key bands, often signaling low volatility or consolidation.
Automatically filters band visibility based on current trend direction:
In uptrends, only levels below the price are displayed.
In downtrends, only levels above the price are shown.
Color-coded candles:
Aqua candles for bullish conditions.
Red candles for bearish conditions.
Orange candles during neutral or ranging conditions.
Includes a trend direction change marker (diamond), plotted when a shift in trend is detected.
Plots a central smoothed trend line to anchor the trend bands dynamically.
Displays a trend strength dashboard in the top-right corner with real-time bull and bear scores (0 to 3).
Labels with arrows (▲/▼) show current trend direction and strength on the chart.
⯁ HOW TO USE
Use bull and bear levels (1–3) to assess the momentum of the current trend.
When bull = 0 and bear = 0 , market is considered ranging or consolidating – consider fading or waiting for breakout confirmation.
Trend bands can be used as dynamic support/resistance during trending phases.
Monitor the trend change diamonds to spot potential early reversals.
Combine with volume or oscillator tools for confirmation of strength shifts.
⯁ CONCLUSION
Trend Classifier helps traders stay aligned with the dominant trend while visually breaking down market momentum into levels. Its clean color-coded design and strength dashboard make it ideal for both trend following and range trading strategies.

Trend Strength MeterThe Trend Strength Meter (TSM) is a powerful and versatile indicator designed to help traders identify market trends, measure their strength, and detect potential reversals with ease. This indicator combines the power of moving averages, divergence detection, and a clean, customizable dashboard to provide actionable insights for traders of all levels.
How It Works
Trend Strength Calculation:
1. The TSM calculates the trend strength using the difference between two Exponential Moving Averages (EMAs): a fast EMA (default: 20) and a slow EMA (default: 50).
2. The difference is expressed as a percentage of the slow EMA, providing a clear measure of the trend's strength and direction.
Histogram Visualization:
1. A color-coded histogram visually represents the trend strength:
Green: Bullish trend
Red: Bearish trend
Gray: Neutral or no significant trend
2. A smoothed trend strength line (SMA of the trend strength) is also plotted for better clarity.
Divergence Detection:
1. The indicator detects bullish and bearish divergences using the RSI (Relative Strength Index) and price action.
2. Bullish Divergence: Price makes a lower low, but RSI makes a higher low, signaling potential upward momentum.
3. Bearish Divergence: Price makes a higher high, but RSI makes a lower high, signaling potential downward momentum.
=> Divergences are marked with arrows on the chart:
Green Arrow: Bullish divergence
Red Arrow: Bearish divergence
Dashboard:
1. A clean and informative dashboard displays key information:
Trend Strength Value: The current strength of the trend
Trend Direction: Bullish, Bearish, or Neutral
Last Signal: Buy, Sell, or None (based on divergence signals)
The dashboard is fully customizable and can be positioned anywhere on the chart (e.g., top-right, bottom-left, center, etc.).
Key Features
1. Trend Strength Measurement: Quickly identify the strength and direction of the trend.
2. Divergence Detection: Spot potential reversals before they occur with bullish and bearish divergence signals.
3. Customizable Dashboard: Move the dashboard to your preferred location on the chart for better visibility.
4. User-Friendly Design: Clean visuals and intuitive color coding make it easy to interpret market conditions.
5. Actionable Signals: Provides clear Buy/Sell signals based on divergence, helping traders make informed decisions.
How to Use
1. Trend Confirmation:
Use the histogram and trend strength value to confirm the current market trend.
Green bars indicate a bullish trend, while red bars indicate a bearish trend.
2. Divergence Signals:
Look for divergence arrows (green for bullish, red for bearish) to anticipate potential reversals.
Combine divergence signals with other technical analysis tools for higher accuracy.
3. Dashboard Insights:
Monitor the dashboard for real-time updates on trend strength, direction, and the latest signal.
Use the "Last Signal" (Buy/Sell) to validate your trading decisions.
4. Custom Settings:
Adjust the EMA lengths and divergence lookback period to suit your trading style and timeframe.
Position the dashboard anywhere on the chart for convenience.
Best Practices
1. Use the TSM in conjunction with other indicators or price action analysis for confirmation.
2. Test the indicator on different timeframes to find the one that works best for your strategy.
3. Always practice proper risk management when trading.
Disclaimer
This indicator is a tool to assist in technical analysis and should not be used as a standalone trading strategy. Past performance is not indicative of future results. Always conduct your own research and consult with a financial advisor before making trading decisions.

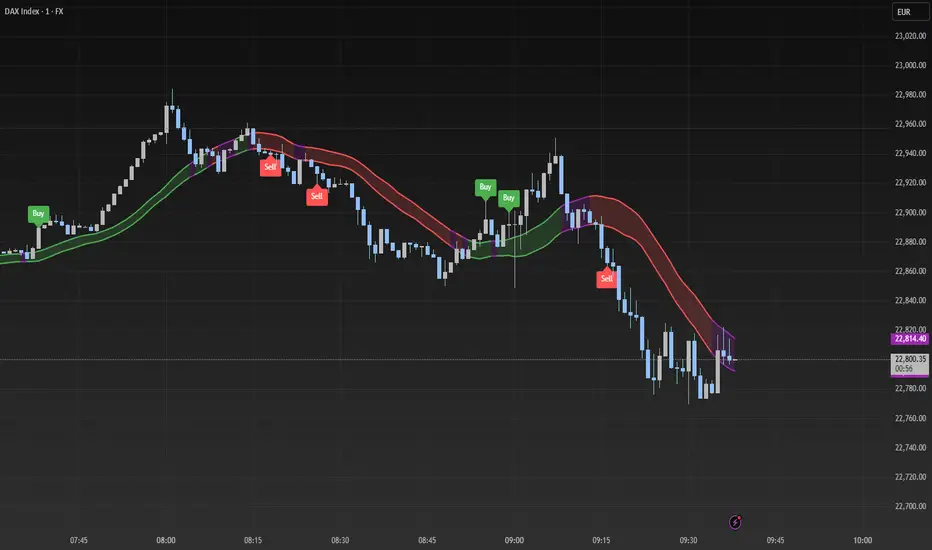
Trend Catcher SwiftEdgeTrend Catcher SwiftEdge
Overview
The Trend Catcher SwiftEdge is a simple yet effective tool designed to help traders identify potential trend directions using two Simple Moving Averages (SMAs). It plots two SMAs based on the high and low prices of the chart, visually highlights trend conditions, and provides buy/sell labels to assist with trade entries. This indicator is best used as part of a broader trading strategy and should not be relied upon as a standalone signal generator.
How It Works
Two SMAs: The indicator calculates two SMAs: one based on the lowest price (Low) and one based on the highest price (High) over a user-defined period (default: 20).
Dynamic Colors:
Green: When the price is above both SMAs (indicating a potential uptrend).
Red: When the price is below both SMAs (indicating a potential downtrend).
Purple: When the price is between the SMAs (indicating consolidation).
The SMAs and the background between them change color dynamically to reflect the current trend condition.
Buy/Sell Labels:
A "Buy" label appears when an entire candlestick (including its low) crosses above both SMAs, marking the start of a potential uptrend.
A "Sell" label appears when an entire candlestick (including its high) crosses below both SMAs, marking the start of a potential downtrend.
To reduce noise, only one label is shown per trend direction. The indicator resets when the price enters the consolidation zone (purple), allowing for a new signal when the next trend begins.
Settings
SMA Length: Adjust the period of the SMAs (default: 20). A longer period smooths the SMAs and focuses on larger trends, while a shorter period makes the indicator more sensitive to price changes.
How to Use
Add the indicator to your chart.
Look for "Buy" labels to consider potential long entries during uptrends (green zone).
Look for "Sell" labels to consider potential short entries during downtrends (red zone).
Use the purple consolidation zone to prepare for potential breakouts.
Always combine this indicator with other forms of analysis (e.g., support/resistance, volume, or other indicators) to confirm signals.
Important Notes
This indicator is a tool to assist with identifying trend directions and potential entry points. It does not guarantee profits and should be used as part of a comprehensive trading strategy.
False signals can occur, especially in choppy or ranging markets. Consider using additional filters or confirmations to improve reliability.
Backtest the indicator on your chosen market and timeframe to understand its behavior before using it in live trading.
Feedback
If you have suggestions or feedback, feel free to leave a comment. Happy trading!
Trend Detector [victhoreb]Trend Detector is a streamlined indicator that uses the Pearson correlation coefficient between the average price and time to determine market trends. It measures how closely price movement follows the progression of time over a user-defined period, providing a clear gauge of trend direction on a scale from -1 to 1.
How It Works:
The indicator calculates the correlation between price and time. A positive correlation means that as time advances, the price generally rises—signaling an uptrend. Conversely, a negative correlation indicates that the price tends to fall over time, highlighting a downtrend.
With its simple yet effective approach, Trend Detector offers traders an immediate visual and quantitative insight into prevailing market trends.

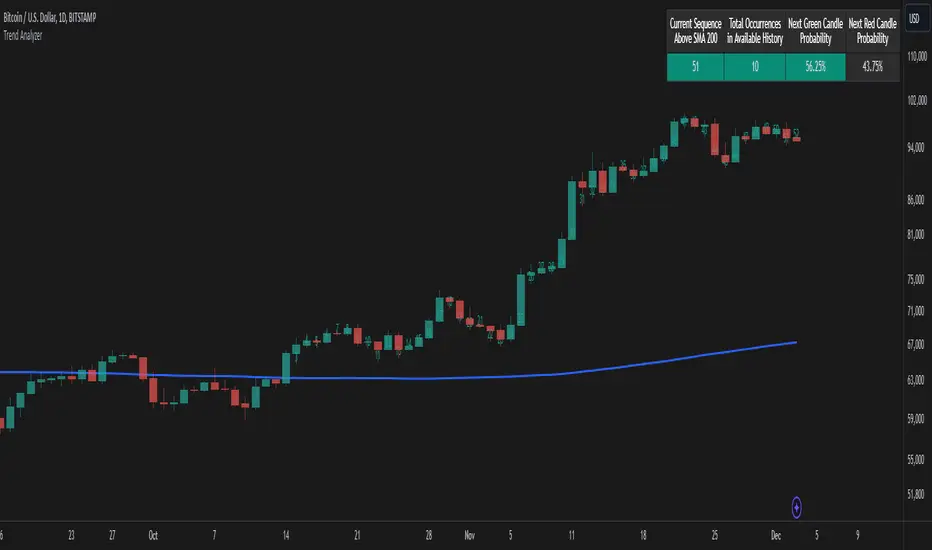
Trend AnalyzerThe Trend Analyzer is designed to help traders identify and analyze market trends. Here's a simple explanation of its logic:
Main Features
Customizable Moving Average: The indicator plots a moving average on the chart. Users can choose from various types (SMA, EMA, WMA, VWMA, HMA, SMMA, TMA) and set the period. This flexibility allows traders to adapt the indicator to different trading styles and timeframes.
Trend Detection: It determines whether the current price is above or below the moving average, providing a clear visual representation of the current trend direction.
Sequence Counter: The indicator counts consecutive candles above or below the moving average. This feature helps traders identify trend strength and persistence, which can be crucial for timing entries and exits.
Statistical Analysis: It calculates probabilities for the next candle's direction based on historical data. This unique feature gives traders a statistical edge in predicting short-term price movements.
Visual Candle Counter: An optional feature that displays the number of consecutive candles above or below the moving average directly on the chart, enhancing visual analysis.
How It Works
The indicator continuously tracks the position of price relative to the chosen moving average.
It maintains a count of how many candles in a row have been above or below the moving average.
For each sequence length, it records historical data on how often the trend continued or reversed in the past.
This historical data is used to calculate probabilities for the next candle's direction, providing a statistical insight into potential price movements.
The indicator displays this information directly on the chart, allowing for quick and easy interpretation.
Practical Applications
Trend Confirmation: Use the indicator to confirm the strength and direction of current trends.
Entry and Exit Signals: The sequence counter and probability calculations can help in timing trades more effectively.
Risk Management: Understanding the statistical likelihood of trend continuation can aid in setting appropriate stop-loss and take-profit levels.
Market Analysis: The indicator provides valuable insights into market behavior and can be used for both short-term and long-term analysis.
While the Trend Analyzer provides valuable insights based on historical data and statistical analysis, it's important to remember that past performance does not guarantee future results. The financial markets are complex and influenced by numerous factors. This indicator should be used as part of a comprehensive trading strategy and not as a sole decision-making tool. Always practice proper risk management and consider seeking advice from financial professionals before making investment decisions.
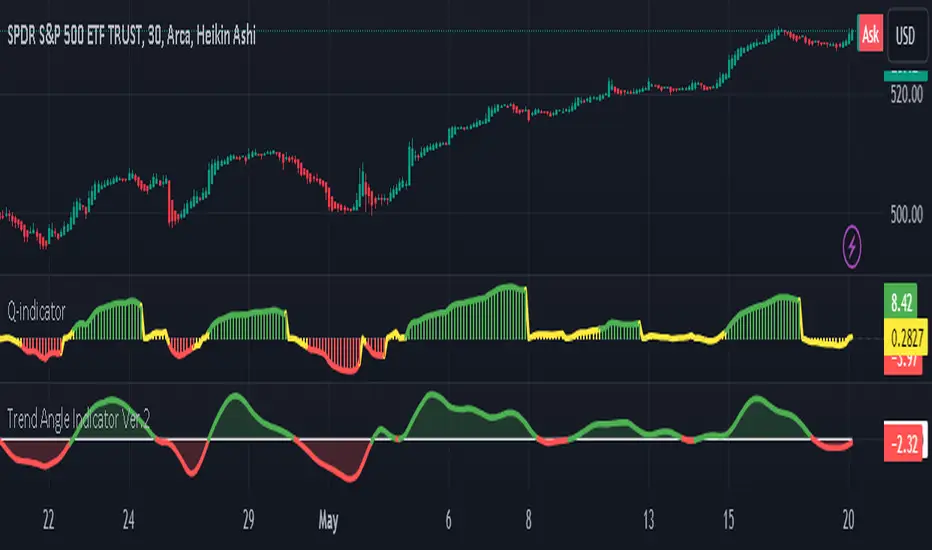
Trend Angle IndicatorTrend Angle Indicator
Description
The Trend Angle Indicator is designed to measure the strength of a trend by calculating the angle of the trend.
Specifically, it computes the angle of a Simple Moving Average (SMA) over a specified length and then applies
an Exponential Moving Average (EMA) to the angle for smoothing.
This approach provides a clear indication of the trend's direction and intensity.
It also includes customizable alerts for significant changes in the trend angle and zero-line crossings,
making it a robust tool for traders seeking to gauge market momentum.
Key Features
- **Trend Angle Calculation**: Measures the trend's angle, providing insights into trend direction and strength.
- **SMA and EMA**: Uses SMA for the base calculation and EMA for smoothening the angle values.
- **Visual Trend Indication**: Visually indicates uptrends and downtrends with customizable colors - red and green.
- **Alerts**: Configurable alerts for significant changes in trend angle and zero-line crossings.
Calculation Methodology
1. **Simple Moving Average (SMA):**
- The script calculates the SMA of the close price over a user-defined `input_length`.
2. **Angle Calculation:**
- The height of the trend is calculated by subtracting the SMA value from the SMA value `input_length` bars ago. A higher angle value indicates a stronger trend.
- The angle in degrees is obtained using the arctangent function: \
3. **Exponential Moving Average (EMA):**
- Applies an EMA to the calculated angle to smooth out the values based on a user-defined `input_ma_length`.
4. **Trend Detection:**
The color of the angle plot and filled area provide a quick visual representation of the current trend direction
- The trend angle changes are monitored and visualized with color-coded plots.
- Uptrend: Angle >= 0 uses `upColor` (green).
- Downtrend: Angle < 0 uses `downColor` (red).
#### Using the Indicator
1. **Adding the Indicator:**
- Add the indicator to your TradingView chart by selecting it from the Pine Script library or by pasting the script into the Pine Script editor.
2. **Inputs:**
- **Length**: Defines the period for the SMA calculation.
- **MA Length**: Sets the period for the EMA smoothing.
- **Angle Change Threshold (degrees)**: Defines the threshold for significant angle change alerts.
- **Color Candles**: Optionally colorizes the price candles based on the angle's trend direction.
3. **Customizing Plots:**
- **Angle Plot**: Displays the EMA of the trend angle. The color changes based on whether the trend is up or down.
- **Zero Line**: A horizontal line at zero to easily visualize crossings that signify a change in trend direction.
- **Fill Color**: Fills the area above/below the zero line with colors representing the direction of the trend.
4. **Setting Alerts:**
- **Cross Above Zero**: Triggers an alert when the trend angle crosses above zero, indicating a potential start of an uptrend.
- **Cross Below Zero**: Triggers an alert when the trend angle crosses below zero, indicating a potential start of a downtrend.
- **Significant Angle Change**: Alerts when the angle change exceeds the user-defined threshold, highlighting significant trend changes.
#### Example Usage
To use and customize the Trend Angle Indicator on your chart:
1. **Add to Chart**: Apply the indicator from the TradingView library or by pasting the script into the Pine Script editor.
2. **Configure Inputs**:
- Adjust the `Length` to set the period for the SMA.
- Set the `MA Length` for the EMA smoothing.
- Define the `Angle Change Threshold` for receiving alerts on significant changes.
3. **Display Customization**:
- Enable `Color Candles` to have the price candles reflect the trend direction.
4. **Set Alerts**:
- Use the alert conditions provided to get notified about critical events like zero line crossings or significant angle changes.
Trend Regression Kernel [IkkeOmar]Kernel by @jdehorty huge shoutout to him! This is only an idea for how I use it when trading
All credit for the kernel goes to him, I did not make the kernel! I don't know how to make it more clear.
I use this to assist with top-down analysis.
timeframe I want to trade : timeframe to analyse with white noise and kernel:
1m : 1H
5m : 2H
15m : 4H
1H : 1D
In the chart you see that I have the 1H open, I use the white noise at a "lower setting length" (55 in this case), I change the source of to be the kernel on the higher timeframe. When a new trend is detected by the White noise I wait for price to retest the kernel before building a position. Another case described below:
Here i use the adaptive MCVF (I have made this free for everyone on TradingView) to buy when price is below the kernel while the trend for the white noise is bullish .
Notice that the Kernel is set on the 4H timeframe! The source of the white noise is the kernel!
Here is an example in a bearish trend:
Notice, I am on the 5m chart, kernel uses the 2H chart and the source of the white noise is the kernel.
I use the adaptive MCVF to help me get entries AFTER the first touch of the kernel.
Mandatory code explanation, with respect to the house rules:
Input settings:
Input Settings:
The script provides various input parameters to customize the indicator:
src: The source of price data, defaulted to closing prices.
h, r, x_0: Parameters for Kernel 1.
h2, r2, x_2: Parameters for Kernel 2.
Kernel Regression Functions:
Two functions kernel_regression1 and kernel_regression2 are defined to perform kernel regression calculations.
These functions estimate the trend using the Nadaraya-Watson kernel non-parametric regression method.
They take the source data (_src), the size of the data series (_size), and the lookback window (_h) as inputs.
They iterate over the data series and calculate the weighted sum of the values based on the specified kernel parameters.
The result is divided by the cumulative weight to obtain the estimated value.
Estimations:
The kernel_regression1 and kernel_regression2 functions are called with the respective parameters to estimate trends (yhat1 and yhat2).
Buy and Sell Signals:
Buy and sell signals are generated based on crossover and crossunder conditions between the two trend estimates (yhat1 and yhat2).
buySignal is true when yhat1 crosses above yhat2.
SellSignal is true when yhat1 crosses below yhat2.
Plotting:
The average of the two trend estimates (yhat1 and yhat2) is calculated and plotted.
The color of the plot is determined based on whether yhat1 is greater than yhat2, less than yhat2, or equal to yhat2.
Buy and sell signals are plotted using triangle shapes below and above bars, respectively.
Alerts:
Alert conditions are set based on buy and sell signals. Alerts are triggered when a crossover (long signal) or crossunder (short signal) occurs.
The alerts include information about the signal type, symbol, and price.
It's important to mention that the buy and sell signals from the indicator is very discretionary, I rarely use them, and if I do it's if they are in confluence with a correction i am biased towards or if it has confluence with some of my other systems.
The adaptive MCVF and White noise is free for everyone on TradingView, linked below:)
Huge shoutout to @jdehorty, original kernel below:

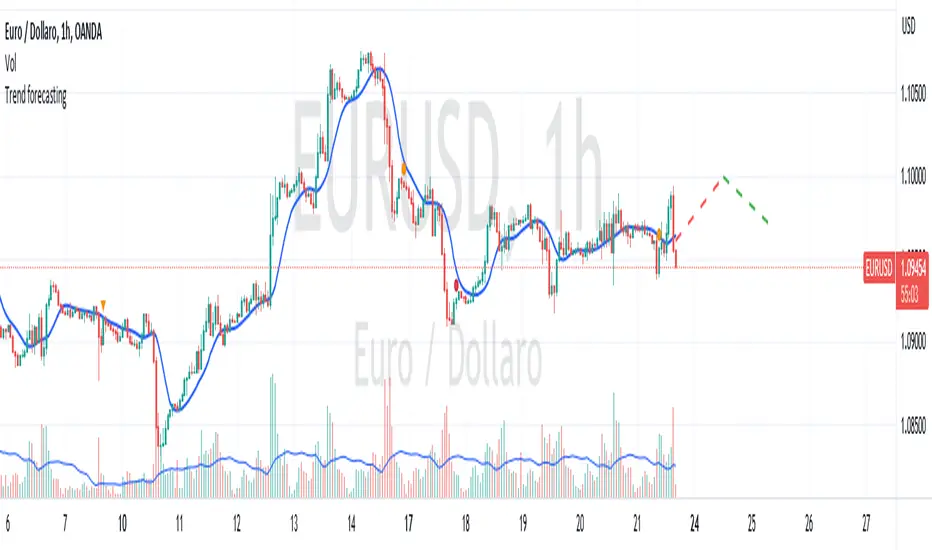
Trend forecasting by c00l75----------- ITALIANO -----------
Questo codice è uno script di previsione del trend creato solo a scopo didattico. Utilizza una media mobile esponenziale (EMA) e una media mobile di Hull (HMA) per calcolare il trend attuale e prevedere il trend futuro. Il codice utilizza anche una regressione lineare per calcolare il trend attuale e un fattore di smorzamento per regolare l’effetto della regressione lineare sulla previsione del trend. Infine il codice disegna due linee tratteggiate per mostrare la previsione del trend per i periodi futuri specificati dall’utente. Se ti piace l'idea mettimi un boost e lascia un commento!
----------- ENGLISH -----------
This code is a trend forecasting script created for educational purposes only. It uses an exponential moving average (EMA) and a Hull moving average (HMA) to calculate the current trend and forecast the future trend. The code also uses a linear regression to calculate the current trend and a damping factor to adjust the effect of the linear regression on the trend prediction. Finally, the code draws two dashed lines to show the trend prediction for future periods specified by the user. If you like the idea please put a boost and leave a comment!
Trend Follow SystemTrend following algorithm:
We take 1- 5 Fibonacci Ema values. 21, 34, 55, 89, 144
2- We normalize the changes of these values over time between 1-100.
3- We take the ema value of 1 length so that it does not follow a horizontal course after the normalization process.
4- In order not to experience too much change, we take the value of sma with a length of 5.
5-We think that when all values are 100, the trend is up, when all values are 0, the trend is down, otherwise the trend is horizontal.

Trend From Volume And Price (TFVAP)Indicator that indicates buying and selling times based on price and volume and who is imposed of the two (VAP).
It uses the trends of the Dow theory (primary: 365 days/1 year, secondary: 90 days/3 months and tertiary: 21 days/3 weeks) and the identification of Elliot waves, both impulse and correction, based on the Fibonacci retracements (23.61% , 38.2%, etc.).
- Purple line is the evolution in percentage of the price in the primary trend
- Blue line is the evolution in percentage of the volume in the primary trend
- White line is the evolution in percentage of the (volume % - price %) in the primary trend, if white line > 0
- Green triangleup is time of start to buy
- Green square is time of stop to buy
- Red triangledown is time of sell
To understand it better:
If the purple line goes up it indicates that the price is rising, if it goes down, that the price is down.
If the blue line is greater than 0 it indicates that there are more purchases than sales, if the blue line is less than 0 it indicates that there are more sales than purchases.
If the white line is greater than 0 there is a high volume of purchases or low sales for the price that there is, it is likely that the price will rise.
If the white line is less than 0 there is a low volume of purchases or high sales for the price that there is, it is likely that the price will go down.
PD: Ignore the chart drawings, the indicator script is only represented at the bottom

Trending/RangingThis script is a useful tool to use to identify the current market. It includes three other indicators:
1. ATR (combined with a SMA of the ATR)
2. ADX
3. RSI
It allows you to filter for when the market is trending vs. when the market is ranging by using any of the three indicators. You can also combine them to find extremely good trends to trade, or if you're a channel trader, identify when you wouldn't want to trade. This indicator also includes a time frame setting to allow you to ZOOM OUT and explore the long term trend of the security you are trading. I highly recommend using this indicator as a filter for when you enter a trade or not depending on the system you like to trade.

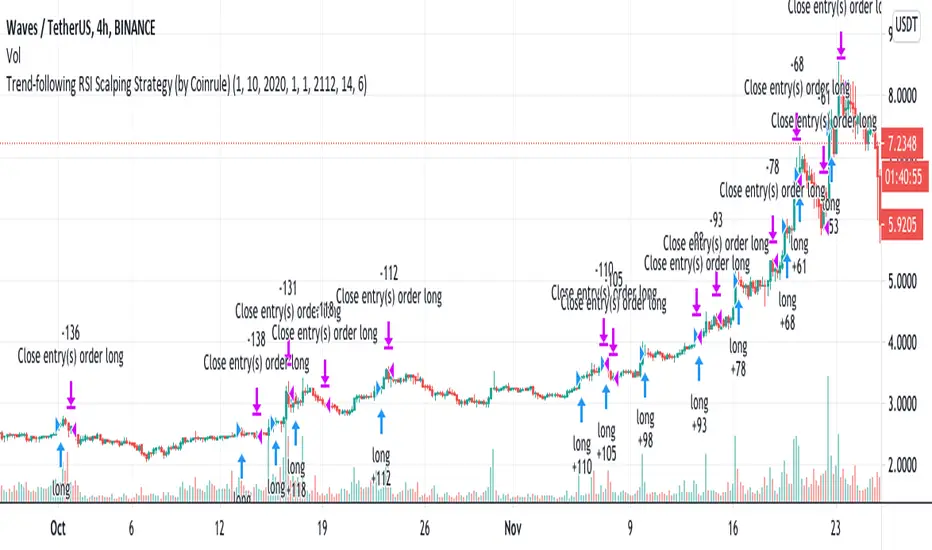
Trend-following RSI Strategy According to classical technical analysis, an RSI above 70 should signal overbought conditions and, thus, a sell-signal. Cryptocurrencies represent a whole new asset class, and they reshape the classical concepts of technical analysis. FOMO-buying can be very powerful, and coins can remain in overbought conditions enough to provide excellent opportunities for scalping trades on the upside.
Building a trend-following trading strategy based on the RSI, which is generally considered a contrarian indicator, may sound counter-intuitive. Over 200 backtests prove that this is a very interesting long-term setup.
The setup is optimized on a 4-hours time frame and trading cryptocurrencies versus USD or stable coins.
The strategy tries to catch coins on sustained uptrends to take advantage of further upside.
The strategy's buy-signal triggers when a coin has an RSI above 70 on a 4-hours time frame.
The strategy sells the coin if a profit of 6% is achieved. Alternatively, it closes the position if the RSI drops below 55, indicating a possible weakening of the trend.
The strategy assumes each order to trade 30% of the available capital. A trading fee of 0.1% is taken into account. The fee is aligned to the base fee applied on Binance, which is the largest cryptocurrency exchange.