Cerca negli script per "trend"

Trend tracking strategy of proprietary traders-RabbitThis is my latest strategy integration. It is a combination of trend tracking strategy and visualization trend. I believe it will bring you a clear trend discrimination and relatively reliable trading signal hints.
(Note: This strategy parameter has special parameter debugging and Optimization for BTC1h/BIANACE Heikin-ashi chart. It works best here. Other trade pairs or parameter versions of investment targets will be published specially if necessary.)
Statement of strategy concept:
The concept of strategy is trend tracking. The formation and continuation of trend is the product of speculation market for thousands of years. There are various strategies including CTA trend strategy, shock regression strategy, grid strategy, Martin strategy, Alpha strategy and so on. These strategies have their own merits just like different schools of Chinese knight-errant. Choose one, a master is not able to do hundreds of tricks, but to practice one trick thousands of times.
Every strategy has its own right and wrong. Trading is not violence, but a process of advancing, retreating, and making profits steadily. Therefore, the use of trend tracking strategy must overcome greed in human nature, profit and loss homology, dare to bear the shock of withdrawal in order to make a big profit when the real trend arrives. (Of course, this strategy has largely avoided filtering shocks, which will be explained later.)
Policy-building instructions:
Any trend tracking strategy can produce good results when there is a trend, so judging whether a trend strategy is good or bad depends on its withdrawal performance when it is shaking. This CTA trend tracking strategy uses Kauffman adaptive algorithm, fractal adaptive dimension, self-research algorithm and other tools, and has largely avoided filtering the signal in the shock without delay to follow the trend.
New version of the note:
The latest version adds the trend drawing of negativity, which can clearly distinguish the rising or falling or oscillating trend. However, the algorithm of strategy signal has no direct relationship with trend color. Trend color helps you to distinguish trend, and point signal helps you to refer to trade. This strategy is only a simple trading signal, risk control, warehouse management also need manual operation.
(Note: This strategy parameter has special parameter debugging and Optimization for BTC1h/BIANACE Heikin-ashi chart. It works best here. Other trade pairs or parameter versions of investment targets will be published specially if necessary.)
Good luck to all of you and a smooth deal.~

Heikin Ashi Trend StrategyStrategy Overview
Uses two timeframes to combine and identify trends for buying + selling securities. Works well on Bitcoin, currencies and indices.
Usage
This strategy should be used on 1-hour or 4-hour candles. Try it on 4-hour bitcoin for example.
Normal candles are fine but lead to more fakeouts. Heiken ashi candles lead to fewer trades and longer hodling of the trend but harder to enter/exit because Heiken Ashi candles are not true prices.
Strategy results
In my testing I ran the backtest from mid December onwards to capture the very tricky bear market that bitcoin has suffered. In this market it made huge profits from a $100k initial virtual account. Profit ratio is very high and trade success rate very high. However, a warning. In live trading it will flip BUY/SELL as the trend changes . This is a bug / flaw in the TradingView scripting engine in my opinion. It should not change past buy or sell signals. So to confirm the trend signal you want to see at least one block of the orange indicator complete or maybe use this indicator in combination with other.
Watch it for confirmation of keeping in existing trades and don't do everything it says as it says or bet the farm or you may rekt. Would recommend paper trading to understand the indicator + the signals.
My advice would be not to short an uptrend and not to long a downtrend. Some of the most profitable trades are with the trend and not the whips + saws.
Inputs
Trade Short? Default false. When true generates short trades not just close long
Backtest Start Year/Month/Day. Limits the backtest window to a certain timeframe to test tricky markets
Higher Timeframe: The length of the higher timeframe to monitor
Lower timeframe: The length of the lower timeframe to monitor
Show trades? When true shows the buy sell trades and performs the backtest. When false its just an indicator
Tips!
Any tips would be gratefully received. My addresses are as follows:
BTC: 35m8CyMQeWCezRUzQdaH3qEBpEyzSPAazS
ETH: 0xD09605A5D9ef9768e5AE17A74A5f0D42c97eC3a9
LTC: MV9yLEFoM5R8sgCHdeaehH3owjLni8FFz1

Trend Breakout & Ratchet Stop System [Market Filter]Description:
This strategy implements a robust trend-following system designed to capture momentum moves while strictly managing downside risk through a multi-stage "Ratchet" exit mechanism and broad market filters.
It is designed for swing traders who want to align individual stock entries with the overall market direction.
How it works:
1. Market Regime Filters (The "Safety Check") Before taking any position, the strategy checks the health of the broader market to avoid "catching falling knives."
Broad Market Filter: By default, it checks NASDAQ:QQQ (adjustable). If the benchmark is trading below its SMA 200, the strategy assumes a Bear Market and suppresses all new long entries.
Volatility Filter (VIX): Uses CBOE:VIX to gauge fear. If the VIX is above a specific threshold (Default: 32), entries are paused, and existing positions can optionally be closed to preserve capital.
2. Entry Logic Entries are based on Momentum and Trend confirmation. A position is opened if filters are clear AND one of the following occurs:
Golden Cross: SMA 25 crosses over SMA 50.
SMA Breakouts: A "Three-Bar-Break" logic confirms a breakout above the SMA 50, 100, or 200 (price must establish itself above the moving average).
3. The "Ratchet" Exit System The exit logic evolves as the trade progresses, tightening risk like a ratchet:
Stage 0 (Initial Risk): Starts with a standard percentage Stop Loss from the entry price.
Stage 1 (Breakeven/Lock): Once the price rises by Profit Step 1 (e.g., +10%), the Stop Loss jumps to a tighter level and locks there. This secures the initial move.
Stage 2 (Trailing Mode): If the price continues to rise to Profit Step 2 (e.g., +15%), the Stop Loss converts into a dynamic Trailing Stop relative to the Highest High. This allows the trade to run as long as the trend persists.
Additional Exits:
Dead Cross: Closes position if SMA 25 crosses under SMA 50.
VIX Panic: Emergency exit if volatility spikes above the threshold.
Settings & Customization:
SMAs: Adjustable lengths for all Moving Averages.
Filters: Toggle Market/VIX filters on/off and choose your benchmark ticker (e.g., SPY or QQQ).
Risk Management: Fully customizable percentages for the Ratchet steps (Initial SL, Stage 1 Trigger, Trailing distance).

MOMO – Imbalance Trend (SIMPLE BUY/SELL)MOMO – Imbalance Trend (SIMPLE BUY/SELL)
This strategy combines trend breaks, imbalance detection, and first-tap supply/demand entries to create a clean and disciplined trading model.
It automatically highlights imbalance candles, draws fresh zones, and waits for the first retest to deliver precise BUY and SELL signals.
Performance
On optimized settings, this strategy shows an estimated 57%–70% win-rate, depending on the asset and timeframe.
Actual performance may vary, but the model is built for consistency, discipline, and improved decision-making.
How it works
Detects trend structure shifts (BOS / Break of Trend)
Identifies displacement (imbalance) candles
Creates supply and demand zones from imbalance origin
Waits for first tap only (no second chances)
Confirms direction using trend logic
Generates clean BUY/SELL arrows
Automatic SL/TP based on user settings
Features
Clean BUY/SELL markers
Auto-drawn supply & demand zones
Trend break markers
Imbalance tags
Smart first-tap confirmation
Customizable stop loss & take profit
Works on crypto, gold, forex, indices
Best on M5–H1 for day trading
Note
This strategy is designed for day traders who want clarity, structure, and zero emotional trading.
Use it with discipline — and it will serve you well.
Good luck, soldier.

Trend Catcher and Mean ReversionPlease DM if you want to use this strategy.
it took long time to make this code profitable using 3 parameters only!
it allow you to:
1- Pyramid as you see fit.
2- allow option to use trend catching strategy ( while keeping mean reversion strategy)
3- Time filter to limit trading and exit at your preferred time.
4- it works for long, short or both positions.
5- has trailing tp as an option as well while keeping initial sl as hard stop
6- tp multiple (of stop loss) is optional
ongoing working for alerts and automation. More on that for subscribers only.
i will charge the minimum fee to utilize this code as we don't need your money but we need people to support our vision.

Mutanabby_AI | ATR+ | Trend-Following StrategyThis document presents the Mutanabby_AI | ATR+ Pine Script strategy, a systematic approach designed for trend identification and risk-managed position entry in financial markets. The strategy is engineered for long-only positions and integrates volatility-adjusted components to enhance signal robustness and trade management.
Strategic Design and Methodological Basis
The Mutanabby_AI | ATR+ strategy is constructed upon a foundation of established technical analysis principles, with a focus on objective signal generation and realistic trade execution.
Heikin Ashi for Trend Filtering: The core price data is processed via Heikin Ashi (HA) methodology to mitigate transient market noise and accentuate underlying trend direction. The script offers three distinct HA calculation modes, allowing for comparative analysis and validation:
Manual Calculation: Provides a transparent and deterministic computation of HA values.
ticker.heikinashi(): Utilizes TradingView's built-in function, employing confirmed historical bars to prevent repainting artifacts.
Regular Candles: Allows for direct comparison with standard OHLC price action.
This multi-methodological approach to trend smoothing is critical for robust signal generation.
Adaptive ATR Trailing Stop: A key component is the Average True Range (ATR)-based trailing stop. ATR serves as a dynamic measure of market volatility. The strategy incorporates user-defined parameters (
Key Value and ATR Period) to calibrate the sensitivity of this trailing stop, enabling adaptation to varying market volatility regimes. This mechanism is designed to provide a dynamic exit point, preserving capital and locking in gains as a trend progresses.
EMA Crossover for Signal Generation: Entry and exit signals are derived from the interaction between the Heikin Ashi derived price source and an Exponential Moving Average (EMA). A crossover event between these two components is utilized to objectively identify shifts in momentum, signaling potential long entry or exit points.
Rigorous Stop Loss Implementation: A critical feature for risk mitigation, the strategy includes an optional stop loss. This stop loss can be configured as a percentage or fixed point deviation from the entry price. Importantly, stop loss execution is based on real market prices, not the synthetic Heikin Ashi values. This design choice ensures that risk management is grounded in actual market liquidity and price levels, providing a more accurate representation of potential drawdowns during backtesting and live operation.
Backtesting Protocol: The strategy is configured for realistic backtesting, employing fill_orders_on_standard_ohlc=true to simulate order execution at standard OHLC prices. A configurable Date Filter is included to define specific historical periods for performance evaluation.
Data Visualization and Metrics: The script provides on-chart visual overlays for buy/sell signals, the ATR trailing stop, and the stop loss level. An integrated information table displays real-time strategy parameters, current position status, trend direction, and key price levels, facilitating immediate quantitative assessment.
Applicability
The Mutanabby_AI | ATR+ strategy is particularly suited for:
Cryptocurrency Markets: The inherent volatility of assets such as #Bitcoin and #Ethereum makes the ATR-based trailing stop a relevant tool for dynamic risk management.
Systematic Trend Following: Individuals employing systematic methodologies for trend capture will find the objective signal generation and rule-based execution aligned with their approach.
Pine Script Developers and Quants: The transparent code structure and emphasis on realistic backtesting provide a valuable framework for further analysis, modification, and integration into broader quantitative models.
Automated Trading Systems: The clear, deterministic entry and exit conditions facilitate integration into automated trading environments.
Implementation and Evaluation
To evaluate the Mutanabby_AI | ATR+ strategy, apply the script to your chosen chart on TradingView. Adjust the input parameters (Key Value, ATR Period, Heikin Ashi Method, Stop Loss Settings) to observe performance across various asset classes and timeframes. Comprehensive backtesting is recommended to assess the strategy's historical performance characteristics, including profitability, drawdown, and risk-adjusted returns.
I'd love to hear your thoughts, feedback, and any optimizations you discover! Drop a comment below, give it a like if you find it useful, and share your results.

FFI-Trend Rider ProFFI-Trend Rider Pro is a trend-following strategy designed to help traders make more structured and disciplined entries.
It uses a crossover between the 11 EMA and 21 SMA to detect potential trend shifts, while avoiding premature entries by checking how far the price is from the moving averages. If the price is extended, it waits for a pullback — just like professional traders do.
The indicator also includes:
Auto stoploss based on 21 SMA
Visual background colors based on RSI to help gauge trend strength
A built-in trade info table showing current trade type, entry price, stoploss, and trailing SL
Strategy-enabled functionality for easy backtesting
🔍 Ideal For:
Intraday & Swing Traders
Traders who want fewer, high-quality trades
Anyone looking to reduce emotional decision-making
⚠️ Disclaimer:
This script is for educational purposes only and does not constitute financial advice. Always do your own analysis before making any trading decisions. Past performance is not indicative of future results.


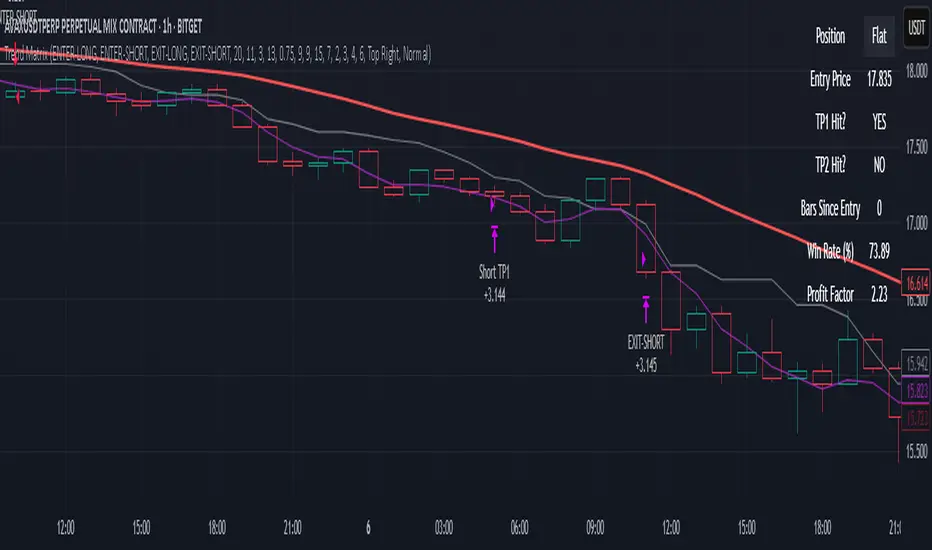
Trend MatrixFinal TradingView-Compliant Description for Trend Matrix
Trend Matrix is a precision-engineered trend-following strategy built for high-confidence entries and tactical trade management.
This strategy combines multiple non-repainting filters, each with a distinct role, to form a unified "trend matrix" that confirms directional bias, volume commitment, and momentum strength — all before entry is considered.
🔍 Core Components & Why They’re Used
🧠 Gaussian Filter (Custom)
A smoothed Gaussian-weighted moving average is used to detect trend direction changes. Unlike standard EMAs, this filter minimizes lag while retaining smooth transitions — ideal for confirming trend shifts without false reversals.
📈 RMI Trend Memory
A Relative Momentum Index is used to validate trend direction persistence. RMI's ability to filter out short-term oscillations makes it ideal for confirming whether a trend is still active.
📊 Gradient Filter (ZLEMA-based)
Measures the slope of a ZLEMA-smoothed close. If slope flips, it signals a potential trend weakness. This provides real-time confirmation for entry or exit bias.
📉 Volume Spike Detection
Confirms that breakouts or trend continuations are supported by volume commitment. Uses a dynamic SMA-based volume filter with a user-defined multiplier.
🟦 White Line (Bias Midpoint)
This structural component calculates the midpoint of the highest high and lowest low over a range — providing directional context and helping eliminate trades in consolidation zones.
🎯 Entry Conditions
Long entries require:
Gaussian trend flip to the upside
RMI > 50 (bullish memory)
Volume spike confirmation
Positive gradient (ZLEMA slope)
Price above White Line (bias filter)
Short entries use the inverse logic.
All entries enforce a cooldown bar to prevent same-bar reversals or whipsaw trades.
🎯 Exit Conditions
Take Profit 1: 50% of position at +2%
Take Profit 2: Remaining 50% at +4%
Early Exit on Trend Weakness:
Position closes fully if the trend weakens (RMI flip or gradient reversal)
📊 Dashboard + Performance Tracking
The built-in dashboard shows:
Current Position
Entry Price
TP1/TP2 Hit Status
Bars Since Entry
Win Rate (%)
Profit Factor
Useful for manual tracking or live trading review.
🌐 Multi-Exchange Bot Compatibility
Trend Matrix is built with universal trade alerts using customizable comment= fields. This makes it compatible with any exchange-connected bot platform such as:
WunderTrading
3Commas
Alertatron
Cornix
Or any webhook-based trading system
Alerts are sent using the {{strategy.order.comment}} placeholder, allowing you to route entries and exits through your preferred exchange account on Binance, Bybit, OKX, Kraken, and others.
🛠️ Customization
All components are modular:
TP1/TP2 levels
Gaussian length & sigma
Volume spike filter sensitivity
Gradient & White Line length
RMI settings
You can tailor the strategy for different assets or timeframes — optimized for crypto 1H, but works with stocks, FX, or lower timeframes with adjusted parameters.
✅ Final Notes
Trend Matrix is not just a mashup — it's a synchronized system of filters with clear roles, designed to maximize trade confidence and minimize noise. Every layer of confirmation serves a purpose, making this a highly adaptive trend-following tool for any market environment.
⚠️ Disclaimer (as required by TradingView)
This script is for educational purposes only and does not constitute financial advice. Use at your own risk. Always test strategies thoroughly before applying them in live trading environments. Past performance is not indicative of future results.
Adaptive Trend Flow Strategy with Filters for SPXThe Adaptive Trend Flow Strategy with Filters for SPX is a complete trading algorithm designed to identify traits and offer actionable alerts for the SPX index. This Pine Script approach leverages superior technical signs and user-described parameters to evolve to marketplace conditions and optimize performance.
Key Features and Functionality
Dynamic Trend Detection: Utilizes a dual EMA-based totally adaptive method for fashion calculation.
The script smooths volatility the usage of an EMA filter and adjusts sensitivity through the sensitivity enter. This allows for real-time adaptability to market fluctuations.
Trend Filters for Precision:
SMA Filter: A Simple Moving Average (SMA) guarantees that trades are achieved best while the rate aligns with the shifting average trend, minimizing false indicators.
MACD Filter: The Moving Average Convergence Divergence (MACD) adds some other layer of confirmation with the aid of requiring alignment among the MACD line and its sign line.
Signal Generation:
Long Signals: Triggered when the fashion transitions from bearish to bullish, with all filters confirming the pass.
Short Signals: Triggered while the trend shifts from bullish to bearish, imparting opportunities for final positions.
User Customization:
Adjustable parameters for EMAs, smoothing duration, and sensitivity make certain the strategy can adapt to numerous buying and selling patterns.
Enable or disable filters (SMA or MACD) based totally on particular market conditions or consumer possibilities.
Leverage and Position Sizing: Incorporates a leverage aspect for dynamic position sizing.
Automatically calculates the exchange length based on account fairness and the leverage element, making sure hazard control is in area.
Visual Enhancements: Plots adaptive fashion ranges (foundation, top, decrease) for actual-time insights into marketplace conditions.
Color-coded bars and heritage to visually represent bullish or bearish developments.
Custom labels indicating crossover and crossunder occasions for clean sign visualization.
Alerts and Automation: Configurable alerts for each lengthy and quick indicators, well matched with automated buying and selling structures like plugpine.Com.
JSON-based alert messages consist of account credentials, motion type, and calculated position length for seamless integration.
Backtesting and Realistic Assumptions: Includes practical slippage, commissions, and preliminary capital settings for backtesting accuracy.
Leverages excessive-frequency trade sampling to make certain strong strategy assessment.
How It Works
Trend Calculation: The method derives a principal trend basis with the aid of combining fast and gradual EMAs. It then uses marketplace volatility to calculate adaptive upper and decrease obstacles, creating a dynamic channel.
Filter Integration: SMA and MACD filters work in tandem with the fashion calculation to ensure that handiest excessive-probability signals are accomplished.
Signal Execution: Signals are generated whilst the charge breaches those dynamic tiers and aligns with the fashion and filters, ensuring sturdy change access situations.
How to Use
Setup: Apply the approach to SPX or other well suited indices.
Adjust person inputs, together with ATR length, EMA smoothing, and sensitivity, to align together with your buying and selling possibilities.
Enable or disable the SMA and MACD filters to test unique setups.
Alerts: Configure signals for computerized notifications or direct buying and selling execution through third-celebration systems.
Use the supplied JSON payload to integrate with broking APIs or automation tools.
Optimization:
Experiment with leverage, filter out settings, and sensitivity to find most effective configurations to your hazard tolerance and marketplace situations.
Considerations and Best Practices
Risk Management: Always backtest the method with realistic parameters, together with conservative leverage and commissions.
Market Suitability: While designed for SPX, this method can adapt to other gadgets by means of adjusting key parameters.
Limitations: The method is trend-following and can underperform in enormously risky or ranging markets. Regularly evaluate and modify parameters primarily based on recent market conduct.
If you have any questions please let me know - I'm here to help!

Trend-based Price Action StrategyThis is a strategy script that combines trend-based price action analysis with the Relative Strength Index (RSI) and Exponential Moving Averages (EMA) as trend filters. Here's a summary of the key components and logic:
Price Action Candlestick Patterns:
Bullish patterns: Engulfing candle and Morning Star.
Bearish patterns: Engulfing candle and Evening Star.
RSI Integration:
RSI is used to identify overbought and oversold conditions.
EMA Trend Filter:
Three EMAs with different periods: Fast , Medium and Slow.
Long trend condition occur when the fast EMA is above the medium and the medium is above the slow EMA.
Short trend condition occur when the slow EMA is above the medium and the medium is above the fast EMA.
Long entry conditions: RSI is oversold, RSI is decreasing, bullish candlestick pattern, and EMA trend filter conditions are met.
Short entry conditions: RSI is overbought, RSI is decreasing, bearish candlestick pattern, and EMA trend filter conditions are met.
Exit conditions:
Take profit or stop loss is reached.
Plotting:
Signals are plotted on the chart when entry conditions are met.
EMAs are plotted when the EMA trend filter is enabled.
This script aims to capture potential trend reversal points based on a combination of candlestick patterns, RSI, and EMA trend analysis.
Traders can use this script as a starting point for further customization or as a reference for developing their own trading strategies. It's important to note that past performance is not indicative of future results, and thorough testing and validation are recommended before deploying any trading strategy.

CC Trend strategy 2- Downtrend ShortTrend Strategy #2
Indicators:
1. EMA(s)
2. Fibonacci retracement with a mutable lookback period
Strategy:
1. Short Only
2. No preset Stop Loss/Take Profit
3. 0.01% commission
4. When in a profit and a closure above the 200ema, the position takes a profit.
5. The position is stopped When a closure over the (0.764) Fibonacci ratio occurs.
* NO IMMEDIATE RE-ENTRIES EVER!*
How to use it and what makes it unique:
This strategy will enter often and stop quickly. The goal with this strategy is to take losses often but catch the big move to the downside when it occurs through the Silvercross/Fibonacci combination. This is a unique strategy because it uses a programmed Fibonacci ratio that can be used within the strategy and on any program. You can manipulate the stats by changing the lookback period of the Fibonacci retracement and looking at different assets/timeframes.
This description tells the indicators combined to create a new strategy, with commissions and take profit/stop loss conditions included, and the process of strategy execution with a description of how to use it. If you have any questions feel free to PM me and boost if you found it helpful. Thank you, pineUSERS!
CHEATCODE1

Trend Movement S1-TMIdea:
This script combines: Moving Average (MA), Directional Movement (DMI), MACD
When condition of long or short position from all mentioned indicator are met script opens position. Once trend changes, it closes the position.
Then add some filter conditions to avoid noise.
Concept:
(Note that we take the close to get the closing price)
-Using only cross up down with MA will give a reversal point, but the downside is that it can be noisy.
-MACD will show the current trend detected by cross point.
-Then the +DI , -DI , ADX values are taken into account to confirm the price direction and movement strength.
-This strategy solves this problem by combining 2 more moving averages called 2 trend lines 1 long and 1 short. When the short line crosses up, it will show that the price trend is increasing (at this time the background between these 2 lines will be green) and vice versa (red). To determine if the current trend is bullish or bearish . This will avoid buying when price tend to go down.
-However, there will be many points where some more complex logic is needed. It will add conditions and calculate the probabilities before triggering the signals (You can see them through the item symbols B1, B2, ... ).
How it works:
1. The thin line is stand for short term moving average, and the thick line is stand for long term moving average.
If thin lines cross the thick lines, their color and background will turn green, the price is tend to go up (Uptrend).
If thin lines cross down thick lines, their color and background will turn red, the price is tend to go down (Downtrend).
2. Ability to check the checkbox in setting to show the Golden/De*ath cross.
The yellow symbol "+" is the Golden cross.
The black symbol "+" is the De*th cross.
3. Buy and Sell are show clearly on strategy as the buy and sell point. The default source from bar is CLOSE
4. Setting "Buy only" it using for spot market.
5. When "Not buy in down trend" is checked, it will not trigger buy when in down trend (thin lines cross down thick lines like description in 1.)
6. Setting High spread will call Close buy when it match the High spread bar with the High spread % value
7. It provides setting "Back test From date/To date" for backtest feature. You can set "BacktestFrom date" as the begin of test period. If check box "Using To Date" is check: "Backtest To Date" will be the end of test period.
Suitable time frames:
4h, 1D, 1W
* Please note that this logic does not attempt to predict future prices or 100% accurate signal; Strategy Tester are available to test the profitability of this strategy.
(INVITE ONLY indicator. Please direct message or visit website to try it out)
Hope you guys enjoy!
Examples:
BTCUSD 4H
TSLA 4H

Trend Follower Intraday [ Adjustable TF ]Trend Follower Intraday for 3 minute Time-Frame (Adjustable) , that has the time condition for Indian Markets as well.
Unlike the Free Scripts - Risk Management , Position Sizing , Partial Exit etc. are also included .
Send us a Message to know more about the strategy.
// ══════════════════════════════════════════════════════════════════════════ //
The Timing can be changed to fit other markets, scroll down to "TIME CONDITION" to know more.
The commission is also included in the strategy .
The basic idea is when ,
1) EMA1 crosses above EMA2 , is a Long condition .
2) EMA1 crosses below EMA2 , is a Short condition .
3) Green Section indicates Long position.
4) Red Section indicates Short position.
5) Allowed hours specifies the trade entry timing.
6) ATR STOP is the stop-loss value on chart , can be adjusted in INPUTS.
7) Target 1 is the 1st target value on chart , can be adjusted in INPUTS.
8) RISK is Maximum Risk per trade for the intraday trade can be changed .
9) Total Capital used can be adjusted under INPUTS.
10) ATR TRAIL is used for trailing after entry, as mentioned in the inputs below.
11) Check trades under the list of trades .
12) Trade only in liquid stocks .
13) Risk only 1-5% of total capital.
14) Inputs can be changed for better back-test results, but also manually check the trades before setting alerts
15) SQUARE OFF TIME - As you change the time frame , also change the square-off time to the candle's closing time.
Eg: For 3min Time-frame , Hour = 2Hrs | Minute = 57min
16) Strategy stops for the day if you have a loss .
17) COMMISSION value is set to 20Rs and SLIPPAGE value is set to 2 . Go to properties to change it .
*The input values and the results are mentioned under "BACKTEST RESULTS" below*
// ══════════════════════════════ //
// ————————> RISK MANAGEMENT <——————— //
// ══════════════════════════════ //
Risk management is done based on max loss per trade and can be adjusted in the INPUTS.
// ═══════════════════════════ //
// ————————> POSITION SIZE <——————— //
// ═══════════════════════════ //
Quantity of each trade is different based on the loss
// ═════════════════════════ //
// ————————> PROPERTIES <——————— //
// ═════════════════════════ //
COMMISSION , SLIPPAGE ,RECALCULATE is already mentioned in the code.
COMMISSION can be charges , based on the broker charges.
// ═══════════════════════════════//
// ————————> TIME CONDITION <————————— //
// ═══════════════════════════════//
The time can be changed in the INPUT.
The Indian Markets open at 9:15am and closes at 3:30pm.
The 'Allowed hours' under Inputs specifies the time at which Entries should happen .
"Close All" function closes all the trades before 3pm , at the open of the next candle.
To change the time to close all trades , check INPUT.
All open trades get closed by 3pm , because some brokers don't allow you to place fresh intraday orders after 3pm .
// ═══════════════════════════════════════════════ //
// ————————> BACKTEST RESULTS ( 123 CLOSED TRADES ) <————————— //
// ═══════════════════════════════════════════════ //
INPUTS can be changed for better Back-Test results.
The strategy applied to NSE:JSWENERGY (3 min Time-Frame and with a capital of 3,00,000 ) gives us 81% profitability , as shown below
It was tested for a period a 6 months with a Profit Factor of 1.957 ,net Profit of 43,000Rs .
Sharpe Ratio = 0.745
Sortino Ratio = 2.091
No strategy in the world promises 100% profits in all market conditions , so always define your risk before trading.
Also check Back-Test results manually ,before setting Alerts
The Graph has a Linear Curve with Consistent Profits.
The INPUTS are as follows,
1) EMA1 ————————————————> 38
2) EMA2 ————————————————> 118
3) ALLOWED HRS ———————————> 9:35 TO 14:30
4) ATR STOP ——————————————> 3.2
5) RISK ——————————————————> 3000
6) ATR TRAIL ———————————————> 2.6
7) TARGET 1 ————————————————> 2.4
8) MAX POSITION VALUE ——————————> 3,00,000
8) MAX DRAWDOWN —————————————> 9,000
8) SQUARE-OFF ————————————————> 14:57
NSE:JSWENERGY
Apply it to your charts Now !
NSE:JSWENERGY
Send us a message for FREE TRIALS | Instant Access
Thank You ☺

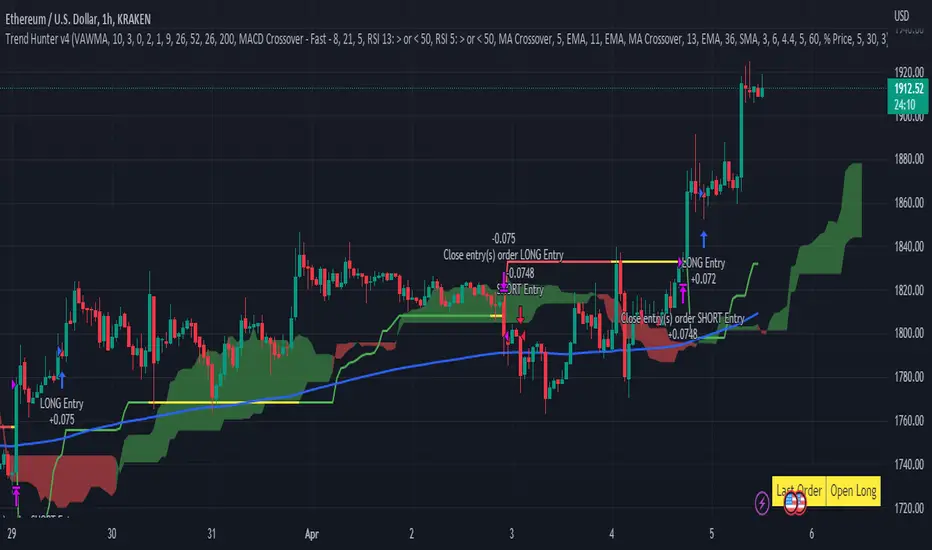
Trend Hunter v4This strategy follows the Trend Hunter training strategy taught at InvestIshare.
Entries are made based predominantly on the price action being above/below the Ichimoku Cloud with the ATR based super trend being used as a trailing stop loss.
Additional trend tracking tools can be toggled on / off to improve the wind rate on some time frames, with additional options available to limit entries if certain conditions are met.
If you would like access to this indicator, send me a DM on the Investishare Discord in the Trend Hunters channel.
The default parameters are set for BTC on the 2 HR time frame
Strategy - Trend Chaser - PSeTrend Chaser for Philippine Stock Exchange - LONG ONLY
-Elvin Kennedy Latayan 2022

[XBotUniverse] TREND 1.0 XBotUniverse is an automated crypto trading platform that allows you to start trading and investing in cryptocurrencies seamlessly, by implementing a fully automated trading bot using TradingView
The TREND Strategy version is a signal indicator following the direction of the trend with a fully technical method, without fundamentals, without the need for manual trading. Uses eleven Technical Indicators to measure trend strength. There are six breakouts and crosses to confirm open positions.
Runs well when the market is moving uptrend or downtrend. This strategy uses good risk management, where every open position takes a take profit of around 1.6% and a stop loss of around 1.3%, this is possible, because this strategy applies a "Smart Quantity", where the amount or quantity will adjust so that the profit and loss according to the calculation risk management, this will prevent your funds from being eroded
When the market is running very sideways, the strategy reduces the risk of loss by reducing open positions, by measuring the strength of the trend and measuring the shallowness of the average candle bar mixed with the "Smart Quantity" technique.
This strategy is applied to the Binance Futures Exchange, uses API Management, and can only be applied to the ETHUSDTPERP pair, so if it is used on another pair, the strategy will not work.
The main point of this platform is to reduce risk in trading digital instruments, by maintaining transactions with good risk management, namely preventing trading in a brutal way that will erode funds in an immeasurable way. Another important thing is that there is no risk of fundraising which results in funds or deposits being unable to be taken, such as in the case of forex trading robots where the biggest risk is with the broker, where our funds may not necessarily return due to non-transparent and poorly regulated mechanisms.
No business in this world can measure with certainty when the return on investment or can generate consistent profits, so also take care of the risk from our side as users, please analyze this strategy by paying attention to the strategy tester to measure NetProfit, Percent Profitable and Maximum Drawdown, from trading history that has occurred the previous month, because the results are relatively the same as what happened in real trading. Also remember that past profits do not guarantee future profits
Every business has risks, so use cold money so that we are comfortable when trading, don't use debt / borrow money, pawn money, kitchen money or hot money.
If you are interested in using this strategy for automated and real-time trading, please contact the owner of this strategy or the founders who can provide education on how to use it.

Ebb N Flo Trend [Backtester]Ebb n Flo Trend is a trend indicator that makes use of higher time frame High - Low pivots to determine when a trend has changed
In order to reduce over trading, and to reduce fake outs, the script relies on a clever combination of Fib ratio expansions and an averaged candle close
By combining the above strategies, the trend indicator forms a trailing trend indicator
The script determines when the current market condition has crossed over or under the trailing trend, and based on the closing conditions will change the trend of the script signaling a change. If the trend indicator is below the current market and green, the trend is bullish. If the trend is above the market and red, the trend is bearish
The indicator does not repaint, as such, once a signal has been received, the condition has been met on a previous candle and is final
Trend indicator can be used on any markets, for both Long and Short swings, however is best suited for long term trading on certain crypto markets (based on backtesting results). Be on the lookout for pairs with decent volume on reputable exchanges. It is not a holy grail type script for all markets. The key is to find enough to diversify your trades.
As can be seen in the backtester results, the script performs exceptionally well when trading using the 1W higher time frame (selection in the script settings), in the 1D current time frame (selecting the chart time frame)
The script is ideal for the beginner trader that cannot spend hours everyday looking at charts.
The backtesting results are based on allocating 10% of your portfolio to a single trade - this should be determined by your risk appetite.
There are risks associated with any form of investing. Never invest more than you are willing to lose. Past performance is not a guarantee or predictor of future performance. Do your own due diligence before making any investment decisions.
Configuration:
The dropdown in the script selects the time frame for Highs and Lows that the script must consider, and the chart time frame is the time frame of which closing conditions the script should use
Alerts:
The indicator comes with 2 off alerts: open_LONG and open_SHORT, which in itself is self explanatory, however, due to the slow trading nature of the script, alerts are generally not needed
Once you receive access to the trial version, you will also receive a link to a video that will show you exactly how to set up the script
Happy trading

Three EMAs Trend-following Strategy (by Coinrule)Trend-following strategies are great because they give you the peace of mind that you're trading in line with the market.
However, by definition, you're always following. That means you're always a bit later than your want to be. The main challenges such strategies face are:
Confirming that there is a trend
Following the trend, hopefully, early enough to catch the majority of the move
Hopping off the trade when it seems to have run its course
This EMA Trend-following strategy attempts to address such challenges while allowing for a dynamic stop loss.
ENTRY
The trading system requires three crossovers on the same candle to confirm that a new trend is beginning:
Price crossing over EMA 7
Price crossing over EMA 14
Price crossing over EMA 21
The first benefit of using all three crossovers is to reduce false signals. The second benefit is that you know that a strong trend is likely to develop relatively soon, with the help of the fast setup of the three EMAs.
EXIT
The strategy comes with a fixed take profit and a volatility stop, which acts as a trailing stop to adapt to the trend's strength. That helps you get out of the way as soon as market conditions change. Depending on your long-term confidence in the asset, you can edit the fixed take profit to be more conservative or aggressive.
The position is closed when:
The price increases by 4%
The price crosses below the volatility stop.
The best time frame for this strategy based on our backtest is the 4-hr. Shorter timeframes can also work well, although they exhibit larger volatility in their returns. In general, this approach suits medium timeframes. A trading fee of 0.1% is taken into account. The fee is aligned to the base fee applied on Binance, which is the largest cryptocurrency exchange.

[mdeacey] EMA% Channel + Bollinger Band Trending StrategyThis strategy is based off the users selection of an EMA and percentage defined middle, upper and lower channels. The strategy longs if the price crosses the middle to upper channel until such time that a "reversal candle" (that exceeds the averages of 3 and 9 above the EMA 3) is found – and then shorts that reversal candle in the hope the price will change state from trending to ranging and move back to the middle channel. The same but opposite process for shorts.
The two obvious fallbacks to this strategy are that:
- Once trending the price can continue upwards. We try to mitigate this through use of a stoploss defined by ATR.
- Certain percentage thresholds can trigger a long/short with not much room to move before coming back to the middle channel. This is a tightrope exercise as making the percentage channels tighter misses earlier entries in more optimal cases. Change the parameters to find an EMA and percentages to find the best R/R.
All options are configurable and code open source. Happy trading!

Adaptive Hull MA Trend tracerBINANCE:ETHUSDT
This is the first attempt to create a "PEFECT" trend tracer.
All the Moving Averages have a lag but I personally like the Hull Moving Average for the fast response and noise reduction.
However, due to the market behavior it is hard to choose the correct length of the Moving Average that will be suitable for current situation.
This Indicator uses the Bolinger Bands Width to adapt the length of the Hull Moving Average according to the following rule:
1) if the BBW (Bolinger Bands Width) is small => length of the MA is bigger in order to filter the noise of small price changes.
2) if the BBW is bigger => MA length is smaller to track the trend more accurately.
This script also has a strategy logic with RSI for a better entry and exit as well as the minimum allowed MA length.
Further work:
1) Full adaptation of the Moving average
2) Filter bad entries
Please let me know of any suggestions for improving this indicator.

Strategy of Strategic Trend By TrendciHocaHello everyone, this strategies, which is actually the Strategic Trend indicators strategy, which is one of the most used indicators in the market, also has the following features.
In 15 min interval choosen speacial ATR and ATR multiplier by default it get more profit. The ATR is then a moving average, generally using 14 bars, of the true ranges. But as seen on strategy its changed the 11 for most profit for 15 min interval. You can change settings for different intervals. This indicator must combined with the Strategic Trend by TrendciHoca indicator. . You must change only ATR length and ATR multiplier part of on the strategy.
Barcolors change with crossover 1 bar EMA with cross with ATR value.
