Trend Following BarWhile analysing a chart, one of the biggest problem is to see if there is trend or not. While thinking about it, I found the idea to analyse moving averages in channel and their momentum according to channel width.
How it Works?
On each bar it creates a channel by highest/lowest point of a MA. highest point is upper line and lowest point is lower line of the MA channel,
It gets highest and lowest point of last 300 bars, (say Price Channel)
If the width of MA channel is greater than certain rate of price channel then it decides there is trend
After it decided there is trend, it calculates the rate between channel and MA. Bigger result means stronger trend.
According to rate of MA channel and the price channel, bar color becomes lighter/darker. so when you look at the bar color you can see the trend strength.
Some details about my idea:
Options:
You can choose following MA types as source: EMA, SMA, RMA, WMA, VWMA
"Period to Check Trend" is the period to create MA channel. Bigger period cause more sensitivity.
"Trend Channel Rate %" is rate of price channel. Price channel created by using highest/lowest of last 300 bars. I did this to make the script works on all time frames correctly.
"Use Linear Regression" is used to get rid of noise. it may cause 1-2 bars latency.
All comments are welcome!.
Enjoy!
Cerca negli script per "trend"

Trend Following BreakoutEasy Trend Following Strategy using Highs and Lows breakout of the last X candles to enter and exit trades.
You can easily change the ENTRY and EXIT value in order to find the best settings.
This strategy seems to be working well for $BTC and $ETH on the 4H and 1D.
I didn't play with it too much as I am testing script to trade on the 15 minutes chart with margin. This script can't do this successfully but I hope it can be helpful for what you want to achieve.

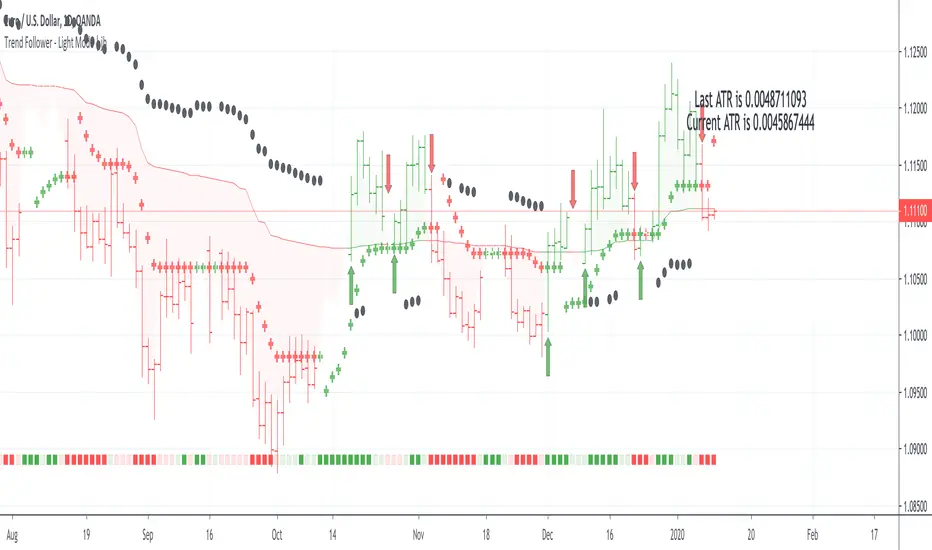
Trend Follower - Light Mode | jhFollow up script for my Trend Follower script.
I'm used to dark mode, so I coded a few key plots in white, so those are changed into black on the script.
Notably:
- > 1 ATR in black dots along the baseline
- Current and previous ATR text labels to the right of the price
- A text label spacing input that allows you to adjust the spacing for text label from price.
This is a trend following system that combines 3 indicators which provide different functionalities, also a concept conceived by VP's No Nonsense FX / NNFX method.
1. Baseline
The main baseline filter is an indicator called Modular Filter created by Alex Grover
- www.tradingview.com
- Alex Grover - Modular Filter
-------
That's the moving average like baseline following price, filtering long and short trends and providing entry signals when the price crosses the baseline.
Entry signal indicated with arrows.
2. Volume/Volatility, I will called it Trend Strength
The next indicator is commonly known as ASH, Absolute Strength Histogram.
This indicator was shared by VP as a two line cross trend confirmation indicator, however I discovered an interesting property when I modified the calculation of the histogram.
- Alex Grover Absolute Strength
-------
My modification and other info here
- Absolute Strength Histogram v2
-------
I simplified the display of the trend strength by plotting squares at the bottom of the chart.
- Lighted Squares shows strength
- Dimmed Squares shows weakness
3. Second Confirmation / Exits / Trailing Stop
Finally the last indicator is my usage of QQE (Qualitative Quantitative Estimation), demonstrated in my QQE Trailing Line Indicator
- QQE Trailing Line for Trailing Stop
-------
Three usages of this amazing indicator, serving as :
- Second trend confirmation
- Exit signal when price crosses the trailing line
- Trailing stop when you scaled out the second trade
This indicator is plotted with crosses.
Additional plots and information
Bar Color
- Green for longs, Red for shorts, White when the baseline direction conflicts with the QQE trailing line direction
- When it's white, it's usually ranging and not trending, ASH will also keep you off ranging periods.
-------
ATR Filter
- White circles along the baseline, they will show up if the price has moved more than one ATR from the baseline
- The default allowance is 1 ATR.
-------
The previous and current ATR value
- Label on the right side of the chart showing the previous and current value of ATR
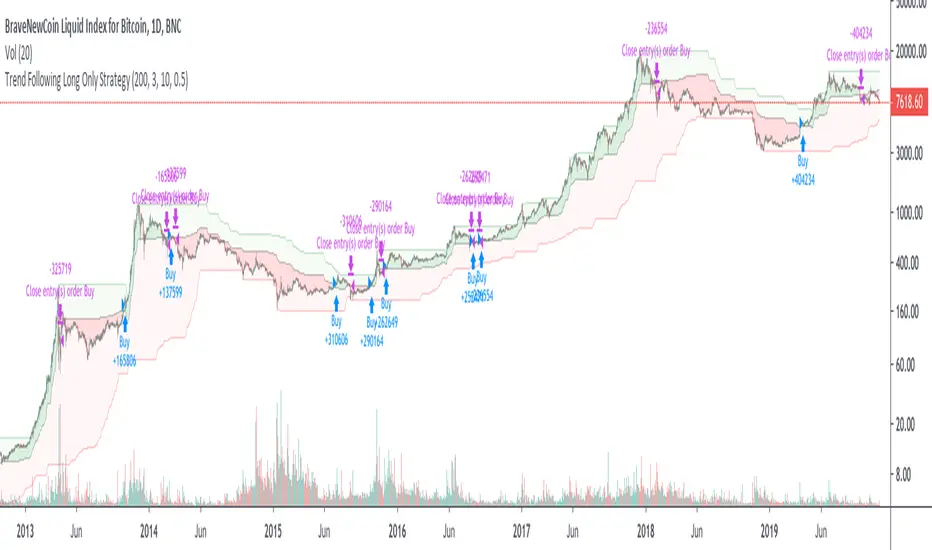
Trend Following Long Only StrategyThis script tries to ride bull trends and stay out of the market in bear trends.
Trend Confirmation Indicator - Triple OBVDear all, you might wonder is there a confirmation indicator that has a high hit rate, is dependable, and could rely on the information it gives you when making a decision?
Here I present an indicator I developed specifically for cryptocurrency, in the minds of eliminating fakeouts and traps.
Trend is always invalid then there is a lack of volume, so by tracking the momentum of price direction & volume, we can have a ballpark about where the market is moving to.
On balance volume
obvshort = ema3
obvmedium = ema9
obvlong = ema26
This is a lagging indicator, which means it's not good at predicting reversal.
This is also the reason why
long signal = obvshort > obvmedium and obvshort > obvlong
shortsignal = obvshort < obvmedium and obvshort < obvlong
both without obvmedium >< obvlong
This indicator will not lie to you.
At last
Save Hong Kong, the revolution of our time.

Trend CheckerAn indicator that tell if market is trending or ranging, when the indicator is greater than 0.5 then market is trending, when the indicator is equal to 1 market is overbought/oversold.
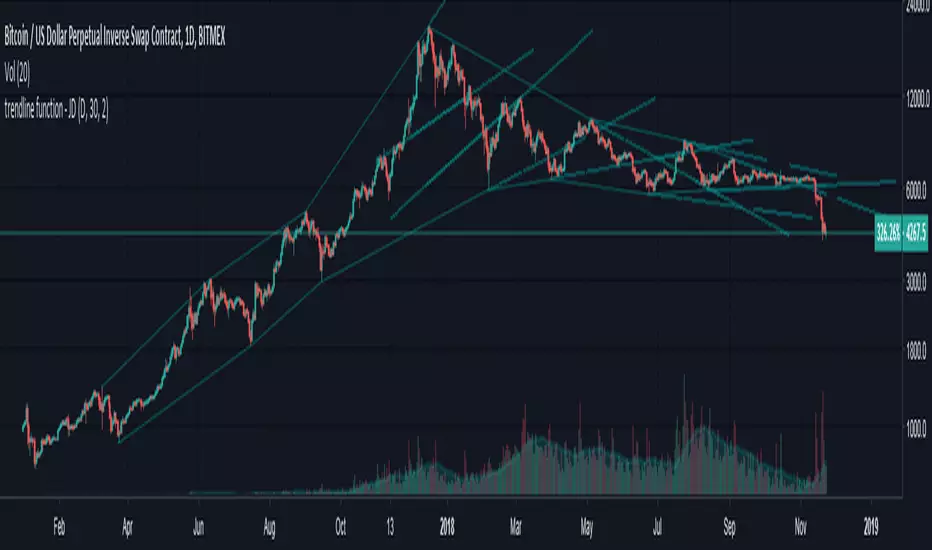
trendline function - JD!EXPERIMENTAL!
As TV doesn't provide a function to draw lines between points, I wrote a function to do this in one my own indicators.
The function itself however can be applied/modified for different use cases, eg. drawing trendlines.
In this (proof of concept) example I used it to draw lines based on past high/low pivot points.
The inputs required:
* an INPUT FUNCTION (in this form, its designed to work with functions that have occasional values and na-values between them, it then connects the non-zero values to form a line)
* a BOOL (to indicate if you want to draw only the rising or falling lines)
* a DELAY (in this case this is the lookback period for the pivot-points function, this is to compensate the calculation of the past and realtime points)
The function returns:
* the function to draw the extension from the BASE-LINE to the current time (here this is the connection of the last pivot-point to the current point to bridge the gap of the lookback period, this is NOT REALTIME!)
* the function to draw the extension for the current time (here this is the continuation of the line until a new pivot-point is valid, this is DRAWN IN REALTIME!!)
* the color of the lines (in this case the lines are only colored (lime or fuchsia) if they either go up or down, else they are invisible, this is to clean up the invalid lines)
these output functions can then simply be plotted using the 'plot' function.
JD.
Trend Detection IndexTrend Detection Index indicator script.
This indicator was originally developed by M.H. Pee (Stocks & Commodities V. 19:10 (54-61): Trend Detection Index).
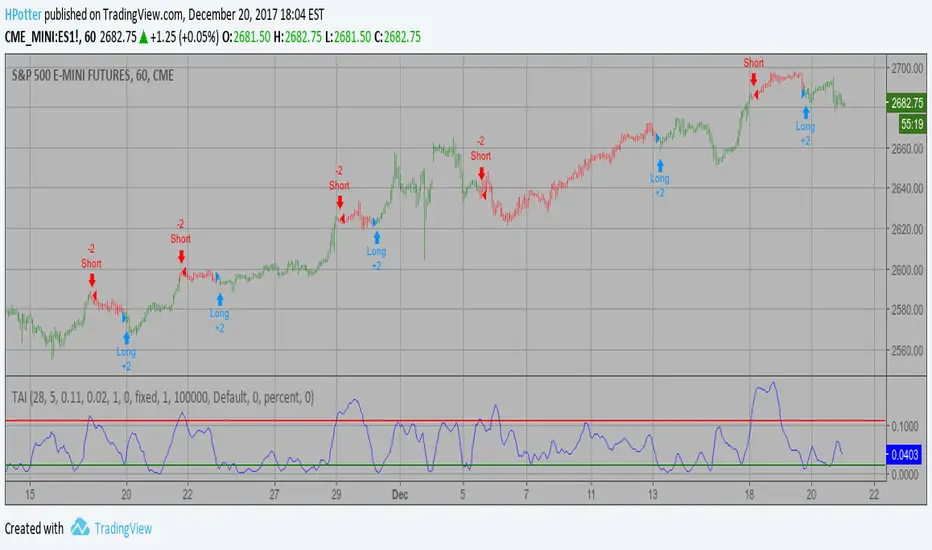
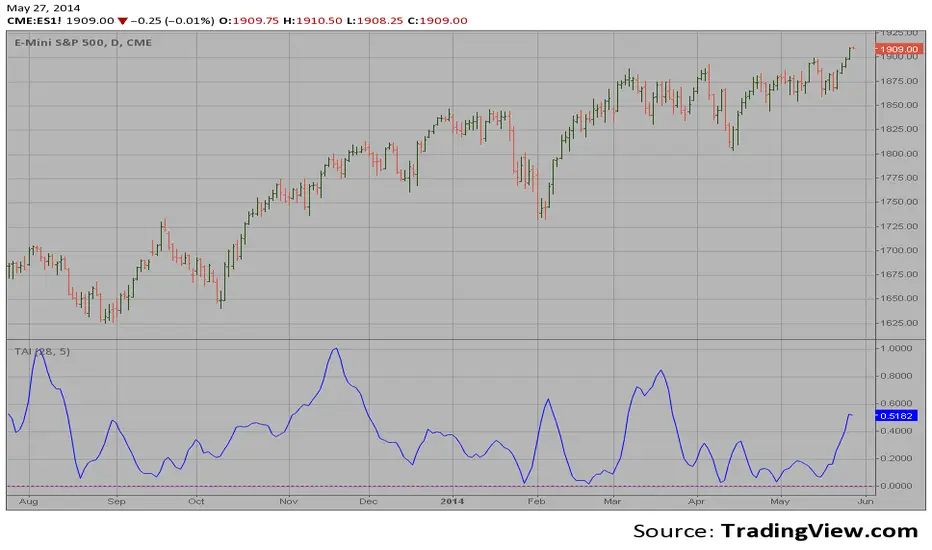
Trend Analysis Index Backtest In essence, it is simply the standard deviation of the last x bars of a
y-bar moving average. Thus, the TAI is a simple trend indicator when prices
trend with authority, the slope of the moving average increases, and when
prices meander in a trendless range, the slope of the moving average decreases.
You can change long to short in the Input Settings
WARNING:
- For purpose educate only
- This script to change bars colors.
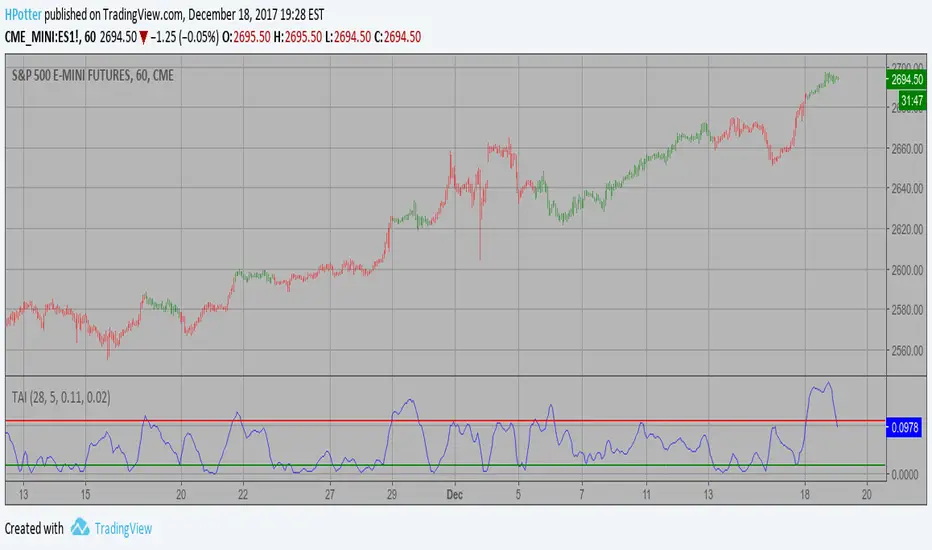
Trend Analysis Index Strategy In essence, it is simply the standard deviation of the last x bars of a
y-bar moving average. Thus, the TAI is a simple trend indicator when prices
trend with authority, the slope of the moving average increases, and when
prices meander in a trendless range, the slope of the moving average decreases.
WARNING:
- This script to change bars colors.
Trend FilterThe indicator paints the bar colours based on the average open and average close for past N days.
if average close is above average open, the bars are coloured green, otherwise they are coloured red
It can be used as a general trend filter on weekly, daily bars. even on intraday timeframes, this would work well and give a sense of the current trend direction.
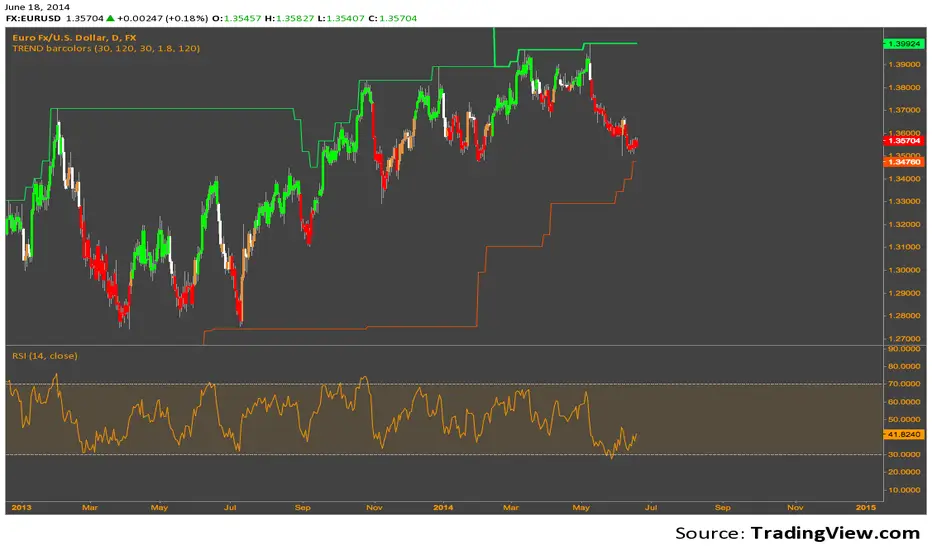
TREND barcolorsThe Donchian values are basically from Ed Sekoytas original statistical run, that gave the values 30 & 120 (aren't as relevant today, but still packs a punch).
The idea of this code is just to take that 30, add a very simple inset of it, with ATR, and color code the bar Green or Red to indicate the direction of the trend. When a new break of the 120 line, (thick line) higher or lower, it typically indicates a bigger bias towards the trend.
It's my first publish, and so a very simple easy to understand system.
Use at your own risk. I cannot be held liable for any damages financial or otherwise, directly or indirectly related to using this script.
Trend Analysis Index In essence, it is simply the standard deviation of the last x bars of a
y-bar moving average. Thus, the TAI is a simple trend indicator when prices
trend with authority, the slope of the moving average increases, and when
prices meander in a trendless range, the slope of the moving average decreases.
Trend Strength [OmegaTools]Trend Strength is a quantitative regime oscillator designed to measure directional pressure and trend quality by blending price structure, return-dependence, realized intrabar expansion, and volume participation into a single normalized signal. The goal is not to predict, but to classify market state: when price action is in an expansionary/distributionary phase versus when it is in a contractionary/accumulation phase, so you can align execution and risk with the prevailing environment.
Core concept and methodology
The indicator aggregates four components computed on stable rolling windows and mapped into comparable ranges:
1. Price location / structural positioning (100-bar range)
A normalized price-location metric (position of close within the rolling high–low range) is transformed into a non-linear “strength” profile. This emphasizes meaningful departures from the middle of the range and penalizes indecision, producing a structure-aware contribution rather than a raw oscillator.
2. Return-dependence / directional persistence (100 bars)
A correlation term measures the relationship between the current return (close − close ) and the prior price level (close ). This helps detect environments where movement is more persistent or more mean-reverting, providing a statistical component that complements pure price-location signals.
3. Realized expansion / volatility proxy (50-bar accumulation, 300-bar normalization)
Intrabar expansion is approximated via the absolute candle body relative to the full range, aggregated over a short window to represent realized “effort” and then normalized over a longer window. This captures whether price is moving with meaningful body expansion versus compressing and stalling.
4. Volume participation (11-bar accumulation, 300-bar normalization)
A rolling volume sum is normalized over a longer window to quantify participation. This helps separate “thin” moves from moves supported by broader activity, without relying on exchange-specific volume assumptions.
The final oscillator is a weighted blend of these four normalized components, scaled for readability. The output is intentionally centered around two actionable regimes rather than a symmetric overbought/oversold framework.
How to read the oscillator
Trend Strength is designed around two main thresholds:
- Distribution / Expansion regime (oscillator above 0)
When the oscillator is above 0, the market is classified as being in a higher-pressure expansion regime. This often corresponds to directional continuation potential, stronger impulse behavior, and reduced suitability for tight mean-reversion tactics.
- Accumulation / Contraction regime (oscillator below −1.3)
When the oscillator is below −1.3, the market is classified as being in a contraction/accumulation regime. This frequently corresponds to compression, rotation, and lower directional efficiency, where breakouts may be more fragile and mean-reversion tactics may be more appropriate (depending on instrument and session conditions).
Values between 0 and −1.3 are treated as transitional/neutral, where the market is not clearly committing to either regime.
Continuous Mode vs Standard Mode
Trend Strength includes an optional Continuous Mode to improve interpretability during regime transitions:
- Standard Mode colors only when the oscillator is firmly in one of the two regimes (above 0 or below −1.3). Neutral zones remain uncolored, keeping the display conservative.
- Continuous Mode adds persistence logic: once a regime is confirmed, intermediate values are rendered with a lighter shade of the last confirmed regime until the opposite regime is confirmed. This reduces visual noise, helps maintain a consistent directional bias framework, and is particularly useful for intraday execution and session trend management.
Visual design and bar coloring
The oscillator line is color-coded:
- Purple: distribution / expansion regime
- Orange: accumulation / contraction regime
Neutral/transitional values are displayed in grey (or lightly shaded in Continuous Mode based on last confirmed regime).
Optionally, the indicator can color price bars using the same regime logic, allowing rapid at-a-glance regime recognition directly on the chart.
Practical use cases
- Regime filter for strategies: enable trend-following logic only in expansion regimes; enable mean-reversion or range logic in contraction regimes.
- Risk adjustment: increase/decrease position sizing or tighten/widen stops based on regime classification.
- Confirmation layer: combine with structure tools (market structure, VWAP, key levels) to validate whether conditions support continuation or imply compression.
- Session management: identify when a session is behaving as a trend day versus a rotational day, improving trade selection and reducing overtrading.
Notes
Trend Strength is a regime classifier and contextual tool. It does not guarantee future direction and should be integrated into a complete decision process (risk management, market structure, session context, and instrument-specific behavior).
© OmegaTools

Trend & Strength Detector TSDTrend Strength Detector (TSD)
*Objective Trend Quality Measurement for Educational Market Analysis*
Note: This mathematical framework is a proprietary quantitative model developed by Ario Pinelab, inspired by classical EMA, ADX, RSI and MACD principles, yet not documented in any public technical or academic publication.
## 🎯 Purpose & Design Philosophy
The ** Trend Strength Detector- TSD ** is an educational research tool that provides **quantitative measurement of trend quality** through two independent scoring systems (0-100 scale). It answers the analytical question: *"How strong and aligned is the current market trend environment?"*
This indicator is designed with a **modular, complementary approach** to work alongside various analysis methodologies, particularly pattern-based recognition systems.
## 🔗 Complementary Research Framework
### Designed to Work With Pattern Detection Systems
This indicator provides **environmental context measurement** that complements qualitative pattern recognition tools. It works particularly well alongside systems like:
- **RMBS Smart Detector - Multi-Factor Momentum System**
- Traditional chart pattern analyzers
- Any momentum-based pattern identification tools
🔍 **To find RMBS Smart Detector:**
- Search in TradingView Indicators Library: `" RMBS Smart Detector - Multi-Factor Momentum System"`
- Look for: *Multi-Factor Momentum System*
- By author: ` `
### Why This Complementary Approach?
**Trend Quality Measurement** (TSD - this tool) provides:
- ✅ Structural trend alignment (0-100 score)
- ✅ Momentum intensity levels (0-100 score)
- ✅ Environment classification (Strong/Moderate/Weak)
- 📌 **Answers:** *"HOW STRONG is the underlying trend environment?"*
### Educational Research Value
When used together in a research context, these tools enable systematic study of questions like:
- How do reversal patterns behave when Strength Score is above 70 vs below 30?
- Do continuation patterns in weakening environments (declining scores) show different characteristics?
- What is the correlation between high Alignment Scores and pattern "success rates"?
- Can environment classification help identify genuine trend initiation vs false starts?
⚠️ **Important Note:** Both tools are **independent and work standalone**. TSD provides value whether used alone or with other analysis methods. The relationship with RMBS (or any pattern tool) is **complementary for research purposes**, not dependent.
---
###Mathematical Foundation
##TSA Formula: scoring method developed by Ario
-Trend Model (0 – 100)
TAS = EMA Alignment (0–40) + Price Position (0–30) + Trend Consistency (0–30)
EMA Alignment checks EMA_fast vs EMA_slow vs EMA_trend structure.
Price Position evaluates if Close is above/below all EMAs.
Consistency = 3 × max(bullish,bearish bars within 10 candles).
-Strength Model (0 – 100)
Strength = ADX (0–50) + EMA Slope (0–25) + RSI (0–15) + MACD (0–10)
ADX measures trend energy; Slope shows EMA momentum %;
RSI assesses zone positioning; MACD confirms directional agreement.
Note: This formula represents a proprietary quantitative model by Ario_Pinelab, inspired by classical technical concepts but not published in any external reference.________________________________________
📊 Environment Classification
Based on Total Strength Score:
🟢 Strong Environment: Score ≥ 60
→ Well-defined momentum, clear directional bias
🟡 Moderate Environment: 40 ≤ Score < 60
→ Mixed signals, transitional conditions
🔴 Weak Environment: Score < 40
→ Ranging, choppy, low conviction movement
Color Coding:
• Green background: Strong (≥60)
• Yellow background: Moderate (40-59)
• Red background: Weak (<40)
________________________________________
📈 Visual Components
Main Chart Display
Score Labels (Top-Right Corner):
┌─────────────────────────────────┐
│ 📊 Alignment: 75 | Strength: 82 │
│ Environment: Strong 🟢 │
└─────────────────────────────────┘
Color-Coded Background:
• Environment strength visually indicated via background color
• Helps quick identification of market regime
• Customizable transparency (default: 90%)
Reference Lines:
• Dotted line at 60: Strong/Moderate threshold
• Dotted line at 40: Moderate/Weak threshold
• Mid-line at 50: Neutral reference
________________________________________
🔧 Customization Settings
Input Parameters
The best setting is the default mode.
🚫 Important Disclaimers & Limitations
What This Indicator IS:
✅ Educational measurement tool for trend quality research
✅ Quantitative assessment of current market environment
✅ Complementary analysis tool for pattern-based systems
✅ Historical data analyzer for systematic study
✅ Multi-factor scoring system based on technical calculations
What This Indicator IS NOT:
❌ NOT a trading system or signal generator
❌ NOT financial advice or trade recommendations
❌ NOT predictive of future price movements
❌ NOT a guarantee of pattern success/failure
❌ NOT a substitute for comprehensive risk management
________________________________________
Known Limitations
1. Lagging Nature:
⚠️ All components (EMA, ADX, RSI, MACD) are calculated
from historical price data
→ Scores reflect CURRENT and RECENT conditions
→ Cannot predict sudden reversals or black swan events
→ Trend measurements lag actual price turning points
2. Whipsaw Risk:
⚠️ In choppy/ranging markets, scores may fluctuate rapidly
→ Moderate zone (40-60) can see frequent transitions
→ Low timeframes more susceptible to noise
→ Consider higher timeframes for stable measurements
3. Component Conflicts:
⚠️ Individual components may disagree
→ Example: Strong ADX but weak RSI alignment
→ Scores average these conflicts (may hide nuance)
→ Check individual components for deeper insight
4. Not Predictive:
⚠️ High scores do NOT guarantee continuation
⚠️ Low scores do NOT guarantee reversal
→ Measurement ≠ Prediction
→ Use for CONTEXT, not SIGNALS
→ Combine with comprehensive analysis
________________________________________
Risk Acknowledgments
Market Risk:
• All trading involves substantial risk of loss
• Past performance (even systematic studies) does not guarantee future results
• No indicator, system, or methodology can eliminate market risk
Measurement Limitations:
• Scores are mathematical calculations, not market predictions
• Environmental classification is descriptive, not prescriptive
• Strong measurements can deteriorate rapidly without warning
Educational Purpose:
• This tool is designed for LEARNING about market structure
• Not designed, tested, or validated as a standalone trading system
• Any trading decisions are user’s sole responsibility
No Warranty:
• Indicator provided “as-is” for educational purposes
• No guarantee of accuracy, reliability, or profitability
• Users must verify calculations and apply critical thinking
Open Source
Full Pine Script code available for educational study and modification. Feedback and improvement suggestions welcome.
“All logic is presented for research and educational visualization.”
---

Trend-Strong Candle - 3 EMAs with Filters# Trend-Strong Candle - Professional Trading Indicator
## 📊 What It Does
Identifies high-probability entries by combining triple EMA trend analysis with strong candle detection. Only signals when all conditions align for maximum accuracy.
## 🎯 Core Features
- Triple EMA System: Fast (20) / Medium (50) / Slow (200) for trend confirmation
- Strong Candle Filter: ATR-based sizing ensures genuine momentum
- Advanced Filters: EMA close validation + trend stability checks
- Live Alerts: Instant notifications for real-time signals
- Session Filter: Trade only during active EU/US market hours
## ⚡ Quick Setup
Scalping (1-5min): Default settings + enable session filter
Day Trading (15-60min): Default settings work perfectly
Swing Trading (4H+): Increase ATR multiplier to 0.8-1.0
## 📈 Trading Rules
Long Signals: Green triangle below candle
- Strong bullish candle during confirmed uptrend
- All EMAs properly aligned (Fast > Medium > Slow)
Short Signals: Red triangle above candle
- Strong bearish candle during confirmed downtrend
- All EMAs properly aligned (Fast < Medium < Slow)
## ⚠️ Critical Success Factors
1. Always Verify the Trend Yourself
The indicator helps identify signals, but YOU must confirm the larger trend context. Check higher timeframes and overall market structure before entering.
2. Understand the "Big Players"
Strong candles in trend direction usually come from institutional money (banks, funds, algorithms). These create the momentum that retail traders can follow. The indicator catches these institutional moves.
3. Distance to Next Value Level
NEVER enter if price is too close to major resistance/support levels:
- Check distance to round numbers (1.1000, 1.1050, etc.)
- Ensure at least 20-30 pips room to next key level
- You need space for profit - tight levels = limited upside
4. Risk Management
- Stop Loss: 1-2 ATR from entry
- Take Profit: 2-3 ATR target (minimum 1:2 R/R)
- Position Size: Risk max 1-2% per trade
## 💡 Pro Tips
- Best Sessions: London open (8-12 UTC) and NY open (13-17 UTC)
- Avoid: Major news, low liquidity periods, choppy markets
- Multiple Timeframes: Confirm signals on higher timeframe
- Value Levels: Always check daily/weekly support/resistance before entering
## 🎯 Success Formula
Trend Confirmation + Strong Institutional Candle + Distance to Value Levels = High Probability Trade
*
Remember: The indicator finds the signals, but successful trading requires your analysis of trend context and value level positioning. Trade smart, not just frequent.

Trend Continuation Filter - 🚀 Trend Continuation Filter — Multi-Factor Overlay
This overlay plots bullish / bearish continuation labels & arrows only when the market has enough confluence behind the move. Think of it as your “trend gatekeeper” — cutting out weak setups and highlighting only those with real momentum + structure.
🔍 Built-in Filters
✔ Ichimoku Cloud → trend bias + Tenkan/Kijun confirmation
✔ MACD (12/26/9) → acceleration via histogram slope
✔ RSI / MFI (14) → momentum quality (≥60 bullish / ≤40 bearish)
✔ ADX (14) → strength check (≥20 and rising)
➕ EMA Alignment (9/21/55/233) (optional)
➕ ATR Slope (14) (optional)
🎯 How it works
✅ Prints a Bull Continuation label/arrow when ≥4 filters align to the upside
✅ Prints a Bear Continuation label/arrow when ≥4 filters align to the downside
⚙️ minChecks input lets you adjust the strictness:
• Normal Days → set to 4 (more frequent, flexible)
• Trend Days → raise to 5–6 (fewer, high-conviction setups)
📈 Best Practices
⏰ Focus on London & New York sessions for clean expectancy
🧩 Pair with a HUD/Dashboard panel to see exactly which filters are active

Trend Display Table (with Change Alerts)📌 Indicator: Trend Display Table (with Change Alerts)
This indicator helps identify trend direction based on a 15-minute 20 SMA compared against a 10 EMA applied to that SMA.
Trend Logic:
Bullish → 20 SMA crosses above 10 EMA (on SMA values)
Bearish → 20 SMA crosses below 10 EMA (on SMA values)
Neutral → No crossover (trend continues from previous state)
Display:
A compact trend table appears on the chart (top-right), showing the current trend with customizable colors, font size, and background.
Alerts:
Alerts are triggered only when the trend changes (from Bullish → Bearish or Bearish → Bullish).
This prevents repeated alerts on every bar.
✅ Useful for:
Confirming higher timeframe trend bias
Filtering trades in choppy markets
Getting notified instantly when the trend flips

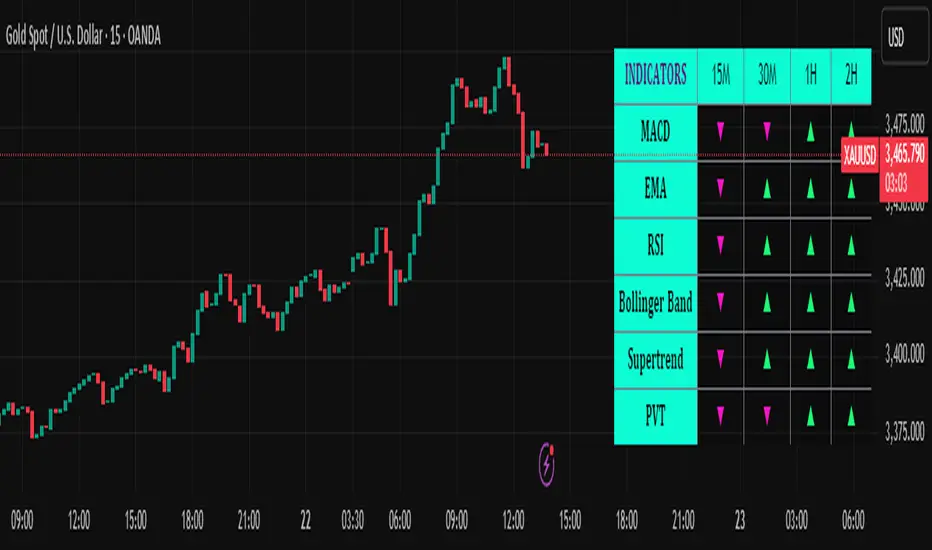
Trend Matrix Multi-Timeframe Dashboard(TechnoBlooms)Trend Matrix Multi-Timeframe Dashboard is a Minimalist Multi-Timeframe Trend Analyzer with Smart Indicator Integration. Trend Matrix MTF Dashboard is a clean, efficient, and visually intuitive trend analyzer built for traders who value simplicity without compromising on technical depth.
This dashboard empowers you to track trend direction across multiple timeframes using a curated set of powerful technical indicators—all from one compact visual panel. The design philosophy is simple: eliminate clutter, highlight trend clarity, and accelerate your decision-making process.
Key Features
✅ Minimalist Design with Maximum Insight
A compact dashboard view designed for clean charts and focused trading
Optimized layout shows everything you need—nothing you don’t
✅ Multi-Timeframe Access at a Glance
Instantly read the trend direction of selected indicators on multiple timeframes (e.g., 15m, 1h, 4h, 1D)
Customize the timeframe stack to fit scalping, intraday, swing, or positional strategies
✅ Robust Technical Indicators Built In
Each one is hand-picked for trend reliability:
MACD – Momentum and crossover confirmation
RSI – Overbought/oversold and directional shift
EMA – Dynamic support/resistance and trend bias
Bollinger Bands – Volatility structure and trend containment
PVT – Volume-Weighted Trend Confirmation
Supertrend – Price-following trend tracker
✅ Live Updates & Lightweight Performance
Built to update efficiently on every bar close
Minimal performance impact even with multiple timeframes active
By offering multi-timeframe (MTF) access to proven trend-following indicators, Trend Matrix helps you confidently align with the market’s dominant direction—without jumping between charts or analyzing indicators one by one.
This indicator offers customizable settings. The trader can choose the input parameters timeframes as per the choice.
Trend Matrix Multi-Timeframe Dashboard helps traders to identify trend based on technical indications. Trader can refer this while taking trading decisions.
🧠 Ideal For
Scalpers who need higher timeframe confirmation
Swing traders identifying clean entries aligned with the macro trend
Trend followers seeking clarity before committing capital
Price action & SMC traders validating market structure setups
Beginners who want a high-level trend guide without messy indicators
Trend Indicator with ArrowsTrend Indicator with arrows is a NoBrainer indicator to see the trend clearly.
UpTrend is defined as a candle closing above previous high. I
DownTrend is defined as a candle closing below previous low
A consolidation is defined as a candle closing inside previous candle high low.
UpTrend - Indicated with a green arrow below the candle with the current indicator.
DownTrend - ndicated with a red arrow above the candle with the current indicator.
So How to use this Indicator?
Identify zones of consolidation where the indicator doesn't show any arrows. Upon shift from consolidation to UpTrend or DownTrend take a entry. This is one way.
Second and most useful way is wait for Support or resistant hit.
If it's a support. Upon support hit wait for Consolidation, DownTrend and then UpTrend/(Consolidation again with uptrend) for long entry.
If its a resistance. Upon resistance hit wait for Consolidation, Uptrend and then DownTrend/(Consolidation again with DownTrend) for short Entry.

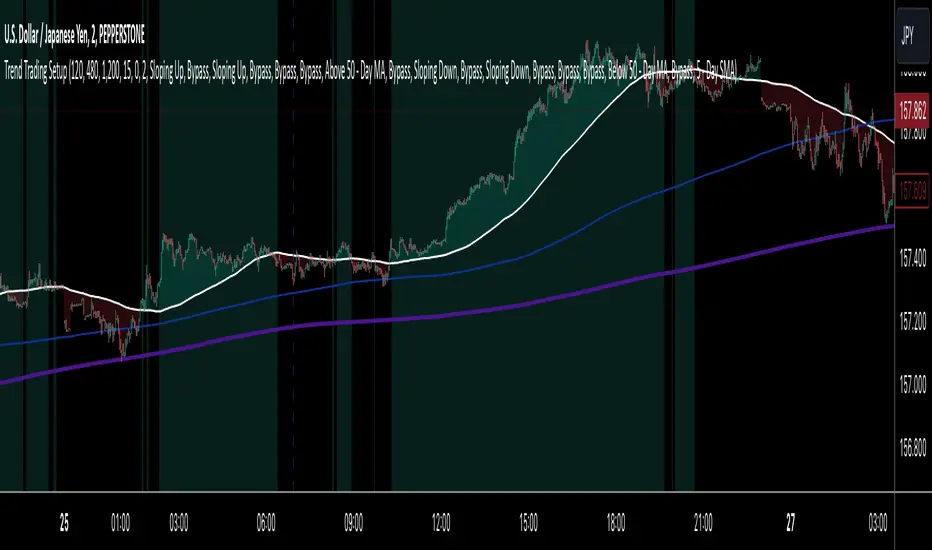
Trend Trading SetupTrend Trading Setup is an indicator that is designed to assist with trend trading by indicating when the basic conditions for a trade in either direction are met.
Note: Default values assume the 1-hour chart
The idea is that this will allow a trader to know for the first glance if a market is worthy of closer inspection or not.
Indicator Features:
1. Simple Moving Averages - defining the basic trade conditions
5 - Day Moving Average
20 - Day Moving Average
50 - Day Moving Average
2. Visualisation of The Price Location In Relation To The 5 - Day Moving Average
If price is above the 5-day Moving Average, the space between them is green. If price is below the 5-day Moving Average, the space between them is red.
3. Risk Management Section - calculates an ATR-based stop loss.
4. Indication When The Conditions Are Met
If the conditions for a bullish bias are met, the chart background is green. If the conditions for a bearish bias are met, the chart background is red. If none of the conditions are met, the chart background is left as is.
A user can adjust the length of any of the Moving Averages as well as the length of the ATR and the ATR Multiplier for the stop loss size. Default values assume the 1-hour chart, but surprisingly the settings seem to show logical results also on other time frames.
The Setup:
Bullish - 5-day Moving Average is above the 50-day Moving Average. The slope of both of the Moving Averages is positive and the price has to be above the 5-day Moving Average.
Bearish - Exactly the same as for the bullish bias, but opposite.
I do not recommend to take this Trend Trading Setup indicator as the only reason for a position. However, I believe it can be very useful to show when the overall conditions are in favour of a long position or in favour of a short position.
Trend Momentum Indicator with MACD ConfirmationTrend Momentum Indicator with MACD Confirmation
Overview: The Trend Momentum Indicator with MACD Confirmation is a versatile trading tool designed to help traders identify potential buy and sell signals in the market based on the interaction between price action, a Simple Moving Average (SMA), and the Moving Average Convergence Divergence (MACD) indicator. This strategy aims to enhance trading decisions by waiting for MACD confirmation before executing trades, thereby reducing false signals.
Components:
Simple Moving Average (SMA):
The SMA is calculated over a user-defined period (default: 20 bars) and serves as a trend indicator. It provides a smoothed representation of price action and helps traders identify the overall market direction.
MACD:
The MACD is calculated using standard parameters (12 for fast length, 26 for slow length, and 9 for signal length) but can be adjusted to suit individual trading preferences. The MACD consists of two lines:
MACD Line: The difference between the fast and slow EMAs.
Signal Line: An EMA of the MACD Line, which helps indicate buy and sell conditions.
Buy and Sell Signals:
Buy Signal: A buy signal is triggered when the price crosses above the SMA, coupled with the MACD line crossing above the signal line, indicating a bullish momentum.
Sell Signal: A sell signal occurs when the price crosses below the SMA, alongside the MACD line crossing below the signal line, indicating a bearish momentum.
Visual Features:
The SMA is plotted on the main price chart, allowing traders to easily visualize trend direction.
Buy signals are indicated by green triangle shapes below the price bars, while sell signals are shown by red triangle shapes above the price bars.
Optionally, a MACD histogram can be plotted to visualize the difference between the MACD line and the signal line, helping to confirm trade signals visually.
Usage:
This indicator is suitable for various trading styles, including day trading, swing trading, and trend-following strategies. It can be applied to any financial instrument, including stocks, forex, and cryptocurrencies.
Traders should consider combining this indicator with additional tools and analysis to enhance decision-making and manage risk effectively.

Trend Lines, Supports and Resistances█ OVERVIEW
This is a simple script that draws trend lines, supports and resistances based on the highs and lows of pivots and is developed solely for practice purposes while learning the Pine Script language.
█ FEATURES:
Ability to change pivot length and mark pivots on chart.
Ability to change amount of pivot points that used to generate trend lines or support and resistances.
Ability to set exception for last "n" bars for breaks.
Ability to set exception up to "n" times for breaks.
Ability to see broken trend lines as ghosts.
Ability to set alarms for breaks.
Ability to change colors and line widths.
And many more...
█ DISCLAIMER:
Trading is risky and most of the day traders lose money eventually. This indicator is only for educational purposes and should not be construed as financial advice. Past performances does not guarantee future results.
