Proactive Execution MachineProactive Execution Machine: Multi-State Momentum Engine
Overview
The Proactive Execution Machine is a comprehensive trading workspace designed to filter market noise and highlight high-probability execution windows. It combines Dynamic Supply/Demand Zones, Manual Level Proximity, and a proprietary Dual-Candle Momentum Scoring system to categorize the market into specific "States" in real-time.
Instead of a simple arrow, this script provides a System Status dashboard that tells you exactly what phase the market is in—whether it's "Level Absorption," a "Demand Vortex," or a "Tired Trend. "Core Components
1. The Momentum Gauge (Bottom Left)
This table provides a deep-dive into order flow by scoring the last two candles based on:
Close Location: Where price closed relative to its range (Upper, Middle, Lower).
Body-to-Wick Ratio: Measuring the "effort vs. result" of the move.
Range Relativity: Whether the current bar is an "Inside" or "Outside" bar relative to the previous candle.
Slope (Linear Regression): A real-time trendline of momentum strength to see if conviction is accelerating or decelerating.
2. Dynamic State Engine The script automatically identifies and colors the chart into three primary zones:
Supply Zone (Red): The upper 30% of the recent price discovery range.
Demand Zone (Green): The lower 30% of the recent price discovery range.
Proximity Zones: When price nears your Manual Levels (PDH, PDL, NY Open, etc.), the engine switches priority to monitor for "Breakouts" or "Level Attacks."
3. System Status (Bottom Right)The dynamic HUD changes size and color based on conviction levels. It will notify you of specific market conditions:
Supply/Demand Overrun: When momentum is so strong it is smashing through reversal zones. Level Absorption/Stalling: When price reaches a key level but momentum has "flattened," suggesting a potential reversal or high-volume churn.
Buy/Sell Now: High-conviction signals triggered only when Location (Zone) and Momentum (Score) align.
How to Trade with the "Machine"
For Trend Followers: Look for the status "TREND (ACTIVE)" combined with a Momentum Score of $\pm 4$ or higher.
For Reversion Traders: Watch for "WATCH LONGS/SHORTS" when price enters a Supply or Demand zone. Wait for the status to flip to "BUY/SELL NOW" as momentum begins to shift back toward the mean.
For Level Traders: Input your daily levels (VAH, VAL, POC) in the settings. The machine will automatically prioritize these levels, changing status to "AT LEVEL" the moment price enters your specified proximity.
Key Settings
Manual Levels: Input up to 5 custom price levels for the proximity engine.
Proximity Sensitivity: Adjust how close price must be to a level (in points/pips) to trigger an "At Level" state.
Aggression (1-5): Tuning the pivot detection. Lower numbers respond faster to micro-structure; higher numbers focus on major swing points.
Visual Coding
Candle bodies are colored to assist with single candle pattern detection:
Lime/Pink Bar Highlights: The script uses a custom color engine to highlight "Shaved" (Marubozu) bars.
Lime indicates aggressive bullish conviction, while Pink (Fuchsia) highlights aggressive bearish conviction.
Green indicates bull engulfing candle
Red indicates bear engulfing candle
Orange is an outside bar
Yellow an inside bar
Gray a Doji bar
Black all other bars
Dynamic Zones: The chart features two primary background areas:
Red Zone (Top): The Supply Zone, identifying where sellers historically reclaim control.
Green Zone (Bottom): The Demand Zone, identifying where buyers historically step in.
System Status HUD (Bottom Right): This is the "brain" of the machine. The text size is adjusted to attract the trader's attention when the slope of the momentum increases above 5 (bullish expansion) or greater than - 5 (Bearish expansion). The system status changes color based on the market state too:
HUD Coloring:
Aqua: Active Bullish Trend.
Gray: Bull trend tired.
Orange: Active Bearish Trend.
Gray: Bear trend tired.
Red: For sell now.
Green: For buy now.
Lime: Bull price level under attack.
Marron: Bear price level under attack.
Gray: Price level absorption.
Yellow: Price at level and stalling.
Maroon: An "Overrun" or "Vortex" where price is smashing through supply/demand with extreme momentum.
The text size serves as a "Volatility Alarm." * When the text is Small, the market is in a "sideways" or "absorbing" state. You should be cautious about entering new trend trades.
When the text is Large, the Machine has detected that "Aggressive" participants have entered the order flow. This is your cue that a "Level Attack" or a "Trend Breakout" is currently in progress.
The 1-Minute Tactical Setup Guide:
Proactive Execution Machine Operating on the 1-minute (1m) timeframe requires a balance between speed and noise filtration. Because the Proactive Execution Machine uses a "State Engine" logic, it is uniquely suited for the high-velocity environment of the NY Open.
I follow these three tactical steps to optimize the chart for the 1m timeframe:
Step 1: Calibrate the "Proximity Sensitivity" On a 1m chart, a "Level" isn't a single price—it's a zone.
Adjustment: In the script settings, set your Proximity Sensitivity to a value that represents the average "noise" of your instrument.
For ES (S&P 500 Futures): 1.5 to 2.5 points.
For NQ (Nasdaq Futures): 5 to 10 points.
For Forex (EURUSD): 1 to 2 pips.
The Goal: You want the "AT LEVEL" status to trigger just as price is "sniffing" the level, giving you time to prepare your order before the touch.
Step 2: Watch the "History" Column in the Momentum Gauge
The bottom-left table is your most important tool for the 1m chart. It shows you the momentum of the last three bars ($T-0$, $T-1$, $T-2$).
Momentum Sequence: Look for a "Sequence of Three." If you see $T-2$ (Neutral), $T-1$ (Long), and $T-0$ (STR Long), you have a momentum explosion.
The Trap: If you see STR LONG followed immediately by a NEUTRAL bar while in a Supply Zone, the "Machine" will shift to "SUPPLY STALLING." This is your signal to tighten your trailing stop or take profit—it means the bulls are hitting a wall of sell orders.
Step 3: The "Level Attack" Execution
The script features a unique state called "LEVEL ATTACK." This is designed specifically for breakout/breakdown traders.
The Setup: Price is approaching a Manual Level (like the NY Open or PDH).
The Signal: If the status changes to "LEVEL ATTACK (BULL)," it means the momentum score is high ($>3$) and the slope is positive while within the proximity of the level.
The Action: This is a "Proactive" entry. Instead of waiting for the candle to close above the level, you are entering as the "Machine" detects institutional pressure "attacking" the level.
Daily Routine for the "Machine"
1) 09:25 AM: Input your 5 manual levels (PDH, PDL, NY Open, VAH, VAL).
2) 09:30 AM: Wait for the first 5 minutes of volatility to settle.
3) The Window: Look for the System Status to move from "IDLE" to a colored state.
4) The Trigger: Never take a signal if the Momentum Gauge is in the "Neutral" (Yellow) zone. Only execute when the gauge shows LONG/SHORT or STR LONG/STR SHORT.
Cerca negli script per "trendline"

Multi-Fractal Trading Plan [Gemini] v22Multi-Fractal Trading Plan
The Multi-Fractal Trading Plan is a quantitative market structure engine designed to filter noise and generate actionable daily strategies. Unlike standard auto-trendline indicators that clutter charts with irrelevant data, this system utilizes Fractal Geometry to categorize market liquidity into three institutional layers: Minor (Intraday), Medium (Swing), and Major (Institutional).
This tool functions as a Strategic Advisor, not just a drawing tool. It calculates the delta between price and structural pivots in real-time, alerting you when price enters high-probability "Hot Zones" and generating a live trading plan on your dashboard.
Core Features
1. Three-Tier Fractal Engine The algorithm tracks 15 distinct fractal lengths simultaneously, aggregating them into a clean hierarchy:
Minor Structure (Thin Lines): Captures high-frequency volatility for scalping.
Medium Structure (Medium Lines): Identifies significant swing points and intermediate targets.
Major Structure (Thick Lines): Maps the "Institutional" defense lines where trend reversals and major breakouts occur.
2. The Strategic Dashboard A dynamic data panel in the bottom-right eliminates analysis paralysis:
Floor & Ceiling Targets: Displays the precise price levels of the nearest Support and Resistance.
AI Logic Output: The script analyzes market conditions to generate a specific command, such as "WATCH FOR BREAKOUT", "Near Lows (Look Long?)", or "WAIT (No Setup)".
3. "Hot Zone" Detection Never miss a critical test of structure.
Dynamic Alerting: When price trades within 1% (adjustable) of a Major Trend Line, the indicator’s labels turn Bright Yellow and flash a warning (e.g., "⚠️ WATCH: MAJOR RES").
Focus: This visual cue highlights the exact moment execution is required, reducing screen fatigue.
4. The Quant Web & Markers
Pivot Validation: Deep blue fractal markers (▲/▼) identify the exact candles responsible for the structure.
Inter-Timeframe Web: Faint dotted lines connect Minor pivots directly to Major pivots, visualizing the "hidden" elasticity between short-term noise and long-term trend anchors.
5. Enterprise Stability Engine Engineered to solve the "Vertical Line" and "1970 Epoch" glitches common in Pine Script trend indicators. This engine is optimized for Futures (NQ/ES), Forex, and Crypto, ensuring stability across all timeframes (including gaps on ETH/RTH charts).
Operational Guide
Consult the Dashboard: Before executing, check the "Strategy" output. If it says "WAIT", the market is in chop. If it says "WATCH FOR BOUNCE", prepare your entry criteria.
Monitor Hot Zones: A Yellow Label indicates price is testing a major liquidity level. This is your signal to watch for a rejection wick or a high-volume breakout.
Utilize the Web: Use the faint web lines to find "confluence" where a short-term pullback aligns with a long-term trend line.
Configuration
Show History: Toggles "Ghost Lines" (Blue) to display historical structure and broken trends.
Fractal Points: Toggles the geometric pivot markers.
Hot Zone %: Adjusts the sensitivity of the Yellow Warning system (Default: 1%).
Max Line Length: A noise filter that removes stale or "spiderweb" lines that are no longer statistically relevant.

EMA 1 & SALMA Intersection StrategyTrading Strategy: EMA 1 & SALMA Crossover System
This strategy is a Trend-Following system that focuses on the direct interaction between the price (represented by EMA 1) and a smoothed trendline (SALMA). Instead of relying on the color changes of the indicator, it uses mechanical crossover signals to enter and exit trades.
1. Indicators Used
EMA 1 (Exponential Moving Average): Since the period is 1, it effectively represents the Current Price. It reacts instantly to every market move.
SALMA v3.0 (Smoothed Adaptive Lattice Moving Average): A double-smoothed moving average that acts as the "Base Line" or "Trend Support/Resistance."
RSI (Relative Strength Index): Used as a Momentum Filter to ensure we don't trade against the market's strength.
2. Buy (Long) Entry Rules
You enter a Long position when the following conditions are met:
The Crossover: The EMA 1 (Price) crosses ABOVE the SALMA line. This indicates that the short-term momentum is shifting higher than the average trend.
The Filter (RSI): The RSI must be above 50. This confirms that the buyers are in control and the upward move has enough strength.
3. Sell (Short) Entry Rules
You enter a Short position when the following conditions are met:
The Crossunder: The EMA 1 (Price) crosses BELOW the SALMA line. This indicates a breakdown in price action.
The Filter (RSI): The RSI must be below 50. This confirms that the sellers are dominating and the downward momentum is real.
4. Key Advantages of This System
Objectivity: You don't guess based on the color of the line; you wait for a clear physical break (cross) of the line.
Precision: By using EMA 1, you get the earliest possible entry signal compared to slower moving averages.
False Signal Protection: The RSI 50 filter prevents you from entering "weak" trades where the price crosses the line but lacks the volume or momentum to continue.

Shock Wave: EMA9 Slope / ATR (Normalized) for SPYShock Wave – EMA9 Slope Normalized by ATR (Fragility Gauge)
This indicator measures trend fragility, not direction.
Instead of relying on visual trendline angles (which change with zoom and chart scaling), this tool normalizes the slope of the 9-EMA by ATR, producing a scale-independent steepness metric that remains consistent across timeframes and zoom levels.
The goal is to identify late-stage acceleration and liquidity vulnerability — conditions where price is advancing faster than inventory can rebalance and the market becomes sensitive to forced liquidation.
What this indicator shows
Normalized EMA9 slope (ATR per bar)
An angle-like degree value derived from the normalized slope (for intuition only)
Background shading to highlight trend maturity / fragility
A compact table showing live readings on the chart
How to interpret
Green / low values (< ~0.30 ATR/bar): Healthy, sustainable trend
Orange / mid values (~0.30–0.40 ATR/bar): Late-stage acceleration
Red / high values (≥ ~0.45 ATR/bar): Fragile / liquidation-prone conditions
These thresholds are empirically derived from historical index behavior (e.g., SPY prior to 2018, 2020, 2022 volatility events).
Important notes
This is not a buy or sell signal
Red does not mean “short”
The indicator highlights risk asymmetry, not timing
Best used on higher timeframes (weekly) in conjunction with liquidity, inducement, and higher-timeframe structure analysis
Why use this
Markets often fail after strong trends, not because they are weak, but because they are crowded. This tool helps quantify when a trend has become structurally vulnerable, providing context for liquidity-based frameworks and macro risk management.

DCA Ladder CalculatorThis script is a DCA (Dollar-Cost Averaging) Ladder Calculator with Risk & Leverage Management baked in.
It’s designed for both LONG and SHORT positions, and helps you:
🎯 Strategically scale into positions across multiple entry points
🔐 Control risk exposure via defined capital allocation
⚖️ Utilize leverage responsibly — for efficiency, not destruction
🧮 Visualize risk, stop loss level, and entry distribution
🔁 Adapt to trend reversals or key zones, especially when combined with reversal indicators or higher timeframe signals
🧠 How It Works
This tool takes a capital allocation approach to building a ladder of positions:
1. You define:
- Portfolio value
- Risk per trade (as %)
- Leverage
- Number of DCA levels
- Entry multiplier (e.g. 1x, 2x, 4x...)
2. The script then:
- Calculates total margin to risk = Portfolio × Risk %
- Calculates total leveraged position size = Margin × Leverage
- Distributes entries according to exponential weights (1x, 2x, 4x...), totaling 7 for 3 levels
- Calculates per-entry:
- Entry price (based on price zone spacing)
- Multiplier
- Exact margin per entry
- Leverage per entry (margin × leverage)
- Computes:
- Average entry price (margin-weighted)
- Approximate stop loss level based on recent ATR and price structure
- % drawdown to SL
- Total margin and position size
3. Displays all this in a clean on-chart table.
📈 How to Use It
1. Apply the indicator to a chart (default: 1D — ideal for clean zones).
2. Configure your:
- Portfolio Value (total trading capital)
- Risk per Trade (%) (your acceptable loss)
- Leverage (exchange or strategy-based)
- DCA Levels (e.g. 3 = anchor + 2 entries)
- Multiplier (typically 2.0 for doubling)
3. Choose LONG or SHORT mode depending on direction.
4. The table will show:
- Entry price ladder
- Margin used per entry
- Total position size
- Approx. stop loss (where your full risk is defined)
Use in conjunction with price action, S/R zones, trendline breaks, volume divergence, or reversal indicators.
✅ Best Practices for Using This Tool
- Leverage is a tool, not a weapon. Use it to scale smartly — not recklessly.
- Use fewer, higher-conviction entries. Don’t blindly ladder; combine with price structure and signals.
- Stick to your risk percent. Never risk more than you can afford to lose. Let this calculator enforce discipline.
- Combine with other confirmation tools, like RSI divergence, momentum shifts, OB zones, etc.
- Avoid martingale-style over-exposure. This is not a gambling tool — it’s for capital efficiency.
🛡️ What This Tool Does NOT Do
- This is not a trade signal indicator.
- It does not place trades or auto-manage positions.
- It does not replace personal responsibility or strategy — it's a tool to help apply structure.
⚠️ Disclaimer
This script is for educational and informational purposes only.
It does not constitute financial advice, nor is it a recommendation to buy or sell any financial instrument.
Always consult a licensed financial advisor before making investment decisions.
Use of leverage involves high risk and can lead to substantial losses.
The author and publisher assume no liability for any trading losses resulting from use of this script.

EMA Signals + HTF S/R + Diagonal (5-15m)Описание на русском
Скрипт строит две экспоненциальные скользящие средние (быструю и медленную EMA), а также SMA20 и SMA50, и использует их для генерации пошаговых сигналов входа. При пересечении EMA9 и EMA12 вверх выше SMA20 под свечой появляется зелёный круг, а когда после этого обе EMA оказываются выше SMA50, под ценой появляется плашка LONG; аналогично при пересечении вниз ниже SMA20 рисуется красный круг над свечой, и после ухода EMA под SMA50 формируется плашка SHORT.
Горизонтальные зоны поддержки и сопротивления вычисляются по пивотам старшего таймфрейма (по умолчанию 1 час) через request.security, каждая зона рисуется прямоугольником на графике и сопровождается подписью с ценой уровня и текущим количеством касаний ценой (Touches: N), которое считается на активном ТФ. Дополнительно скрипт строит одну диагональную линию поддержки: она протягивается от последнего ключевого минимума (pivot low с заданной «силой») к текущей цене и динамически обновляется при появлении нового важного минимума, рядом с линией отображается подпись Trend.
Description in English
This script combines EMA‑based signals, dynamic higher‑timeframe support/resistance zones, and a diagonal trendline from the latest key swing low. It plots two exponential moving averages (fast and slow EMA) along with SMA20 and SMA50, and uses them to create step‑by‑step entry signals: when EMA9 crosses above EMA12 while both are above SMA20, a green circle is shown below the bar, and once both EMAs move above SMA50 after that, a LONG label is printed below price; conversely, when EMA9 crosses below EMA12 while both are below SMA20, a red circle appears above the bar, and after both EMAs move below SMA50, a SHORT label is displayed above price.
Horizontal support and resistance zones are derived from pivot highs and lows on a higher timeframe (1‑hour by default) using request.security; each zone is drawn as a rectangle on the chart and annotated with the level price and the current number of touches by price (Touches: N), counted on the active timeframe. In addition, the script plots a single diagonal support line from the most recent key swing low (pivot low with configurable strength) towards the current price, updating it whenever a new important low appears, and shows a small “Trend” label near this line

ADX Forecast Colorful [DiFlip]ADX Forecast Colorful
Introducing one of the most advanced ADX indicators available — a fully customizable analytical tool that integrates forward-looking forecasting capabilities. ADX Forecast Colorful is a scientific evolution of the classic ADX, designed to anticipate future trend strength using linear regression. Instead of merely reacting to historical data, this indicator projects the future behavior of the ADX, giving traders a strategic edge in trend analysis.
⯁ Real-Time ADX Forecasting
For the first time, a public ADX indicator incorporates linear regression (least squares method) to forecast the future behavior of ADX. This breakthrough approach enables traders to anticipate trend strength changes based on historical momentum. By applying linear regression to the ADX, the indicator plots a projected trendline n periods ahead — helping users make more accurate and timely trading decisions.
⯁ Highly Customizable
The indicator adapts seamlessly to any trading style. It offers a total of 26 long entry conditions and 26 short entry conditions, making it one of the most configurable ADX tools on TradingView. Each condition is fully adjustable, enabling the creation of statistical, quantitative, and automated strategies. You maintain full control over the signals to align perfectly with your system.
⯁ Innovative and Science-Based
This is the first public ADX indicator to apply least-squares predictive modeling to ADX dynamics. Technically, it embeds machine learning logic into a traditional trend-strength indicator. Using linear regression as a predictive engine adds powerful statistical rigor to the ADX, turning it into an intelligent, forward-looking signal generator.
⯁ Scientific Foundation: Linear Regression
Linear regression is a fundamental method in statistics and machine learning used to model the relationship between a dependent variable y and one or more independent variables x. The basic formula for simple linear regression is:
y = β₀ + β₁x + ε
Where:
y = predicted value (e.g., future ADX)
x = explanatory variable (e.g., bar index or time)
β₀ = intercept
β₁ = slope (rate of change)
ε = random error term
The goal is to estimate β₀ and β₁ by minimizing the sum of squared errors. This is achieved using the least squares method, ensuring the best linear fit to historical data. Once the coefficients are calculated, the model extends the regression line forward, generating the ADX projection based on recent trends.
⯁ Least Squares Estimation
To minimize the error, the regression coefficients are calculated as:
β₁ = Σ((xᵢ - x̄)(yᵢ - ȳ)) / Σ((xᵢ - x̄)²)
β₀ = ȳ - β₁x̄
Where:
Σ = summation
x̄ and ȳ = means of x and y
i ranges from 1 to n (number of data points)
These formulas provide the best linear unbiased estimator under Gauss-Markov conditions — assuming constant variance and linearity.
⯁ Linear Regression in Machine Learning
Linear regression is a foundational algorithm in supervised learning. Its power in producing quantitative predictions makes it essential in AI systems, predictive analytics, time-series forecasting, and automated trading. Applying it to the ADX essentially places an intelligent forecasting engine inside a classic trend tool.
⯁ Visual Interpretation
Imagine an ADX time series like this:
Time →
ADX →
The regression line smooths these values and projects them n periods forward, creating a predictive trajectory. This forecasted ADX line can intersect with the actual ADX, offering smarter buy and sell signals.
⯁ Summary of Scientific Concepts
Linear Regression: Models variable relationships with a straight line.
Least Squares: Minimizes prediction errors for best fit.
Time-Series Forecasting: Predicts future values using historical data.
Supervised Learning: Trains models to predict outcomes from inputs.
Statistical Smoothing: Reduces noise and highlights underlying trends.
⯁ Why This Indicator Is Revolutionary
Scientifically grounded: Based on rigorous statistical theory.
Unprecedented: First public ADX using least-squares forecast modeling.
Smart: Uses machine learning logic.
Forward-Looking: Generates predictive, not just reactive, signals.
Customizable: Flexible for any strategy or timeframe.
⯁ Conclusion
By merging ADX and linear regression, this indicator enables traders to predict market momentum rather than merely follow it. ADX Forecast Colorful is not just another indicator — it’s a scientific leap forward in technical analysis. With 26 fully configurable entry conditions and smart forecasting, this open-source tool is built for creating cutting-edge quantitative strategies.
⯁ Example of simple linear regression with one independent variable
This example demonstrates how a basic linear regression works when there is only one independent variable influencing the dependent variable. This type of model is used to identify a direct relationship between two variables.
⯁ In linear regression, observations (red) are considered the result of random deviations (green) from an underlying relationship (blue) between a dependent variable (y) and an independent variable (x)
This concept illustrates that sampled data points rarely align perfectly with the true trend line. Instead, each observed point represents the combination of the true underlying relationship and a random error component.
⯁ Visualizing heteroscedasticity in a scatterplot with 100 random fitted values using Matlab
Heteroscedasticity occurs when the variance of the errors is not constant across the range of fitted values. This visualization highlights how the spread of data can change unpredictably, which is an important factor in evaluating the validity of regression models.
⯁ The datasets in Anscombe’s quartet were designed to have nearly the same linear regression line (as well as nearly identical means, standard deviations, and correlations) but look very different when plotted
This classic example shows that summary statistics alone can be misleading. Even with identical numerical metrics, the datasets display completely different patterns, emphasizing the importance of visual inspection when interpreting a model.
⯁ Result of fitting a set of data points with a quadratic function
This example illustrates how a second-degree polynomial model can better fit certain datasets that do not follow a linear trend. The resulting curve reflects the true shape of the data more accurately than a straight line.
⯁ What is the ADX?
The Average Directional Index (ADX) is a technical analysis indicator developed by J. Welles Wilder. It measures the strength of a trend in a market, regardless of whether the trend is up or down.
The ADX is an integral part of the Directional Movement System, which also includes the Plus Directional Indicator (+DI) and the Minus Directional Indicator (-DI). By combining these components, the ADX provides a comprehensive view of market trend strength.
⯁ How to use the ADX?
The ADX is calculated based on the moving average of the price range expansion over a specified period (usually 14 periods). It is plotted on a scale from 0 to 100 and has three main zones:
Strong Trend: When the ADX is above 25, indicating a strong trend.
Weak Trend: When the ADX is below 20, indicating a weak or non-existent trend.
Neutral Zone: Between 20 and 25, where the trend strength is unclear.
⯁ Entry Conditions
Each condition below is fully configurable and can be combined to build precise trading logic.
📈 BUY
🅰️ Signal Validity: The signal will remain valid for X bars .
🅰️ Signal Sequence: Configurable as AND or OR .
🅰️ +DI > -DI
🅰️ +DI < -DI
🅰️ +DI > ADX
🅰️ +DI < ADX
🅰️ -DI > ADX
🅰️ -DI < ADX
🅰️ ADX > Threshold
🅰️ ADX < Threshold
🅰️ +DI > Threshold
🅰️ +DI < Threshold
🅰️ -DI > Threshold
🅰️ -DI < Threshold
🅰️ +DI (Crossover) -DI
🅰️ +DI (Crossunder) -DI
🅰️ +DI (Crossover) ADX
🅰️ +DI (Crossunder) ADX
🅰️ +DI (Crossover) Threshold
🅰️ +DI (Crossunder) Threshold
🅰️ -DI (Crossover) ADX
🅰️ -DI (Crossunder) ADX
🅰️ -DI (Crossover) Threshold
🅰️ -DI (Crossunder) Threshold
🔮 +DI (Crossover) -DI Forecast
🔮 +DI (Crossunder) -DI Forecast
🔮 ADX (Crossover) +DI Forecast
🔮 ADX (Crossunder) +DI Forecast
📉 SELL
🅰️ Signal Validity: The signal will remain valid for X bars .
🅰️ Signal Sequence: Configurable as AND or OR .
🅰️ +DI > -DI
🅰️ +DI < -DI
🅰️ +DI > ADX
🅰️ +DI < ADX
🅰️ -DI > ADX
🅰️ -DI < ADX
🅰️ ADX > Threshold
🅰️ ADX < Threshold
🅰️ +DI > Threshold
🅰️ +DI < Threshold
🅰️ -DI > Threshold
🅰️ -DI < Threshold
🅰️ +DI (Crossover) -DI
🅰️ +DI (Crossunder) -DI
🅰️ +DI (Crossover) ADX
🅰️ +DI (Crossunder) ADX
🅰️ +DI (Crossover) Threshold
🅰️ +DI (Crossunder) Threshold
🅰️ -DI (Crossover) ADX
🅰️ -DI (Crossunder) ADX
🅰️ -DI (Crossover) Threshold
🅰️ -DI (Crossunder) Threshold
🔮 +DI (Crossover) -DI Forecast
🔮 +DI (Crossunder) -DI Forecast
🔮 ADX (Crossover) +DI Forecast
🔮 ADX (Crossunder) +DI Forecast
🤖 Automation
All BUY and SELL conditions are compatible with TradingView alerts, making them ideal for fully or semi-automated systems.
⯁ Unique Features
Linear Regression: (Forecast)
Signal Validity: The signal will remain valid for X bars
Signal Sequence: Configurable as AND/OR
Condition Table: BUY/SELL
Condition Labels: BUY/SELL
Plot Labels in the Graph Above: BUY/SELL
Automate and Monitor Signals/Alerts: BUY/SELL
Background Colors: "bgcolor"
Background Colors: "fill"
Linear Regression (Forecast)
Signal Validity: The signal will remain valid for X bars
Signal Sequence: Configurable as AND/OR
Table of Conditions: BUY/SELL
Conditions Label: BUY/SELL
Plot Labels in the graph above: BUY/SELL
Automate & Monitor Signals/Alerts: BUY/SELL
Background Colors: "bgcolor"
Background Colors: "fill"

RSI Forecast Colorful [DiFlip]RSI Forecast Colorful
Introducing one of the most complete RSI indicators available — a highly customizable analytical tool that integrates advanced prediction capabilities. RSI Forecast Colorful is an evolution of the classic RSI, designed to anticipate potential future RSI movements using linear regression. Instead of simply reacting to historical data, this indicator provides a statistical projection of the RSI’s future behavior, offering a forward-looking view of market conditions.
⯁ Real-Time RSI Forecasting
For the first time, a public RSI indicator integrates linear regression (least squares method) to forecast the RSI’s future behavior. This innovative approach allows traders to anticipate market movements based on historical trends. By applying Linear Regression to the RSI, the indicator displays a projected trendline n periods ahead, helping traders make more informed buy or sell decisions.
⯁ Highly Customizable
The indicator is fully adaptable to any trading style. Dozens of parameters can be optimized to match your system. All 28 long and short entry conditions are selectable and configurable, allowing the construction of quantitative, statistical, and automated trading models. Full control over signals ensures precise alignment with your strategy.
⯁ Innovative and Science-Based
This is the first public RSI indicator to apply least-squares predictive modeling to RSI calculations. Technically, it incorporates machine-learning logic into a classic indicator. Using Linear Regression embeds strong statistical foundations into RSI forecasting, making this tool especially valuable for traders seeking quantitative and analytical advantages.
⯁ Scientific Foundation: Linear Regression
Linear regression is a fundamental statistical method that models the relationship between a dependent variable y and one or more independent variables x. The general formula for simple linear regression is:
y = β₀ + β₁x + ε
where:
y = predicted variable (e.g., future RSI value)
x = explanatory variable (e.g., bar index or time)
β₀ = intercept (value of y when x = 0)
β₁ = slope (rate of change of y relative to x)
ε = random error term
The goal is to estimate β₀ and β₁ by minimizing the sum of squared errors. This is achieved using the least squares method, ensuring the best linear fit to historical data. Once the coefficients are calculated, the model extends the regression line forward, generating the RSI projection based on recent trends.
⯁ Least Squares Estimation
To minimize the error between predicted and observed values, we use the formulas:
β₁ = Σ((xᵢ - x̄)(yᵢ - ȳ)) / Σ((xᵢ - x̄)²)
β₀ = ȳ - β₁x̄
Σ denotes summation; x̄ and ȳ are the means of x and y; and i ranges from 1 to n (number of observations). These equations produce the best linear unbiased estimator under the Gauss–Markov assumptions — constant variance (homoscedasticity) and a linear relationship between variables.
⯁ Linear Regression in Machine Learning
Linear regression is a foundational component of supervised learning. Its simplicity and precision in numerical prediction make it essential in AI, predictive algorithms, and time-series forecasting. Applying regression to RSI is akin to embedding artificial intelligence inside a classic indicator, adding a new analytical dimension.
⯁ Visual Interpretation
Imagine a time series of RSI values like this:
Time →
RSI →
The regression line smooths these historical values and projects itself n periods forward, creating a predictive trajectory. This projected RSI line can cross the actual RSI, generating sophisticated entry and exit signals. In summary, the RSI Forecast Colorful indicator provides both the current RSI and the forecasted RSI, allowing comparison between past and future trend behavior.
⯁ Summary of Scientific Concepts Used
Linear Regression: Models relationships between variables using a straight line.
Least Squares: Minimizes squared prediction errors for optimal fit.
Time-Series Forecasting: Predicts future values from historical patterns.
Supervised Learning: Predictive modeling based on known output values.
Statistical Smoothing: Reduces noise to highlight underlying trends.
⯁ Why This Indicator Is Revolutionary
Scientifically grounded: Built on statistical and mathematical theory.
First of its kind: The first public RSI with least-squares predictive modeling.
Intelligent: Incorporates machine-learning logic into RSI interpretation.
Forward-looking: Generates predictive, not just reactive, signals.
Customizable: Exceptionally flexible for any strategic framework.
⯁ Conclusion
By combining RSI and linear regression, the RSI Forecast Colorful allows traders to predict market momentum rather than simply follow it. It's not just another indicator: it's a scientific advancement in technical analysis technology. Offering 28 configurable entry conditions and advanced signals, this open-source indicator paves the way for innovative quantitative systems.
⯁ Example of simple linear regression with one independent variable
This example demonstrates how a basic linear regression works when there is only one independent variable influencing the dependent variable. This type of model is used to identify a direct relationship between two variables.
⯁ In linear regression, observations (red) are considered the result of random deviations (green) from an underlying relationship (blue) between a dependent variable (y) and an independent variable (x)
This concept illustrates that sampled data points rarely align perfectly with the true trend line. Instead, each observed point represents the combination of the true underlying relationship and a random error component.
⯁ Visualizing heteroscedasticity in a scatterplot with 100 random fitted values using Matlab
Heteroscedasticity occurs when the variance of the errors is not constant across the range of fitted values. This visualization highlights how the spread of data can change unpredictably, which is an important factor in evaluating the validity of regression models.
⯁ The datasets in Anscombe’s quartet were designed to have nearly the same linear regression line (as well as nearly identical means, standard deviations, and correlations) but look very different when plotted
This classic example shows that summary statistics alone can be misleading. Even with identical numerical metrics, the datasets display completely different patterns, emphasizing the importance of visual inspection when interpreting a model.
⯁ Result of fitting a set of data points with a quadratic function
This example illustrates how a second-degree polynomial model can better fit certain datasets that do not follow a linear trend. The resulting curve reflects the true shape of the data more accurately than a straight line.
⯁ What Is RSI?
The RSI (Relative Strength Index) is a technical indicator developed by J. Welles Wilder. It measures the velocity and magnitude of recent price movements to identify overbought and oversold conditions. The RSI ranges from 0 to 100 and is commonly used to identify potential reversals and evaluate trend strength.
⯁ How RSI Works
RSI is calculated from average gains and losses over a set period (commonly 14 bars) and plotted on a 0–100 scale. It consists of three key zones:
Overbought: RSI above 70 may signal an overbought market.
Oversold: RSI below 30 may signal an oversold market.
Neutral Zone: RSI between 30 and 70, indicating no extreme condition.
These zones help identify potential price reversals and confirm trend strength.
⯁ Entry Conditions
All conditions below are fully customizable and allow detailed control over entry signal creation.
📈 BUY
🧲 Signal Validity: Signal remains valid for X bars.
🧲 Signal Logic: Configurable using AND or OR.
🧲 RSI > Upper
🧲 RSI < Upper
🧲 RSI > Lower
🧲 RSI < Lower
🧲 RSI > Middle
🧲 RSI < Middle
🧲 RSI > MA
🧲 RSI < MA
🧲 MA > Upper
🧲 MA < Upper
🧲 MA > Lower
🧲 MA < Lower
🧲 RSI (Crossover) Upper
🧲 RSI (Crossunder) Upper
🧲 RSI (Crossover) Lower
🧲 RSI (Crossunder) Lower
🧲 RSI (Crossover) Middle
🧲 RSI (Crossunder) Middle
🧲 RSI (Crossover) MA
🧲 RSI (Crossunder) MA
🧲 MA (Crossover)Upper
🧲 MA (Crossunder)Upper
🧲 MA (Crossover) Lower
🧲 MA (Crossunder) Lower
🧲 RSI Bullish Divergence
🧲 RSI Bearish Divergence
🔮 RSI (Crossover) Forecast MA
🔮 RSI (Crossunder) Forecast MA
📉 SELL
🧲 Signal Validity: Signal remains valid for X bars.
🧲 Signal Logic: Configurable using AND or OR.
🧲 RSI > Upper
🧲 RSI < Upper
🧲 RSI > Lower
🧲 RSI < Lower
🧲 RSI > Middle
🧲 RSI < Middle
🧲 RSI > MA
🧲 RSI < MA
🧲 MA > Upper
🧲 MA < Upper
🧲 MA > Lower
🧲 MA < Lower
🧲 RSI (Crossover) Upper
🧲 RSI (Crossunder) Upper
🧲 RSI (Crossover) Lower
🧲 RSI (Crossunder) Lower
🧲 RSI (Crossover) Middle
🧲 RSI (Crossunder) Middle
🧲 RSI (Crossover) MA
🧲 RSI (Crossunder) MA
🧲 MA (Crossover)Upper
🧲 MA (Crossunder)Upper
🧲 MA (Crossover) Lower
🧲 MA (Crossunder) Lower
🧲 RSI Bullish Divergence
🧲 RSI Bearish Divergence
🔮 RSI (Crossover) Forecast MA
🔮 RSI (Crossunder) Forecast MA
🤖 Automation
All BUY and SELL conditions can be automated using TradingView alerts. Every configurable condition can trigger alerts suitable for fully automated or semi-automated strategies.
⯁ Unique Features
Linear Regression Forecast
Signal Validity: Keep signals active for X bars
Signal Logic: AND/OR configuration
Condition Table: BUY/SELL
Condition Labels: BUY/SELL
Chart Labels: BUY/SELL markers above price
Automation & Alerts: BUY/SELL
Background Colors: bgcolor
Fill Colors: fill
Linear Regression Forecast
Signal Validity: Keep signals active for X bars
Signal Logic: AND/OR configuration
Condition Table: BUY/SELL
Condition Labels: BUY/SELL
Chart Labels: BUY/SELL markers above price
Automation & Alerts: BUY/SELL
Background Colors: bgcolor
Fill Colors: fill

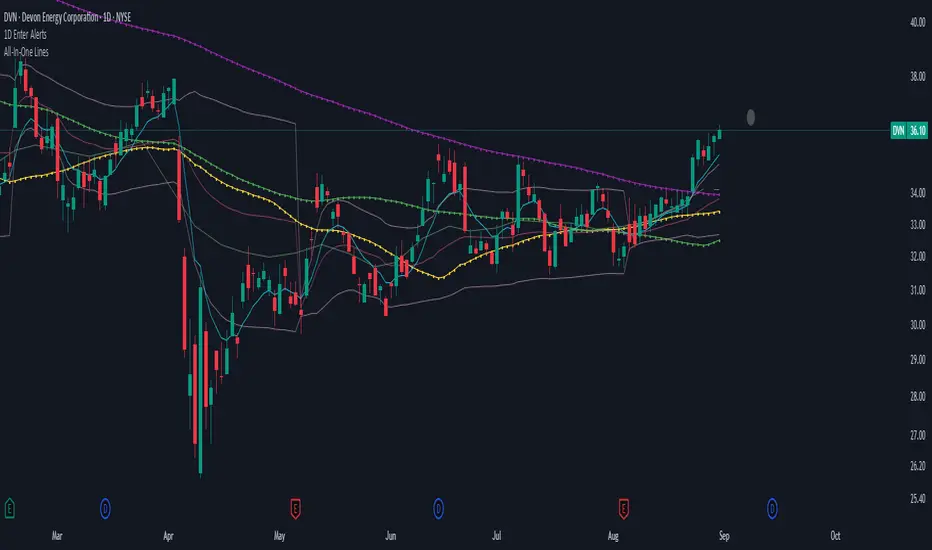
Dynamic Support and Resistance with Trend LinesMain Purpose
The indicator identifies and visualizes dynamic support and resistance levels using multiple strategies, plus it includes trend analysis and trading signals.
Key Components:
1. Two Support/Resistance Strategies:
Strategy A: Matrix Climax
Identifies the top 10 (configurable) most significant support and resistance levels
Uses a "matrix" calculation method to find price levels where the market has historically reacted
Shows these as horizontal lines or zones on the chart
Strategy B: Volume Extremes
Finds support/resistance levels based on volume analysis
Looks for areas where extreme volume occurred, which often become key price levels
2. Two Trend Line Systems:
Trend Line 1: Pivot Span
Draws trend lines connecting pivot high and pivot low points
Uses configurable pivot parameters (left: 5, right: 5 bars)
Creates a channel showing the trend direction
Styled in pink/purple with dashed lines
Trend Line 2: 5-Point Channel
Creates a channel based on 5 pivot points
Provides another perspective on trend direction
Solid lines in pink/purple
3. Trading Signals:
Buy Signal: Triggers when Fast EMA (9-period) crosses above Slow EMA (21-period)
Sell Signal: Triggers when Fast EMA crosses below Slow EMA
Displays visual shapes (labels) on the chart
Includes alert conditions you can set up in TradingView
4. Visual Features:
Dashboard: Shows key information in a table (top-right by default)
Visual Matrix Map: Displays a heat map of support/resistance zones
Color themes: Dark Mode or Light Mode
Timezone adjustment: For accurate time display
5. Customization Options:
Universal lookback length (100 bars default)
Projection bars (26 bars forward)
Adjustable transparency for different elements
Multiple calculation methods available
Fully customizable colors and line styles
What Traders Use This For:
Entry/Exit Points: The EMA crossovers provide clear buy/sell signals
Risk Management: Support/resistance levels help set stop-losses and take-profit targets
Trend Confirmation: Multiple trend lines confirm trend direction
Key Price Levels: Identifies where price is likely to react (bounce or break through)
The indicator is quite feature-rich and combines technical analysis elements (pivots, EMAs, volume, support/resistance) into one comprehensive tool for trading decisions.

Advanced Triple Strategy ScalperHere are the three scalping strategies presented in the video "3 Scalping Strategies That Work Every Day (Backtested & Proven)" by Asia Forex Mentor – Ezekiel Chew:
### Scalper’s Trend Filter (Triple EMA)
This strategy uses three EMAs (25, 50, 100) on the 5-minute chart to filter high-probability trades aligned with momentum .
- Only trade when all three EMAs are angled in the same direction and clearly separated (no crossing or tangling) .
- Enter when price pulls back toward the 25 or 50 EMA and then bounces back toward the 25 EMA, but do not enter if price closes below the 100 EMA .
- Set stop-loss just below the 50 EMA or swing low and aim for a risk-to-reward ratio of 1:1.5 .
### Flip Zone Trap (Reversal Catching)
This method identifies precise reversal moments where market structure shifts from weakness to strength .
- Use the 15-min chart to locate key support or resistance zones where price previously reacted .
- Wait for price to stop making lower lows and begin making higher highs (or vice versa for shorts); confirm with a trendline break AND follow-through (higher lows & highs within 5-7 candles) .
- Use confirmation candles (bullish engulfing, pin bar rejection) at the zone before entry .
### Liquidity Shift Trigger (Smart Money Trap)
This system leverages institutional stop hunts and liquidity sweeps at key zones for sniper entries .
- Start with a 15-min chart to identify structure breaks and points of interest (order blocks, flip zones, demand zones) .
- Drop to 1-min chart and wait for price to enter the refined zone and sweep liquidity (sharp wick/spike below/above key level) .
- Once liquidity is swept, wait for a clean structure shift (break of most recent internal high or low) within 5–6 candles—if confirmed, refine entry to the candle that caused the break and enter when price returns to that candle with a strong reaction .
***
### Practical Application
- These strategies are systematic, rule-based, and designed to cut out fake moves, avoid early stop-outs, and align entries with momentum and institutional activity .
- Perfect for short timeframes and volatile pairs like XAUUSD, especially if paired with additional confirmation from other technical analysis tools .
All three strategies emphasize filtering noise, waiting for momentum/trend confirmation, and avoiding impulsive entries—key principles for consistent scalping success

EMA 50/200 Pullback + RSI (BTC/USDT 15m - 2 Bar Logic)I recognize that combining indicators requires clear justification on how the components interact Therefore the new scripts description will explicitly detail the strategys operational logic
Objective The strategy is a Trend Following Pullback System designed for high frequency time frames 15m
Synergy The EMA50 EMA200 defines the primary Trend Direction Trend Filter It then utilizes a 2 Bar Pullback Logic to find an entry point where the price has momentarily reversed against the trendline and the RSI 14 serves as a Momentum Filter RSI greater than 50 for Long RSI less than 50 for Short to minimize false signals

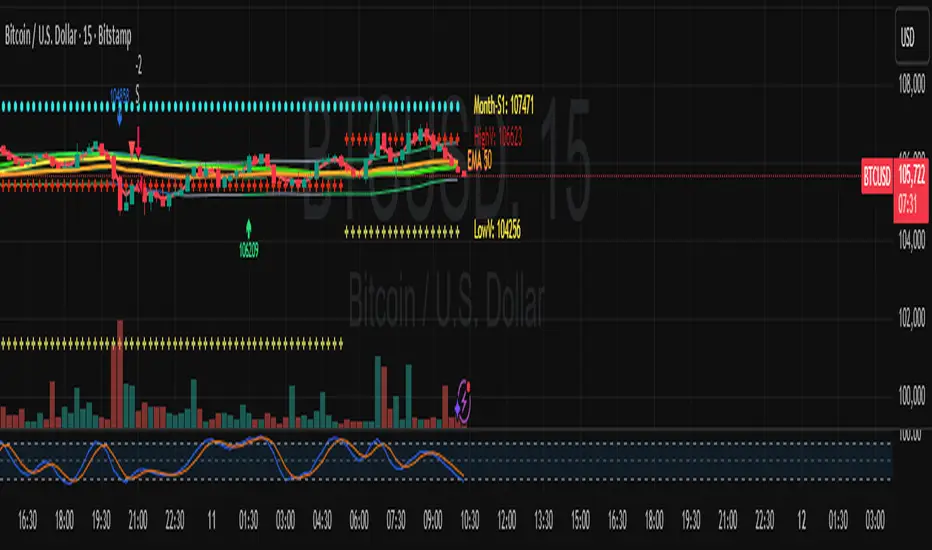
Volume Pressure and PercentVPP Volume Pressure and Percentage Indicator with a Volume Trendline that indicates which side is driving the flow.
Features:
1. Buy/Sell Pressure Bars (Core Volume Split)
The indicator separates each candle’s volume into buy volume (green) above the zero line and sell volume (red) below it. This gives you a real-time visualization of which side is more aggressive within the current bar. Instead of waiting for prices to move or candles to close, you can instantly see whether buyers or sellers are stepping in.
2. Dynamic Total Volume (Invisible Histogram + Status Line Color)
The total volume of each bar is tracked behind the scenes and displayed in the pinned status line using a dynamic color—green when buyers dominate, red when sellers dominate. The histogram for total volume is invisible to keep the chart clean, but the total volume figure stays visible and changes color based on who is in control. This gives you instant confirmation of whether institutional-sized volume supports the direction shown by the buy/sell pressure, which is especially valuable when evaluating the risk or conviction behind a potential entry.
3. Percentage Mode (% of Bar Volume)
When toggled on, the indicator converts each bar into percent buy vs percent sell, normalizing all flow to a 0–100% scale. This mode is incredibly useful when comparing pressure across different times of day, gaps, or varying volume conditions—such as early morning spikes versus lunchtime chop. By removing absolute volume from the equation, you gain a clean look at the actual imbalance between buyers and sellers.
4. 70% Pressure Band (Imbalance Threshold Zone)
In percentage mode, the indicator displays a subtle 70% band (a light gray zone) above and below the zero line, showing where buy or sell pressure reaches extreme dominance (≥70%). When a bar’s buy or sell percentage enters this zone, it highlights moments of exhaustion, acceleration, or potential reversal. The band acts like a real-time overbought/oversold gauge specifically for volume imbalance, not price.
5. Trend Line (Net Pressure Trend / Reversal Detector)
The trend line smooths out the net volume pressure (buy volume minus sell volume or its percentage equivalent) and shows the overall direction of order flow. When the line slopes upward, buyers are gaining control; when it slopes downward, sellers are taking over. This trend line acts as a real-time momentum indicator based directly on flow rather than price. Because it reacts quickly to intrabar shifts in buy/sell pressure, it often turns before price does—giving you a measurable timing edge.
6. Auto-Selecting Trend Source (Volume Net, Percent Net, or CVD)
The indicator lets you choose how the trend line is calculated: Volume Net (buy minus sell volume), Percent Net (normalized imbalance), or CVD (Cumulative Volume Delta) for long-term flow bias. The default “Auto” mode automatically switches between Volume Net and Percent Net depending on which view you’re using. This flexibility allows the trend line to remain meaningful whether you’re analyzing raw volume or normalized percentage data.
7. Pinned (Status Line) Totals in K/M/B Format
Regardless of whether you’re in volume or percentage mode, the indicator always displays Total Volume, Buy Volume, and Sell Volume in the status line using abbreviated K, M, B formatting. These values update in real time and are color-coded: green for bullish dominance, red for bearish. This gives you a concise snapshot of order flow strength on every bar.
---------------------
How To Use:
Support Level Zones
• Watch for Buy bars increasing + Trend line flipping up right at or slightly below support.
• This often signals absorption — market makers filling large buy orders before reversal.
• Confirmation: Price reclaims VWAP ... enter calls / longs.
Resistance Level Zones
• Watch for Sell bars increasing + Trend line flattening/turning down near resistance.
• This signals distribution or stop runs.
• Confirmation: Price rejects VWAP ... enter puts / shorts.
Breakout Traps
• Sometimes you’ll see price break a level, but the flow doesn’t confirm (buy volume doesn’t expand).
• That’s a false breakout — fade it with options opposite the move.

Dhanesh_CustomTrendlineLogicUsed framma in getting the trades.
You can also define the custom horizontal and an inclined trendline breaking of which can trigger the trade. Enjoy the script.
NSR - Dynamic Linear Regression ChannelOverview
The NSR - Dynamic Linear Regression Channel is a powerful overlay indicator that plots a dynamic regression-based channel around price action. Unlike static channels, this tool continuously recalculates the linear regression trendline from a user-defined starting point and builds upper and lower boundaries using a combination of standard deviation and maximum price deviations (highs/lows).
It visually separates "Premium" (overvalued) and "Discount" (undervalued) zones relative to the regression trend — ideal for mean-reversion, breakout, or trend-following strategies.
Key Features
Dynamic Regression Line Calculates slope, intercept, and average using full lookback from a reset point.
Adaptive Channel Width Combines standard deviation of residuals with max high/low deviations for robust boundaries.
Auto-Reset on Breakout Channel resets when price closes beyond upper/lower band twice in direction of trend .
Visual Zones Blue shaded = Premium (resistance zone)
Red shaded = Discount (support zone)
Real-Time Updates Live channel extends with each bar; historical channels preserved on reset.
How It Works
Regression Calculation
Uses all bars since last reset to compute the best-fit line:
y = intercept + slope × bar_position
Deviation Bands
Statistical : Standard deviation of price from regression line
Structural : Maximum distance from highs to line (upper) and lows to line (lower)
Final band = Regression Line ± (Deviation Input × StdDev)
Channel Reset Logic
Resets when:
Price closes above upper band twice in an uptrend (slope > 0)
OR closes below lower band twice in a downtrend (slope < 0)
Prevents overextension and adapts to new trends.
Visual Output
Active channel updates in real-time
Completed channels saved as historical reference (up to 500 lines/boxes)
Input Parameters
Deviation (2.0) - Multiplier for standard deviation to set channel width
Premium Color - blue color for upper (resistance) zone
Discount Color - red color for lower (support) zone
Best Use Cases
Mean Reversion - Buy near lower band in uptrend, sell near upper band
Breakout Trading - Enter on confirmed close beyond band + volume
Trend Confirmation - Use slope direction + price position in channel
Stop Loss / Take Profit - Place stops beyond opposite band
Pro Tips
Use on higher timeframes (4H, Daily) for cleaner regression fits
Combine with volume or momentum to filter false breakouts
Lower Deviation (e.g., 1.5) for tighter, more responsive channels
Watch channel resets — they often mark significant trend shifts
Why Use DLRC?
"Most channels are static. This one evolves with the market."
The NSR-DLRC gives you a mathematically sound, visually intuitive way to see:
Where price should be (regression)
Where it has been (deviation extremes)
When the trend is breaking structure
Perfect for traders who want regression-based precision without rigid assumptions.
Add to chart → Watch price dance within the evolving trend corridor.

Volumatic VIDYA – Pro+1. Professional & Clear (recommended for TradingView)
Volumatic VIDYA Pro+ combines a dynamic VIDYA trend filter, Delta Volume pressure, and automatic pattern recognition (Double/Triple Tops & Bottoms, Head & Shoulders).
A complete technical tool for detecting momentum shifts, trend reversals, and trade entries across multiple timeframes.
2. Short & Catchy
Adaptive VIDYA trendline + Delta Volume + Pattern detection in one tool.
Instantly visualize market bias, structure, and momentum strength.
3. Educational / Analytical
Analyze market dynamics with VIDYA-based trend filtering, volume delta analysis, and automated pattern recognition.
Ideal for traders who combine price action with quantitative confirmation.

Volume Weighted Intra Bar LR Standard DeviationThis indicator analyzes market character by providing a detailed view of volatility. It applies a Linear Regression model to intra-bar price action, dissecting the total volatility of each bar into three distinct components.
Key Features:
Three-Component Volatility Decomposition: By analyzing a lower timeframe ('Intra-Bar Timeframe'), the indicator separates each bar's volatility into:
Trend Volatility (Green/Red): Volatility explained by the intra-bar linear regression slope (Momentum).
Residual Volatility (Yellow): Volatility from price oscillating around the intra-bar trendline (Mean-Reversion).
Within-Bar Volatility (Blue): Volatility derived from the range of each intra-bar candle (Noise/Choppiness).
Layered Column Visualization: The indicator plots these components as a layered column chart. The size of each colored layer visually represents the dominance of each volatility character.
Dual Display Modes: The indicator offers two modes to visualize this decomposition:
Absolute Mode: Displays the total standard deviation as the column height, showing the absolute magnitude of volatility and the contribution of each component.
Normalized Mode: Displays the components as a 100% stacked column chart (scaled from 0 to 1), focusing purely on the percentage ratio of Trend, Residual, and Noise.
Calculation Options:
Statistical Model: The 'Estimate Bar Statistics' option (enabled by default) uses a statistical model ('Estimator') to perform the decomposition. (Assumption: In this mode, the Source input is ignored, and an estimated mean for each bar is used instead).
Normalization: An optional 'Normalize Volatility' setting calculates an Exponential Regression Curve (log-space).
Volume Weighting: An option (Volume weighted) applies volume weighting to all intra-bar calculations.
Multi-Component Pivot Detection: Includes a pivot detector that identifies significant turning points (highs and lows) in both the Total Volatility and the Trend Volatility Ratio. (Note: These pivots are only plotted when 'Plot Mode' is set to 'Absolute').
Note on Confirmation (Lag): Pivot signals are confirmed using a lookback method. A pivot is only plotted after the Pivot Right Bars input has passed, which introduces an inherent lag.
Multi-Timeframe (MTF) Capability:
MTF Analysis: The entire intra-bar analysis can be run on a higher timeframe (using the Timeframe input), with standard options to handle gaps (Fill Gaps) and prevent repainting (Wait for...).
Limitation: The Pivot detection (Calculate Pivots) is disabled if a Higher Timeframe (HTF) is selected.
Integrated Alerts: Includes 9 comprehensive alerts for:
Volatility character changes (e.g., 'Character Change from Noise to Trend').
Dominant character emerging (e.g., 'Bullish Trend Character Emerging').
Total Volatility pivot (High/Low) detection.
Trend Volatility pivot (High/Low) detection.
Caution! Real-Time Data Behavior (Intra-Bar Repainting) This indicator uses high-resolution intra-bar data. As a result, the values on the current, unclosed bar (the real-time bar) will update dynamically as new intra-bar data arrives. This behavior is normal and necessary for this type of analysis. Signals should only be considered final after the main chart bar has closed.
DISCLAIMER
For Informational/Educational Use Only: This indicator is provided for informational and educational purposes only. It does not constitute financial, investment, or trading advice, nor is it a recommendation to buy or sell any asset.
Use at Your Own Risk: All trading decisions you make based on the information or signals generated by this indicator are made solely at your own risk.
No Guarantee of Performance: Past performance is not an indicator of future results. The author makes no guarantee regarding the accuracy of the signals or future profitability.
No Liability: The author shall not be held liable for any financial losses or damages incurred directly or indirectly from the use of this indicator.
Signals Are Not Recommendations: The alerts and visual signals (e.g., crossovers) generated by this tool are not direct recommendations to buy or sell. They are technical observations for your own analysis and consideration.

Gold $25 line + CDCGold Trading CDC + option line
trading with ema to see trendline + Option strike price

Trend change[YI_YA_HA_]這是一個趨勢變化和盤整突破偵測指標。
This is a trend change and consolidation breakout detection indicator.
它能自動識別價格進入狹窄盤整區間。
It automatically identifies when price enters a tight consolidation range.
當價格突破箱型上緣,就判定為上升趨勢開始。
When price closes above the box top, it signals the start of an uptrend.
當價格突破箱型下緣,則觸發下跌趨勢警報。
When price closes below the box bottom, it triggers a downtrend alert.
程式會畫出黃色盤整箱體,突破後自動消失。
The script draws a yellow consolidation box that auto-deletes after breakout.
突破向上時,會從低點畫一條綠色趨勢線持續延伸。
On upward breakout, a green trendline is drawn from the low and extends right.
右側標籤即時顯示目前趨勢狀態與價格。
A label on the right shows the current trend status and price in real-time.

Metallic Retracement ToolI made a version of the Metallic Retracement script where instead of using automatic zig-zag detection, you get to place the points manually. When you add it to the chart, it prompts you to click on two points. These two points become your swing range, and the indicator calculates all the metallic retracement levels from there and plots them on your chart. You can drag the points around afterwards to adjust the range, or just add the indicator to the chart again to place a completely new set of points.
The mathematical foundation is identical to the original Metallic Retracement indicator. You're still working with metallic means, which are the sequence of constants that generalize the golden ratio through the equation x² = kx + 1. When k equals 1, you get the golden ratio. When k equals 2, you get silver. Bronze is 3, and so on forever. Each metallic number generates its own set of retracement ratios by raising alpha to various negative powers, where alpha equals (k + sqrt(k² + 4)) / 2. The script algorithmically calculates these levels instead of hardcoding them, which means you can pick any metallic number you want and instantly get its complete retracement sequence.
What's different here is the control. Automatic zig-zag detection is useful when you want the indicator to find swings for you, but sometimes you have a specific price range in mind that doesn't line up with what the zig-zag algorithm considers significant. Maybe you're analyzing a move that's still developing and hasn't triggered the zig-zag's reversal thresholds yet. Maybe you want to measure retracements from an arbitrary high to an arbitrary low that happened weeks apart with tons of noise in between. Manual placement lets you define exactly which two points matter for your analysis without fighting with sensitivity settings or waiting for confirmation.
The interactive placement system uses TradingView's built-in drawing tools, so clicking the two points feels natural and works the same way as drawing a trendline or fibonacci retracement. First click sets your starting point, second click sets your ending point, and the indicator immediately calculates the range and draws all the metallic levels extending from whichever point you chose as the origin. If you picked a swing low and then a swing high, you get retracement levels projecting upward. If you went from high to low, they project downward.
Moving the points after placement is as simple as grabbing one of them and dragging it to a new location. The retracement levels recalculate in real-time as you move the anchor points, which makes it easy to experiment with different range definitions and see how the levels shift. This is particularly useful when you're trying to figure out which swing points produce retracement levels that line up with other technical features like previous support or resistance zones. You can slide the points around until you find a configuration that makes sense for your analysis.
Adding the indicator to the chart multiple times lets you compare different metallic means on the same price range, or analyze multiple ranges simultaneously with different metallic numbers. You could have golden ratio retracements on one major swing and silver ratio retracements on a smaller correction within that swing. Since each instance of the indicator is independent, you can mix and match metallic numbers and ranges however you want without one interfering with the other.
The settings work the same way as the original script. You select which metallic number to use, control how many power ratios to display above and below the 1.0 level, and adjust how many complete retracement cycles you want drawn. The levels extend from your manually placed swing points just like they would from automatically detected pivots, showing you where price might react based on whichever metallic mean you've selected.
What this version emphasizes is that retracement analysis is subjective in terms of which swing points you consider significant. Automatic detection algorithms make assumptions about what constitutes a meaningful reversal, but those assumptions don't always match your interpretation of the price action. By giving you manual control over point placement, this tool lets you apply metallic retracement concepts to exactly the price ranges you care about, without requiring those ranges to fit someone else's definition of a valid swing. You define the context, the indicator provides the mathematical framework.

Ultimate📖 Indicator Description – Ultimate
The Ultimate Indicator is a complete charting framework that combines linear regression channels, dynamic deviation bands, EMA ribbons, volatility spreads, and entry/exit markers. It is designed to help traders visualize trend direction, potential reversals, and trade setups with precision.
🔹 What You See on the Chart
Channel Lines (Linear Regression Bands)
Green dotted line (median): Fair value trendline based on regression.
Red dashed line (upper band): Dynamic resistance zone.
Blue dashed line (lower band): Dynamic support zone.
Mid-bands (thin dotted red/blue): Halfway between median and outer bands, useful for scaling entries or partial exits.
🔹 EMA Ribbon (Light Green Shades)
Multiple EMAs (5, 8, 13, 21, 34) plotted in progressively lighter green.
Helps visualize momentum shifts and trend strength.
Ribbon turns more aqua/green when short-term EMAs align bullishly.
🙌Markers on Price
🔴 Red Circle (Dot): Short entry signal (price rejecting upper deviation band).
🔵 Blue Circle (Dot): Long entry signal (price bouncing off lower deviation band).
❌ Red X: Peak formation detected, potential short setup (not always valid).
🔷 Blue Diamond: Trough formation detected, potential long setup (not always valid).
Numbers Above/Below Candles
🔴Red numbers (above peaks): % spread from the bottom to the peak, showing upward volatility.
🔵 Blue numbers (below troughs): % spread from the top to the trough, showing downward volatility.
These values help traders gauge the strength of recent swings and compare volatility expansions.
🔹 Signal Logic🔹
🔵Long Signal (Blue Circle):
Forms when price makes a trough and crosses back above the lower regression band.
Confirms potential upside reversal with stop-loss guided by ATR or swing low.
🔴Short Signal (Red Circle):
Forms when price makes a peak and crosses below the upper regression band.
Confirms potential downside reversal with stop-loss guided by ATR or swing high.
❌ Peaks (Red X):
Indicate local tops. Not all peaks convert into shorts, but they warn of resistance zones.
🔹Troughs (Blue Diamonds):
Indicate local bottoms. Not all troughs convert into longs, but they warn of support zones.
🔹 Alerts
When a valid long or short setup is confirmed, an alert fires with:
Ticker name
Entry price
Suggested position size (Quantity)
Stop loss level (ATR-based or HL-based)
Take profit level (calculated by reward multiple)
🔹 Inputs & Customization
Quantity: Lot size suggestion.
Deviation: Multiplier for regression channel width.
Take Profit: Risk-to-reward multiplier.
Stop Loss: ATR or High/Low based.
Trend Lines: Choose between extended or fixed channels.
Period: Lookback window for regression.
Spread Percentages: Toggle volatility labels on/off.
🔹 How to Use
Trend Following: Ride price inside the channel using EMA ribbon alignment.
Reversal Trading: Enter at deviation extremes with confirmation signals.
Volatility Mapping: Use spread % labels to measure the strength of market swings.
Risk Management: ATR-based stops adapt to volatility, while HL stops give structural support/resistance.
✅ In summary:
The Ultimate Indicator is not just a regression channel—it’s a multi-layered system that highlights trend bias, entry/exit signals, volatility spreads, and adaptive risk levels. It allows traders to see at a glance whether the market is trending, ranging, or preparing for a reversal.

Cascades & Sloped Lines (RU) • v6How it works
• The base trendline is built from the last two confirmed pivot lows (uptrend) and/or pivot highs (downtrend).
• “Cascades” are a set of parallel lines above and below the base line, spaced equally: either ATR × multiplier or a fixed percentage of price.
• Lines are automatically rebuilt when a new confirmed pivot appears. To avoid overloading the chart, old lines are removed.
Useful settings
• Increase Pivot Left/Right if you want “larger” swing points.
• Switch the step mode to Percent if you want a fixed distance.
• Adjust Lines Above/Below to get a “dense” or “sparse” cascade.
• Colors and thickness — match them to your style.

1D Enter AlertsThis is only a remaining of an experiment. I had real swing enter alerts, but it just made more sense to use classic TradingView alerts for horizontal / trendline / SMA breaks.
(Btw you can set up a horizontal alert in TradingView just by hovering the mouse on the chart so it's at the price point you aim for, and pressing "Alt + A").
Once this horizontal alert triggered I would usually wait for confirmation of the move on the 5m. If it's f. e. a break of an SMA and I'm not convinced yet, I might wait until end of the day. For exactly that purpose the following alert comes in handy:
"X Candle Close":
Is triggered 15m before market close - good reminder to check a stock again to see whether a resistance / support break was valid - and the stock should be entered as a swing, or maybe whether it should be closed as a loss.
"Z Trend Change: UP" + "Z Trend Change: DOWN":
Same as on 5m Exit Alert: meant to be only applied on SPY, and to have it set up to never end!
Criteria:
SPY broke through daily EMA 8 or daily SMA today, indicating an important short-term change on the daily chart.
Is triggered 15m before market close
More infos: www.reddit.com
Trend dealing rangeHi all!
This indicator will help you find the current dealing range according to the trend. If the trend is bullish the indicator will look for a range between the latest low pivot to the latest high pivot. Vice versa in a bearish trend. The code uses my new library 'FibonacciRetracement' () that has the same code as my other indicator 'Fibonacci retracement' ().
It plots 5 lines from the low to the high and labels them 0 %, 25 %, 50 %, 75 % and 100 %. A trendline can be drawn between the two pivots (dashed and gray by default). Firstly you can define the pivot lengths used, this setting is in the 'Market structure' section but it also applies to the dealing range (it defaults to 5 (left) and 2 (right)). You can show prices if you want to (shown in parantheses, off by default). You can change the default labels position (from left) and the font size (12 by default and higher up it's 7 for market structure text). Lastly you can change the alert frequency (defaults to once per bar close) and the price that has to enter a zone for alert to be sent. 'Close' means that the closing price (or current price if you change the alert frequency to all or once per bar) has to be inside the zone and 'Wick' means that the entire candle needs to be inside the zone.
It's very useful for traders to find the current dealing range and this indicator will help you to do so.
So, this indicator will give you the dealing range and basic market structure through break of structures and change of characters.
If you have any input or suggestions on future features or bugs, don't hesitate to let me know!
Best of trading luck!
