Smart MACD Volume Trader# Smart MACD Volume Trader
## Overview
Smart MACD Volume Trader is an enhanced momentum indicator that combines the classic MACD (Moving Average Convergence Divergence) oscillator with an intelligent high-volume filter. This combination significantly reduces false signals by ensuring that trading signals are only generated when price momentum is confirmed by substantial volume activity.
The indicator supports over 24 different instruments including major and exotic forex pairs, precious metals (gold and silver), energy commodities (crude oil, natural gas), and industrial metals (copper). For forex and commodity traders, the indicator automatically maps to CME and COMEX futures contracts to provide accurate institutional-grade volume data.
## Originality and Core Concept
Traditional MACD indicators generate signals based solely on price momentum, which can result in numerous false signals during low-activity periods or ranging markets. This indicator addresses this critical weakness by introducing a volume confirmation layer with automatic institutional volume integration.
**What makes this approach original:**
- Signals are triggered only when MACD crossovers coincide with elevated volume activity
- Implements a lookback mechanism to detect volume spikes within recent bars
- Automatically detects and maps 24+ forex pairs and commodities to their corresponding CME and COMEX futures contracts
- Provides real institutional volume data for forex pairs where spot volume is unreliable
- Combines two independent market dimensions (price momentum and volume) into a single, actionable signal
- Includes intelligent asset detection that works across multiple exchanges and ticker formats
**The underlying principle:** Volume validates price movement. When institutional money enters the market, it creates volume signatures. By requiring high volume confirmation and using actual institutional volume data from futures markets, this indicator filters out weak price movements and focuses on trades backed by genuine market participation. The automatic futures mapping ensures that forex and commodity traders always have access to the most accurate volume data available, without manual configuration.
## How It Works
### MACD Component
The indicator calculates MACD using standard methodology:
1. **Fast EMA (default: 12 periods)** - Tracks short-term price momentum
2. **Slow EMA (default: 26 periods)** - Tracks longer-term price momentum
3. **MACD Line** - Difference between Fast EMA and Slow EMA
4. **Signal Line (default: 9-period SMA)** - Smoothed average of MACD line
**Crossover signals:**
- **Bullish:** MACD line crosses above Signal line (momentum turning positive)
- **Bearish:** MACD line crosses below Signal line (momentum turning negative)
### Volume Filter Component
The volume filter adds an essential confirmation layer:
1. **Volume Moving Average** - Calculates exponential MA of volume (default: 20 periods)
2. **High Volume Threshold** - Multiplies MA by ratio (default: 2.0x or 200%)
3. **Volume Detection** - Identifies bars where current volume exceeds threshold
4. **Lookback Period** - Checks if high volume occurred in recent bars (default: 5 bars)
**Signal logic:**
- Buy/Sell signals only trigger when BOTH conditions are met:
- MACD crossover/crossunder occurs
- High volume detected within lookback period
### Automatic CME Futures Integration
For forex traders, spot FX volume data can be unreliable or non-existent. This indicator solves this problem by automatically detecting forex pairs and mapping them to corresponding CME futures contracts with real institutional volume data.
**Supported Major Forex Pairs (7):**
- EURUSD → CME:6E1! (Euro FX Futures)
- GBPUSD → CME:6B1! (British Pound Futures)
- AUDUSD → CME:6A1! (Australian Dollar Futures)
- USDJPY → CME:6J1! (Japanese Yen Futures)
- USDCAD → CME:6C1! (Canadian Dollar Futures)
- USDCHF → CME:6S1! (Swiss Franc Futures)
- NZDUSD → CME:6N1! (New Zealand Dollar Futures)
**Supported Exotic Forex Pairs (4):**
- USDMXN → CME:6M1! (Mexican Peso Futures)
- USDRUB → CME:6R1! (Russian Ruble Futures)
- USDBRL → CME:6L1! (Brazilian Real Futures)
- USDZAR → CME:6Z1! (South African Rand Futures)
**Supported Cross Pairs (6):**
- EURJPY → CME:6E1! (Uses Euro Futures)
- GBPJPY → CME:6B1! (Uses British Pound Futures)
- EURGBP → CME:6E1! (Uses Euro Futures)
- AUDJPY → CME:6A1! (Uses Australian Dollar Futures)
- EURAUD → CME:6E1! (Uses Euro Futures)
- GBPAUD → CME:6B1! (Uses British Pound Futures)
**Supported Precious Metals (2):**
- Gold (XAUUSD, GOLD) → COMEX:GC1! (Gold Futures)
- Silver (XAGUSD, SILVER) → COMEX:SI1! (Silver Futures)
**Supported Energy Commodities (3):**
- WTI Crude Oil (USOIL, WTIUSD) → NYMEX:CL1! (Crude Oil Futures)
- Brent Oil (UKOIL) → NYMEX:BZ1! (Brent Crude Futures)
- Natural Gas (NATGAS) → NYMEX:NG1! (Natural Gas Futures)
**Supported Industrial Metals (1):**
- Copper (COPPER) → COMEX:HG1! (Copper Futures)
**How the automatic detection works:**
The indicator intelligently identifies the asset type by analyzing:
1. Exchange name (FX, OANDA, TVC, COMEX, NYMEX, etc.)
2. Currency pair pattern (6-letter codes like EURUSD, GBPUSD)
3. Commodity identifiers (XAU for gold, XAG for silver, OIL for crude)
When a supported instrument is detected, the indicator automatically switches to the corresponding futures contract for volume analysis. For stocks, cryptocurrencies, and other assets, the indicator uses the native volume data from the current chart.
**Visual feedback:**
An information table appears in the top-right corner of the MACD pane showing:
- Current chart symbol
- Exchange name
- Currency pair or asset name
- Volume source being used (highlighted in orange for futures, yellow for native volume)
- Current high volume status
This provides complete transparency about which data source the indicator is using for its volume analysis.
## How to Use
### Basic Setup
1. Add the indicator to your chart
2. The indicator displays in a separate pane (MACD) and overlay (signals/volume bars)
3. Default settings work well for most assets, but can be customized
### Signal Interpretation
### Visual Signals
**Visual Signals:**
- **Green "BUY" label** - Bullish MACD crossover confirmed by high volume
- **Red "SELL" label** - Bearish MACD crossunder confirmed by high volume
- **Green/Red candles** - Highlight bars with volume exceeding the threshold
- **Light green/red background** - Emphasizes signal bars on the chart
**Information Table:**
A detailed information table appears in the top-right corner of the MACD pane, providing real-time transparency about the indicator's operation:
- **Chart:** Current symbol being analyzed
- **Exchange:** The exchange or data feed being used
- **Pair:** The currency pair or asset name extracted from the ticker
- **Volume From:** The actual symbol used for volume analysis
- Orange color indicates CME or COMEX futures are being used (automatic institutional volume)
- Yellow color indicates native volume from the chart symbol is being used
- Hover tooltip shows whether automatic futures mapping is active
- **High Volume:** Current status showing YES (green) when volume exceeds threshold, NO (gray) otherwise
This table ensures complete transparency and allows you to verify that the correct volume source is being used for your analysis.
**Volume Analysis:**
- Gray histogram bars = Normal volume
- Red histogram bars = High volume (exceeds threshold)
- Green line = Volume moving average baseline
**MACD Analysis:**
- Blue line = MACD line (momentum indicator)
- Orange line = Signal line (trend confirmation)
- Gray dotted line = Zero line (bullish above, bearish below)
### Parameter Customization
**MACD Parameters:**
- Adjust Fast/Slow EMA lengths for different sensitivities
- Shorter periods = More signals, faster response
- Longer periods = Fewer signals, less noise
**Volume Parameters:**
- **Volume MA Period:** Higher values smooth volume analysis
- **High Volume Ratio:** Lower values (1.5x) = More signals; Higher values (3.0x) = Fewer, stronger signals
- **Volume Lookback Bars:** Controls how recent the volume spike must be
**Direction Filters:**
- **Only Buy Signals:** Enables long-only strategy mode
- **Only Sell Signals:** Enables short-only strategy mode
### Alert Configuration
The indicator includes three alert types:
1. **Buy Signal Alert** - Triggers when bullish signal appears
2. **Sell Signal Alert** - Triggers when bearish signal appears
3. **High Volume Alert** - Triggers when volume exceeds threshold
To set up alerts:
1. Click the indicator name → "Add alert on Smart MACD Volume Trader"
2. Select desired alert condition
3. Configure notification method (popup, email, webhook, etc.)
## Trading Strategy Guidelines
### Best Practices
**Recommended markets:**
- Liquid stocks (large-cap, high daily volume)
- Major forex pairs (EURUSD, GBPUSD, USDJPY, AUDUSD, USDCAD, USDCHF, NZDUSD)
- Exotic forex pairs (USDMXN, USDRUB, USDBRL, USDZAR)
- Cross pairs (EURJPY, GBPJPY, EURGBP, AUDJPY, EURAUD, GBPAUD)
- Precious metals (Gold, Silver with automatic COMEX futures mapping)
- Energy commodities (Crude Oil, Natural Gas with automatic NYMEX futures mapping)
- Industrial metals (Copper with automatic COMEX futures mapping)
- Major cryptocurrency pairs
- Index futures and ETFs
**Timeframe recommendations:**
- **Day trading:** 5-minute to 15-minute charts
- **Swing trading:** 1-hour to 4-hour charts
- **Position trading:** Daily charts
**Risk management:**
- Use signals as entry confirmation, not standalone strategy
- Combine with support/resistance levels
- Consider overall market trend direction
- Always use stop-loss orders
### Strategy Examples
**Trend Following Strategy:**
1. Identify overall trend using higher timeframe (e.g., daily chart)
2. Trade only in trend direction
3. Use "Only Buy" filter in uptrends, "Only Sell" in downtrends
4. Enter on signal, exit on opposite signal or at resistance/support
**Volume Breakout Strategy:**
1. Wait for consolidation period (low volume, tight MACD range)
2. Enter when signal appears with high volume (confirms breakout)
3. Target previous swing highs/lows
4. Stop loss below/above recent consolidation
**Forex Scalping Strategy (with automatic CME futures):**
1. The indicator automatically detects forex pairs and uses CME futures volume
2. Trade during active sessions only (use session filter)
3. Focus on quick profits (10-20 pips)
4. Exit at opposite signal or profit target
**Commodities Trading Strategy (Gold, Silver, Oil):**
1. The indicator automatically maps to COMEX and NYMEX futures contracts
2. Trade during high-liquidity sessions (overlap of major markets)
3. Use the high volume confirmation to identify institutional entry points
4. Combine with key support and resistance levels for entries
5. Monitor the information table to confirm futures volume is being used (orange color)
6. Exit on opposite MACD signal or at predefined profit targets
## Why This Combination Works
### The Volume Advantage
Studies consistently show that price movements accompanied by high volume are more likely to continue, while low-volume movements often reverse. This indicator leverages this principle by requiring volume confirmation.
**Key benefits:**
1. **Reduced False Signals:** Eliminates MACD whipsaws during low-volume consolidation
2. **Confirmation Bias:** Two independent indicators (price momentum + volume) agreeing
3. **Institutional Alignment:** High volume often indicates institutional participation
4. **Trend Validation:** Volume confirms that price momentum has "conviction"
### Statistical Edge
By combining two uncorrelated signals (MACD crossovers and volume spikes), the indicator creates a higher-probability setup than either signal alone. The lookback mechanism ensures signals aren't missed if volume spike slightly precedes the MACD cross.
## Supported Exchanges and Automatic Detection
The indicator includes intelligent asset detection that works across multiple exchanges and ticker formats:
**Forex Exchanges (Automatic CME Mapping):**
- FX (TradingView forex feed)
- OANDA
- FXCM
- SAXO
- FOREXCOM
- PEPPERSTONE
- EASYMARKETS
- FX_IDC
**Commodity Exchanges (Automatic COMEX/NYMEX Mapping):**
- TVC (TradingView commodity feed)
- COMEX (directly)
- NYMEX (directly)
- ICEUS
**Other Asset Classes (Native Volume):**
- Stock exchanges (NASDAQ, NYSE, AMEX, etc.)
- Cryptocurrency exchanges (BINANCE, COINBASE, KRAKEN, etc.)
- Index providers (SP, DJ, etc.)
The detection algorithm analyzes three factors:
1. Exchange prefix in the ticker symbol
2. Pattern matching for currency pairs (6-letter codes)
3. Commodity identifiers in the symbol name
This ensures accurate automatic detection regardless of which data feed or exchange you use for charting. The information table in the top-right corner always displays which volume source is being used, providing complete transparency.
## Technical Details
**Calculations:**
- MACD Fast MA: EMA(close, fastLength)
- MACD Slow MA: EMA(close, slowLength)
- MACD Line: Fast MA - Slow MA
- Signal Line: SMA(MACD Line, signalLength)
- Volume MA: Exponential MA of volume
- High Volume: Current volume >= Volume MA × Ratio
**Signal logic:**
```
Buy Signal = (MACD crosses above Signal) AND (High volume in last N bars)
Sell Signal = (MACD crosses below Signal) AND (High volume in last N bars)
```
## Parameters Reference
| Parameter | Default | Description |
|-----------|---------|-------------|
| Volume Symbol | Blank | Manual override for volume source (leave blank for automatic detection) |
| Use CME Futures | False | Legacy option (automatic detection is now built-in) |
| Alert Session | 1530-2200 | Active session time range for alerts |
| Timezone | UTC+1 | Timezone for alert sessions |
| Volume MA Period | 20 | Number of periods for volume moving average |
| High Volume Ratio | 2.0 | Volume threshold multiplier (2.0 = 200% of average) |
| Volume Lookback | 5 | Number of bars to check for high volume confirmation |
| MACD Fast Length | 12 | Fast EMA period for MACD calculation |
| MACD Slow Length | 26 | Slow EMA period for MACD calculation |
| MACD Signal Length | 9 | Signal line SMA period |
| Only Buy | False | Filter to show only bullish signals |
| Only Sell | False | Filter to show only bearish signals |
| Show Signals | True | Display buy and sell labels on chart |
## Optimization Tips
**For volatile markets (crypto, small caps):**
- Increase High Volume Ratio to 2.5-3.0
- Reduce Volume Lookback to 3-4 bars
- Consider faster MACD settings (8, 17, 9)
**For stable markets (large-cap stocks, bonds):**
- Decrease High Volume Ratio to 1.5-1.8
- Increase Volume MA Period to 30-50
- Use standard MACD settings
**For forex (with automatic CME futures):**
- The indicator automatically uses CME futures when forex pairs are detected
- Set appropriate trading session based on your timezone
- Use Volume Lookback of 5-7 bars
- Consider session-based alerts only
- Monitor the information table to verify correct futures mapping
**For commodities (Gold, Silver, Oil, Copper):**
- The indicator automatically maps to COMEX and NYMEX futures
- Increase High Volume Ratio to 2.0-2.5 for metals
- Use slightly higher Volume MA Period (25-30) for smoother analysis
- Trade during active market hours for best volume data
- The information table will show the futures contract being used (orange highlight)
## Limitations and Considerations
**What this indicator does NOT do:**
- Does not predict future price direction
- Does not guarantee profitable trades
- Does not replace proper risk management
- Does not work well in extremely low-volume conditions
**Market conditions to avoid:**
- Pre-market and after-hours sessions (low volume)
- Major news events (volatile, unpredictable volume)
- Holidays and low-liquidity periods
- Extremely low float stocks
## Conclusion
Smart MACD Volume Trader represents a significant evolution of the traditional MACD indicator by combining volume confirmation with automatic institutional volume integration. This dual-confirmation approach significantly improves signal quality by filtering out low-conviction price movements and ensuring traders work with accurate volume data.
The indicator's automatic detection and mapping system supports over 24 instruments across forex, commodities, and metals markets. By intelligently switching to CME and COMEX futures contracts when appropriate, the indicator provides forex and commodity traders with the same quality of volume data that stock traders naturally have access to.
This indicator is particularly valuable for traders who want to:
- Align their entries with institutional money flow
- Avoid getting trapped in false breakouts
- Trade forex pairs with reliable volume data
- Access accurate volume information for gold, silver, and energy commodities
- Combine momentum and volume analysis in a single, streamlined tool
Whether you are day trading stocks, swing trading forex pairs, or positioning in commodities markets, this indicator provides a robust framework for identifying high-probability momentum trades backed by genuine institutional participation. The automatic futures mapping works seamlessly across all supported instruments, requiring no manual configuration or expertise in futures markets.
---
## Support and Updates
This indicator is actively maintained and updated based on user feedback and market conditions. For questions about implementation or custom modifications, please use the comments section below.
**Disclaimer:** This indicator is for educational and informational purposes only. Past performance does not guarantee future results. Always conduct your own analysis and risk management before trading.
Cerca negli script per "trigger"

Optimized ADX DI CCI Strategy### Key Features:
- Combines ADX, DI+/-, CCI, and RSI for signal generation.
- Supports customizable timeframes for indicators.
- Offers multiple exit conditions (Moving Average cross, ADX change, performance-based stop-loss).
- Tracks and displays trade statistics (e.g., win rate, capital growth, profit factor).
- Visualizes trades with labels and optional background coloring.
- Allows countertrading (opening an opposite trade after closing one).
1. **Indicator Calculation**:
- **ADX and DI+/-**: Calculated using the `ta.dmi` function with user-defined lengths for DI and ADX smoothing.
- **CCI**: Computed using the `ta.cci` function with a configurable source (default: `hlc3`) and length.
- **RSI (optional)**: Calculated using the `ta.rsi` function to filter overbought/oversold conditions.
- **Moving Averages**: Used for CCI signal smoothing and trade exits, with support for SMA, EMA, SMMA (RMA), WMA, and VWMA.
2. **Signal Generation**:
- **Buy Signal**: Triggered when DI+ > DI- (or DI+ crosses over DI-), CCI > MA (or CCI crosses over MA), and optional ADX/RSI filters are satisfied.
- **Sell Signal**: Triggered when DI+ < DI- (or DI- crosses over DI+), CCI < MA (or CCI crosses under MA), and optional ADX/RSI filters are satisfied.
3. **Trade Execution**:
- **Entry**: Long or short trades are opened using `strategy.entry` when signals are detected, provided trading is allowed (`allow_long`/`allow_short`) and equity is positive.
- **Exit**: Trades can be closed based on:
- Opposite signal (if no other exit conditions are used).
- MA cross (price crossing below/above the exit MA for long/short trades).
- ADX percentage change exceeding a threshold.
- Performance-based stop-loss (trade loss exceeding a percentage).
- **Countertrading**: If enabled, closing a trade triggers an opposite trade (e.g., closing a long opens a short).
4. **Visualization**:
- Labels are plotted at trade entries/exits (e.g., "BUY," "SELL," arrows).
- Optional background coloring highlights open trades (green for long, red for short).
- A statistics table displays real-time metrics (e.g., capital, win rates).
5. **Trade Tracking**:
- Tracks the number of long/short trades, wins, and overall performance.
- Monitors equity to prevent trading if it falls to zero.
### 2.3 Key Components
- **Indicator Calculations**: Uses `request.security` to fetch indicator data for the specified timeframe.
- **MA Function**: A custom `ma_func` handles different MA types for CCI and exit conditions.
- **Signal Logic**: Combines crossover/under checks with recent bar windows for flexibility.
- **Exit Conditions**: Multiple configurable exit strategies for risk management.
- **Statistics Table**: Updates dynamically with trade and capital metrics.
## 3. Configuration Options
The script provides extensive customization through input parameters, grouped for clarity in the TradingView settings panel. Below is a detailed breakdown of each setting and its impact.
### 3.1 Strategy Settings (Global)
- **Initial Capital**: Default `10000`. Sets the starting capital for backtesting.
- **Effect**: Determines the base equity for calculating position sizes and performance metrics.
- **Default Quantity Type**: `strategy.percent_of_equity` (50% of equity).
- **Effect**: Controls the size of each trade as a percentage of available equity.
- **Pyramiding**: Default `2`. Allows up to 2 simultaneous trades in the same direction.
- **Effect**: Enables multiple entries if conditions are met, increasing exposure.
- **Commission**: 0.2% per trade.
- **Effect**: Simulates trading fees, reducing net profit in backtesting.
- **Margin**: 100% for long and short trades.
- **Effect**: Assumes no leverage; adjust for margin trading simulations.
- **Calc on Every Tick**: `true`.
- **Effect**: Ensures real-time signal updates for precise execution.
### 3.2 Indicator Settings
- **Indicator Timeframe** (`indicator_timeframe`):
- **Options**: `""` (chart timeframe), `1`, `5`, `15`, `30`, `60`, `240`, `D`, `W`.
- **Default**: `""` (uses chart timeframe).
- **Effect**: Determines the timeframe for ADX, DI, CCI, and RSI calculations. A higher timeframe reduces noise but may delay signals.
### 3.3 ADX & DI Settings
- **DI Length** (`adx_di_len`):
- **Default**: `30`.
- **Range**: Minimum `1`.
- **Effect**: Sets the period for calculating DI+ and DI-. Longer periods smooth trends but reduce sensitivity.
- **ADX Smoothing Length** (`adx_smooth_len`):
- **Default**: `14`.
- **Range**: Minimum `1`.
- **Effect**: Smooths the ADX calculation. Longer periods produce smoother ADX values.
- **Use ADX Filter** (`use_adx_filter`):
- **Default**: `false`.
- **Effect**: If `true`, requires ADX to exceed the threshold for signals to be valid, filtering out weak trends.
- **ADX Threshold** (`adx_threshold`):
- **Default**: `25`.
- **Range**: Minimum `0`.
- **Effect**: Sets the minimum ADX value for valid signals when the filter is enabled. Higher values restrict trades to stronger trends.
### 3.4 CCI Settings
- **CCI Length** (`cci_length`):
- **Default**: `20`.
- **Range**: Minimum `1`.
- **Effect**: Sets the period for CCI calculation. Longer periods reduce noise but may lag.
- **CCI Source** (`cci_src`):
- **Default**: `hlc3` (average of high, low, close).
- **Effect**: Defines the price data for CCI. `hlc3` is standard, but users can choose other sources (e.g., `close`).
- **CCI MA Type** (`ma_type`):
- **Options**: `SMA`, `EMA`, `SMMA (RMA)`, `WMA`, `VWMA`.
- **Default**: `SMA`.
- **Effect**: Determines the moving average type for CCI signal smoothing. EMA is more responsive; VWMA weights by volume.
- **CCI MA Length** (`ma_length`):
- **Default**: `14`.
- **Range**: Minimum `1`.
- **Effect**: Sets the period for the CCI MA. Longer periods smooth the MA but may delay signals.
### 3.5 RSI Filter Settings
- **Use RSI Filter** (`use_rsi_filter`):
- **Default**: `false`.
- **Effect**: If `true`, applies RSI-based overbought/oversold filters to signals.
- **RSI Length** (`rsi_length`):
- **Default**: `14`.
- **Range**: Minimum `1`.
- **Effect**: Sets the period for RSI calculation. Longer periods reduce sensitivity.
- **RSI Lower Limit** (`rsi_lower_limit`):
- **Default**: `30`.
- **Range**: `0` to `100`.
- **Effect**: Defines the oversold threshold for buy signals. Lower values allow trades in more extreme conditions.
- **RSI Upper Limit** (`rsi_upper_limit`):
- **Default**: `70`.
- **Range**: `0` to `100`.
- **Effect**: Defines the overbought threshold for sell signals. Higher values allow trades in more extreme conditions.
### 3.6 Signal Settings
- **Cross Window** (`cross_window`):
- **Default**: `0`.
- **Range**: `0` to `5` bars.
- **Effect**: Specifies the lookback period for detecting DI+/- or CCI crosses. `0` requires crosses on the current bar; higher values allow recent crosses, increasing signal frequency.
- **Allow Long Trades** (`allow_long`):
- **Default**: `true`.
- **Effect**: Enables/disables new long trades. If `false`, only closing existing longs is allowed.
- **Allow Short Trades** (`allow_short`):
- **Default**: `true`.
- **Effect**: Enables/disables new short trades. If `false`, only closing existing shorts is allowed.
- **Require DI+/DI- Cross for Buy** (`buy_di_cross`):
- **Default**: `true`.
- **Effect**: If `true`, requires a DI+ crossover DI- for buy signals; if `false`, DI+ > DI- is sufficient.
- **Require CCI Cross for Buy** (`buy_cci_cross`):
- **Default**: `true`.
- **Effect**: If `true`, requires a CCI crossover MA for buy signals; if `false`, CCI > MA is sufficient.
- **Require DI+/DI- Cross for Sell** (`sell_di_cross`):
- **Default**: `true`.
- **Effect**: If `true`, requires a DI- crossover DI+ for sell signals; if `false`, DI+ < DI- is sufficient.
- **Require CCI Cross for Sell** (`sell_cci_cross`):
- **Default**: `true`.
- **Effect**: If `true`, requires a CCI crossunder MA for sell signals; if `false`, CCI < MA is sufficient.
- **Countertrade** (`countertrade`):
- **Default**: `true`.
- **Effect**: If `true`, closing a trade triggers an opposite trade (e.g., close long, open short) if allowed.
- **Color Background for Open Trades** (`color_background`):
- **Default**: `true`.
- **Effect**: If `true`, colors the chart background green for long trades and red for short trades.
### 3.7 Exit Settings
- **Use MA Cross for Exit** (`use_ma_exit`):
- **Default**: `true`.
- **Effect**: If `true`, closes trades when the price crosses the exit MA (below for long, above for short).
- **MA Length for Exit** (`ma_exit_length`):
- **Default**: `20`.
- **Range**: Minimum `1`.
- **Effect**: Sets the period for the exit MA. Longer periods delay exits.
- **MA Type for Exit** (`ma_exit_type`):
- **Options**: `SMA`, `EMA`, `SMMA (RMA)`, `WMA`, `VWMA`.
- **Default**: `SMA`.
- **Effect**: Determines the MA type for exit signals. EMA is more responsive; VWMA weights by volume.
- **Use ADX Change Stop-Loss** (`use_adx_stop`):
- **Default**: `false`.
- **Effect**: If `true`, closes trades when the ADX changes by a specified percentage.
- **ADX % Change for Stop-Loss** (`adx_change_percent`):
- **Default**: `5.0`.
- **Range**: Minimum `0.0`, step `0.1`.
- **Effect**: Specifies the percentage change in ADX (vs. previous bar) that triggers a stop-loss. Higher values reduce premature exits.
- **Use Performance Stop-Loss** (`use_perf_stop`):
- **Default**: `false`.
- **Effect**: If `true`, closes trades when the loss exceeds a percentage threshold.
- **Performance Stop-Loss (%)** (`perf_stop_percent`):
- **Default**: `-10.0`.
- **Range**: `-100.0` to `0.0`, step `0.1`.
- **Effect**: Specifies the loss percentage that triggers a stop-loss. More negative values allow larger losses before exiting.
## 4. Visual and Statistical Output
- **Labels**: Displayed at trade entries/exits with arrows (↑ for buy, ↓ for sell) and text ("BUY," "SELL"). A "No Equity" label appears if equity is zero.
- **Background Coloring**: Optionally colors the chart background (green for long, red for short) to indicate open trades.
- **Statistics Table**: Displayed at the top center of the chart, updated on timeframe changes or trade events. Includes:
- **Capital Metrics**: Initial capital, current capital, capital growth (%).
- **Trade Metrics**: Total trades, long/short trades, win rate, long/short win rates, profit factor.
- **Open Trade Status**: Indicates if a long, short, or no trade is open.
## 5. Alerts
- **Buy Signal Alert**: Triggered when `buy_signal` is true ("Cross Buy Signal").
- **Sell Signal Alert**: Triggered when `sell_signal` is true ("Cross Sell Signal").
- **Usage**: Users can set up TradingView alerts to receive notifications for trade signals.

Opening Range Breakout🧭 Overview
The Open Range Breakout (ORB) indicator is designed to capture and display the initial price range of the trading day (typically the first 15 minutes), and help traders identify breakout opportunities beyond this range. This is a popular strategy among intraday and momentum traders.
🔧 Features
📊 ORB High/Low Lines
Plots horizontal lines for the session’s high and low
🟩 Breakout Zones
Background highlights when price breaks above or below the range
🏷️ Breakout Labels
Text labels marking breakout events
🧭 Session Control
Customizable session input (default: 09:15–09:30 IST)
📍 ORB Line Labels
Text labels anchored to the ORB high and low lines (aligned right)
🔔 Alerts
Configurable alerts for breakout events
⚙️ Adjustable Settings
Show/hide background, labels, session window, etc.
⏱️ Session Logic
• The ORB range is calculated during a defined session window (default: 09:15–09:30).
• During this window, the highest high and lowest low are recorded as ORB High and ORB Low.
📈 Breakout Detection
• Breakout Above: Triggered when price crosses above the ORB High.
• Breakout Below: Triggered when price crosses below the ORB Low.
• Each breakout can trigger:
• A background highlight (green/red)
• A text label (“Breakout ↑” / “Breakout ↓”)
• An optional alert
🔔 Alerts
Two built-in alert conditions:
1. Breakout Above ORB High
• Message: "🔼 Price broke above ORB High: {{close}}"
2. Breakout Below ORB Low
• Message: "🔽 Price broke below ORB Low: {{close}}"
You can create alerts in TradingView by selecting these from the Add Alert window.
📌 Best Use Cases
• Intraday momentum trading
• Breakout and scalping strategies
• First 15-minute range traders (NSE, BSE markets)

Multi-Moving Average Buy/Sell IndicatorThis Multi-Moving Average Buy/Sell Indicator is a powerful and customizable tool designed to help traders identify potential buy and sell signals based on the interaction between price and multiple moving averages. Whether you're a day trader, swing trader, or long-term investor, this indicator provides clear visual cues and alerts to help you make informed trading decisions.
Key Features
1. Multiple Moving Averages
The indicator calculates four key moving averages:
9-period MA
20-period MA
50-period MA
180-period MA
You can choose the type of moving average:
SMA (Simple Moving Average)
EMA (Exponential Moving Average)
WMA (Weighted Moving Average)
2. Custom Timeframe
Select a custom timeframe from a user-friendly dropdown menu:
1 Minute
5 Minutes
15 Minutes
30 Minutes
1 Hour
4 Hours
Daily
Weekly
The indicator dynamically adjusts to the selected timeframe, making it suitable for all trading styles.
3. Buy/Sell Signals
Buy Signal: Triggered when the price crosses above any of the moving averages.
Sell Signal: Triggered when the price crosses below any of the moving averages.
Signals are displayed as labels on the chart:
Green "BUY" Label: Below the bar when a buy signal is triggered.
Red "SELL" Label: Above the bar when a sell signal is triggered.
4. Visualization
Toggle the visibility of all moving averages using the showAllMAs input.
Moving averages are plotted with distinct colors for easy identification:
9 MA: Blue
20 MA: Orange
50 MA: Purple
180 MA: Teal
5. Alerts
The indicator generates alerts for buy and sell signals, which can be used for notifications or automated trading.
How to Use
Add the Indicator:
Open TradingView and go to the Pine Script Editor.
Copy and paste the script into the editor.
Click Add to Chart.
Configure Inputs:
maType: Choose the type of moving average (SMA, EMA, WMA).
timeframe: Select a custom timeframe (e.g., "1 Minute", "Daily").
showSignals: Toggle to show or hide buy/sell signals.
showAllMAs: Toggle to show or hide all moving averages.
Interpret the Signals:
Look for green "BUY" labels below the bars for potential buy opportunities.
Look for red "SELL" labels above the bars for potential sell opportunities.
Set Alerts:
Use the built-in alert system to get notified when buy or sell signals are triggered.
Example Use Cases
Day Trading
Use a 1-minute or 5-minute timeframe with an EMA for quick signals.
Example Inputs:
maType = "EMA"
timeframe = "5 Minutes"
showAllMAs = true
Swing Trading
Use a daily timeframe with an SMA for longer-term signals.
Example Inputs:
maType = "SMA"
timeframe = "Daily"
showAllMAs = false
Why Use This Indicator?
Versatility: Suitable for all trading styles and timeframes.
Customization: Choose your preferred moving average type and timeframe.
Clear Signals: Easy-to-read buy/sell labels and moving averages.
Alerts: Never miss a trading opportunity with built-in alerts.
Limitations
False Signals:
The indicator may generate false signals in choppy or sideways markets. Always combine it with other tools (e.g., RSI, volume analysis) for better accuracy.
Timeframe Dependency:
The effectiveness of the signals depends on the selected timeframe. Shorter timeframes may produce more signals but with higher noise.
No Backtesting:
The script does not include backtesting functionality. Test the strategy manually on historical data.
Customization Options
Add More Moving Averages: Modify the script to include additional moving averages (e.g., 200 MA).
Change Signal Logic: Adjust the conditions for buy/sell signals (e.g., require confirmation from multiple moving averages).
Add Alerts for Specific MAs: Create separate alerts for signals based on specific moving averages (e.g., only 9 MA or 50 MA).

Multi-Band Comparison Strategy (CRYPTO)Multi-Band Comparison Strategy (CRYPTO)
Optimized for Cryptocurrency Trading
This Pine Script strategy is built from the ground up for traders who want to take advantage of cryptocurrency volatility using a confluence of advanced statistical bands. The strategy layers Bollinger Bands, Quantile Bands, and a unique Power-Law Band to map out crucial support/resistance zones. It then focuses on a Trigger Line—the lower standard deviation band of the upper quantile—to pinpoint precise entry and exit signals.
Key Features
Bollinger Band Overlay
The upper Bollinger Band visually shifts to yellow when price exceeds it, turning black otherwise. This offers a straightforward way to gauge heightened momentum or potential market slowdowns.
Quantile & Power-Law Integration
The script calculates upper and lower quantile bands to assess probabilistic price extremes.
A Power-Law Band is also available to measure historically significant return levels, providing further insight into overbought or oversold conditions in fast-moving crypto markets.
Standard Deviation Trigger
The lower standard deviation band of the upper quantile acts as the strategy’s trigger. If price consistently holds above this line, the strategy interprets it as a strong bullish signal (“green” zone). Conversely, dipping below indicates a “red” zone, signaling potential reversals or exits.
Consecutive Bar Confirmation
To reduce choppy signals, you can fine-tune the number of consecutive bars required to confirm an entry or exit. This helps filter out noise and false breaks—critical in the often-volatile crypto realm.
Adaptive for Multiple Timeframes
Whether you’re scalping on a 5-minute chart or swing trading on daily candles, the strategy’s flexible confirmation and overlay options cater to different market conditions and trading styles.
Complete Plot Customization
Easily toggle visibility of each band or line—Bollinger, Quantile, Power-Law, and more.
Built-in Simple and Exponential Moving Averages can be enabled to further contextualize market trends.
Why It Excels at Crypto
Cryptocurrencies are known for rapid price swings, and this strategy addresses exactly that by combining multiple statistical methods. The quantile-based confirmation reduces noise, while Bollinger and Power-Law bands help highlight breakout regions in trending markets. Traders have reported that it works seamlessly across various coins and tokens, adapting its triggers to each asset’s unique volatility profile.
Give it a try on your favorite cryptocurrency pairs. With advanced data handling, crisp visual cues, and adjustable confirmation logic, the Multi-Band Comparison Strategy provides a robust framework to capture profitable moves and mitigate risk in the ever-evolving crypto space.
FreedX Grid Backtest█ FreedX Grid Backtest is an open-source tool that offers accurate GRID calculations for GRID trading strategies. This advanced tool allows users to backtest GRID trading parameters with precision, accurately reflecting exchange functionalities. We are committed to enhancing trading strategies through precise backtesting solutions and address the issue of unreliable backtesting practices observed on GRID trading strategies. FreedX Grid Backtest is designed for optimal calculation speed and plotting efficiency, ensuring users to achieve fastest calculations during their analysis.
█ GRID TRADING STRATEGY SETTINGS
The core of the FreedX Grid Backtest tool lies in its ability to simulate grid trading strategies. Grid trading involves placing orders at regular intervals within a predefined price range, creating a grid of orders that capitalize on market volatility.
Features:
⚙️ Backtest Range:
→ Purpose: Allows users to specify the backtesting range of GRID strategy. Closes all positions at the end of this range.
→ How to Use: Drag the dates to fit the desired backtesting range.
⚙️ Investment & Compounding:
→ Purpose: Allows users to specify the total investment amount and select between fixed and compound investment strategies. Compounding adjusts trade quantities based on performance, enhancing the grid strategy's adaptability to market changes.
→ How to Use: Set the desired investment amount and choose between "Fixed" or "Compound" for the investment method.
⚙️ Leverage & Grid Levels:
→ Purpose: Leverage amplifies the investment amount, increasing potential returns (and risks). Users can define the number of grid levels, which determines how the investment is distributed across the grid.
→ How to Use: Input the desired leverage and number of grids. The tool automatically calculates the distribution of funds across each grid level.
⚙️ Distribution Type & Mode:
→ Purpose: Users can select the distribution type (Arithmetic or Geometric) to set how grid levels are determined. The mode (Neutral, Long, Short) dictates the direction of trades within the grid.
→ How to Use: Choose the distribution type and mode based on the desired trading strategy and market outlook.
⚙️ Enable LONG/SHORT Grids exclusively:
█ MANUAL LEVELS AND STOP TRIGGERS
Beyond automated settings, the tool offers manual adjustments for traders seeking finer control over their grid strategies.
Features:
⚙️ Manual Level Adjustment:
→ Purpose: Enables traders to manually set the top, reference, and bottom levels of the grid, offering precision control over the trading range.
→ How to Use: Activate manual levels and adjust the top, reference, and bottom levels as needed to define the grid's scope.
⚙️ Stop Triggers:
→ Purpose: Provides an option to set upper and lower price limits, acting as stop triggers to close or terminate trades. This feature safeguards investments against significant market movements outside the anticipated range.
→ How to Use: Enable stop triggers and specify the upper and lower limits. The tool will automatically manage positions based on these parameters.
---
This guide gives you a quick and clear overview of the FreedX Grid Backtest tool, explaining how you can use this cutting-edge tool to improve your trading strategies.

SuperBollingerTrend (Expo)█ Overview
The SuperBollingerTrend indicator is a combination of two popular technical analysis tools, Bollinger Bands, and SuperTrend. By fusing these two indicators, SuperBollingerTrend aims to provide traders with a more comprehensive view of the market, accounting for both volatility and trend direction. By combining trend identification with volatility analysis, the SuperBollingerTrend indicator provides traders with valuable insights into potential trend changes. It recognizes that high volatility levels often accompany stronger price momentum, which can result in the formation of new trends or the continuation of existing ones.
█ How Volatility Impacts Trends
Volatility can impact trends by expanding or contracting them, triggering trend reversals, leading to breakouts, and influencing risk management decisions. Traders need to analyze and monitor volatility levels in conjunction with trend analysis to gain a comprehensive understanding of market dynamics.
█ How to use
Trend Reversals: High volatility can result in more dramatic price fluctuations, which may lead to sharp trend reversals. For example, a sudden increase in volatility can cause a bullish trend to transition into a bearish one, or vice versa, as traders react to significant price swings.
Volatility Breakouts: Volatility can trigger breakouts in trends. Breakouts occur when the price breaks through a significant support or resistance level, indicating a potential shift in the trend. Higher volatility levels can increase the likelihood of breakouts, as they indicate stronger market momentum and increased buying or selling pressure. This indicator triggers when the volatility increases, and if the price is near a key level when the indicator alerts, it might trigger a great trend.
█ Features
Peak Signal Move
The indicator calculates the peak price move for each ZigZag and displays it under each signal. This highlights how much the market moved between the signals.
Average ZigZag Move
All price moves between two signals are stored, and the average or the median is calculated and displayed in a table. This gives traders a great idea of how much the market moves on average between two signals.
Take Profit
The Take Profit line is placed at the average or the median price move and gives traders a great idea of what they can expect in average profit from the latest signals.
-----------------
Disclaimer
The information contained in my Scripts/Indicators/Ideas/Algos/Systems does not constitute financial advice or a solicitation to buy or sell any securities of any type. I will not accept liability for any loss or damage, including without limitation any loss of profit, which may arise directly or indirectly from the use of or reliance on such information.
All investments involve risk, and the past performance of a security, industry, sector, market, financial product, trading strategy, backtest, or individual's trading does not guarantee future results or returns. Investors are fully responsible for any investment decisions they make. Such decisions should be based solely on an evaluation of their financial circumstances, investment objectives, risk tolerance, and liquidity needs.
My Scripts/Indicators/Ideas/Algos/Systems are only for educational purposes!

Ultimate Screener TemplateHello Traders
With the Ultimate Strategy Template , I shared a template to connect any indicator to this template and get backtesting results in less than a few minutes
Now sharing another template ... many traders ask me to develop for them a screener/scanner based on a custom indicator on TradingView.
The current TradingView screeners are great but don't allow for much customization; as we can only select pre-defined filters
I don't know when we'll be able to natively screen among hundreds of assets with a custom indicator... then.... I created this template for the time being.... which should
A whole new world
The Ultimate Screener Template screens over 38 securities.
What's very cool is that you'll only need to create 1 alert to scan over 38 securities: Explanation with this image here
I totally understand that not all TradingView accounts have a lot of alarms; with this template, you can multiply the number of custom alerts you're initially allowed to.
What if I need to set alerts on more than 38 securities?
Pretty straightforward... you can create alerts only if the indicator is added to your chart first.
So if you need let's say 100 securities, add this indicator 3 times on your chart (38*3 > 100) and then... edit the securities for your 3 indicators
How to update your Screener settings
Alert mode
As per Pinescript reference , this template allows setting the alert frequency
Possible values are:
- alert.freq_all (all function calls trigger the alert)
- alert.freq_once_per_bar (the first function call during the bar triggers the alert)
- alert.freq_once_per_bar_close (the function call triggers the alert only when it occurs during the last script iteration of the real-time bar when it closes).
All-time-high and All-time-low
This template shows how to capture ATH and ATL alerts across many securities
I used the functions from Quantnomad:
Whenever a new ATH or ATL is made, the screener will send a personalized alarm with a personalized text based on the security triggering this alarm
The code is pretty straightforward and shows you the part you'll need to update to transform your favorite custom indicator into a powerful screener.
If anything is unclear in the code, please leave a comment and I'll respond as soon as possible
All the best
Dave
Efficient Work [LucF]█ OVERVIEW
Efficient Work measures the ratio of price movement from close to close ( resulting work ) over the distance traveled to the high and low before settling down at the close ( total work ). The closer the two values are, the more Efficient Work approaches its maximum value of +1 for an up move or -1 for a down move. When price does not change, Efficient Work is zero.
Higher values of Efficient Work indicate more efficient price travel between the close of two successive bars, which I interpret to be more significant, regardless of the move's amplitude. Because it measures the direction and strength of price changes rather than their amplitude, Efficient Work may be thought of as a sentiment indicator.
█ CONCEPTS
This oscillator's design stems from a few key concepts.
Relative Levels
Other than the centerline, relative rather than absolute levels are used to identify levels of interest. Accordingly, no fixed levels correspond to overbought/oversold conditions. Relative levels of interest are identified using:
• A Donchian channel (historical highs/lows).
• The oscillator's position relative to higher timeframe values.
• Oscillator levels following points in time where a divergence is identified.
Higher timeframes
Two progressively higher timeframes are used to calculate larger-context values for the oscillator. The rationale underlying the use of timeframes higher than the chart's is that, while they change less frequently than the values calculated at the chart's resolution, they are more meaningful because more work (trader activity) is required to calculate them. Combining the immediacy of values calculated at the chart's resolution to higher timeframe values achieves a compromise between responsiveness and reliability.
Divergences as points of interest rather than directional clues
A very simple interpretation of what constitutes a divergence is used. A divergence is defined as a discrepancy between any bar's direction and the direction of the signal line on that same bar. No attempt is made to attribute a directional bias to divergences when they occur. Instead, the oscillator's level is saved and subsequent movement of the oscillator relative to the saved level is what determines the bullish/bearish state of the oscillator.
Conservative coloring scheme
Several additive coloring conditions allow the bull/bear coloring of the oscillator's main line to be restricted to specific areas meeting all the selected conditions. The concept is built on the premise that most of the time, an oscillator's value should be viewed as mere noise, and that somewhat like price, it only occasionally conveys actionable information.
█ FEATURES
Plots
• Three lines can be plotted. They are named Main line , Line 2 and Line 3 . You decide which calculation to use for each line:
• The oscillator's value at the chart's resolution.
• The oscillator's value at a medium timeframe higher than the chart's resolution.
• The oscillator's value at the highest timeframe.
• An aggregate line calculated using a weighed average of the three previous lines (see the Aggregate Weights section of Inputs to configure the weights).
• The coloring conditions, divergence levels and the Hi/Lo channel always apply to the Main line, whichever calculation you decide to use for it.
• The color of lines 2 and 3 are fixed but can be set in the "Colors" section of Inputs.
• You can change the thickness of each line.
• When the aggregate line is displayed, higher timeframe values are only used in its calculation when they become available in the chart's history,
otherwise the aggregate line would appear much later on the chart. To indicate when each higher timeframe value becomes available,
a small label appears near the centerline.
• Divergences can be shown as small dots on the centerline.
• Divergence levels can be shown. The level and fill are determined by the oscillator's position relative to the last saved divergence level.
• Bull/bear markers can be displayed. They occur whenever a new bull/bear state is determined by the "Main Line Coloring Conditions".
• The Hi/Lo (Donchian) channel can be displayed, and its period defined.
• The background can display the state of any one of 11 different conditions.
• The resolutions used for the higher timeframes can be displayed to the right of the last bar's value.
• Four key values are always displayed in the Data Window (fourth icon down to the right of your chart):
oscillator values for the chart, medium and highest timeframes, and the oscillator's instant value before it is averaged.
Main Line Coloring Conditions
• Nine different conditions can be selected to determine the bull/bear coloring of the main line. All conditions set to "ON" must be met to determine the bull/bear state.
• A volatility state can also be used to filter the conditions.
• When the coloring conditions and the filter do not allow for a bull/bear state to be determined, the neutral color is used.
Signal
• Seven different averages can be used to calculate the average of the oscillator's value.
• The average's period can be set. A period of one will show the instant value of the oscillator,
provided you don't use linear regression or the Hull MA as they do not work with a period of one.
• An external signal can be used as the oscillator's instant value. If an already averaged external value is used, set the period to one in this indicator.
• For the cases where an external signal is used, a centerline value can be set.
Higher Timeframes
• The two higher timeframes are named Medium timeframe and Highest timeframe . They can be determined using one of three methods:
• Auto-steps: the higher timeframes are determined using the chart's resolution. If the chart uses a seconds resolution, for example,
the medium and highest resolutions will be 15 and 60 minutes.
• Multiples: the timeframes are calculated using a multiple of the chart's resolution, which you can set.
• Fixed: the set timeframes do not change with the chart's resolution.
Repainting
• Repainting can be controlled separately for the chart's value and the higher timeframe values.
• The default is a repainting chart value and non-repainting higher timeframe values. The Aggregate line will thus repaint by default,
as it uses the chart's value along with the higher timeframes values.
Aggregate Weights
• The weight of each component of the Aggregate line can be set.
• The default is equal weights for the three components, meaning that the chart's value accounts for one third of the weight in the Aggregate.
High Volatility
• This provides control over the volatility filter used in the Main line's coloring conditions and the background display.
• Volatility is determined to be high when the short-term ATR is greater than the long-term ATR.
Colors
• You can define your own colors for all of the oscillator's plots.
• The default colors will perform well on both white and black chart backgrounds.
Alerts
• An alert can be defined for the script. The alert will trigger whenever a bull/bear marker appears in the indicator's display.
The particular combination of coloring conditions and the display of bull/bear markers when you create the alert will thus determine when the alert triggers.
Once the alerts are created, subsequent changes to the conditions controlling the display of markers will not affect the existing alert(s).
• You can create multiple alerts from this script, each triggering on different conditions.
Backtesting & Trading Engine Signal Line
• An invisible plot named "BTE Signal" is provided. It can be used as an entry signal when connected to the PineCoders Backtesting & Trading Engine as an external input.
It will generate an entry whenever a marker is displayed.
█ NOTES
• I do not know for sure if the calculations in Efficient Work are original. I apologize if they are not.
• Because this version of Efficient Work only has access to OHLC information, it cannot measure the total distance traveled through all of a bar's ticks, but the indicator nonetheless behaves in a manner consistent with the intentions underlying its design.
For Pine coders
This code was written using the following standards:
• The PineCoders Coding Conventions for Pine .
• A modified version of the PineCoders MTF Oscillator Framework and MTF Selection Framework .

MTF Oscillator Framework [PineCoders]This framework allows Pine coders to quickly build a complete multi-timeframe oscillator from any calculation producing values around a centerline, whether the values are bounded or not. Insert your calculation in the script and you have a ready-to-publish MTF Oscillator offering a plethora of presentation options and features.
█ HOW TO USE THE FRAMEWORK
1 — Insert your calculation in the `f_signal()` function at the top of the "Helper Functions" section of the script.
2 — Change the script's name in the `study()` declaration statement and the `alertcondition()` text in the last part of the "Plots" section.
3 — Adapt the default value used to initialize the CENTERLINE constant in the script's "Constants" section.
4 — If you want to publish the script, copy/paste the following description in your new publication's description and replace the "OVERVIEW" section with a description of your calculations.
5 — Voilà!
═════════════════════════════════════════════════════════════════════════
█ OVERVIEW
This oscillator calculates a directional value of True Range. When a bar is up, the positive value of True Range is used. A negative value is used when the bar is down. When there is no movement during the bar, a zero value is generated, even if True Range is different than zero. Because the unit of measure of True Range is price, the oscillator is unbounded (it does not have fixed upper/lower bounds).
True Range can be used as a metric for volatility, but by using a signed value, this oscillator will show the directional bias of progressively increasing/decreasing volatility, which can make it more useful than an always positive value of True Range.
The True Range calculation appeared for the first time in J. Welles Wilder's New Concepts in Technical Trading Systems book published in 1978. Wilder's objective was to provide a reliable measure of the effective movement—or range—between two bars, to measure volatility. True Range is also the building block used to calculate ATR (Average True Range), which calculates the average of True Range values over a given period using the `rma` averaging method—the same used in the calculation of another of Wilder's remarkable creations: RSI.
█ CONCEPTS
This oscillator's design stems from a few key concepts.
Relative Levels
Other than the centerline, relative rather than absolute levels are used to identify levels of interest. Accordingly, no fixed levels correspond to overbought/oversold conditions. Relative levels of interest are identified using:
• A Donchian channel (historical highs/lows).
• The oscillator's position relative to higher timeframe values.
• Oscillator levels following points in time where a divergence is identified.
Higher timeframes
Two progressively higher timeframes are used to calculate larger-context values for the oscillator. The rationale underlying the use of timeframes higher than the chart's is that, while they change less frequently than the values calculated at the chart's resolution, they are more meaningful because more work (trader activity) is required to calculate them. Combining the immediacy of values calculated at the chart's resolution to higher timeframe values achieves a compromise between responsiveness and reliability.
Divergences as points of interest rather than directional clues
A very simple interpretation of what constitutes a divergence is used. A divergence is defined as a discrepancy between any bar's direction and the direction of the signal line on that same bar. No attempt is made to attribute a directional bias to divergences when they occur. Instead, the oscillator's level is saved and subsequent movement of the oscillator relative to the saved level is what determines the bullish/bearish state of the oscillator.
Conservative coloring scheme
Several additive coloring conditions allow the bull/bear coloring of the oscillator's main line to be restricted to specific areas meeting all the selected conditions. The concept is built on the premise that most of the time, an oscillator's value should be viewed as mere noise, and that somewhat like price, it only occasionally conveys actionable information.
█ FEATURES
Plots
• Three lines can be plotted. They are named Main line , Line 2 and Line 3 . You decide which calculation to use for each line:
• The oscillator's value at the chart's resolution.
• The oscillator's value at a medium timeframe higher than the chart's resolution.
• The oscillator's value at the highest timeframe.
• An aggregate line calculated using a weighed average of the three previous lines (see the Aggregate Weights section of Inputs to configure the weights).
• The coloring conditions, divergence levels and the Hi/Lo channel always apply to the Main line, whichever calculation you decide to use for it.
• The color of lines 2 and 3 are fixed but can be set in the "Colors" section of Inputs.
• You can change the thickness of each line.
• When the aggregate line is displayed, higher timeframe values are only used in its calculation when they become available in the chart's history,
otherwise the aggregate line would appear much later on the chart. To indicate when each higher timeframe value becomes available,
a small label appears near the centerline.
• Divergences can be shown as small dots on the centerline.
• Divergence levels can be shown. The level and fill are determined by the oscillator's position relative to the last saved divergence level.
• Bull/bear markers can be displayed. They occur whenever a new bull/bear state is determined by the "Main Line Coloring Conditions".
• The Hi/Lo (Donchian) channel can be displayed, and its period defined.
• The background can display the state of any one of 11 different conditions.
• The resolutions used for the higher timeframes can be displayed to the right of the last bar's value.
• Four key values are always displayed in the Data Window (fourth icon down to the right of your chart):
oscillator values for the chart, medium and highest timeframes, and the oscillator's instant value before it is averaged.
Main Line Coloring Conditions
• Nine different conditions can be selected to determine the bull/bear coloring of the main line. All conditions set to "ON" must be met to determine the bull/bear state.
• A volatility state can also be used to filter the conditions.
• When the coloring conditions and the filter do not allow for a bull/bear state to be determined, the neutral color is used.
Signal
• Seven different averages can be used to calculate the average of the oscillator's value.
• The average's period can be set. A period of one will show the instant value of the oscillator,
provided you don't use linear regression or the Hull MA as they do not work with a period of one.
• An external signal can be used as the oscillator's instant value. If an already averaged external value is used, set the period to one in this indicator.
• For the cases where an external signal is used, a centerline value can be set.
Higher Timeframes
• The two higher timeframes are named Medium timeframe and Highest timeframe . They can be determined using one of three methods:
• Auto-steps: the higher timeframes are determined using the chart's resolution. If the chart uses a seconds resolution, for example,
the medium and highest resolutions will be 15 and 60 minutes.
• Multiples: the timeframes are calculated using a multiple of the chart's resolution, which you can set.
• Fixed: the set timeframes do not change with the chart's resolution.
Repainting
• Repainting can be controlled separately for the chart's value and the higher timeframe values.
• The default is a repainting chart value and non-repainting higher timeframe values. The Aggregate line will thus repaint by default,
as it uses the chart's value along with the higher timeframes values.
Aggregate Weights
• The weight of each component of the Aggregate line can be set.
• The default is equal weights for the three components, meaning that the chart's value accounts for one third of the weight in the Aggregate.
High Volatility
• This provides control over the volatility filter used in the Main line's coloring conditions and the background display.
• Volatility is determined to be high when the short-term ATR is greater than the long-term ATR.
Colors
• You can define your own colors for all of the oscillator's plots.
• The default colors will perform well on both white and black chart backgrounds.
Alerts
• An alert can be defined for the script. The alert will trigger whenever a bull/bear marker appears in the indicator's display.
The particular combination of coloring conditions and the display of bull/bear markers when you create the alert will thus determine when the alert triggers.
Once the alerts are created, subsequent changes to the conditions controlling the display of markers will not affect the existing alert(s).
• You can create multiple alerts from this script, each triggering on different conditions.
Backtesting & Trading Engine Signal Line
• An invisible plot named "BTE Signal" is provided. It can be used as an entry signal when connected to the PineCoders Backtesting & Trading Engine as an external input.
It will generate an entry whenever a marker is displayed.
Look first. Then leap.

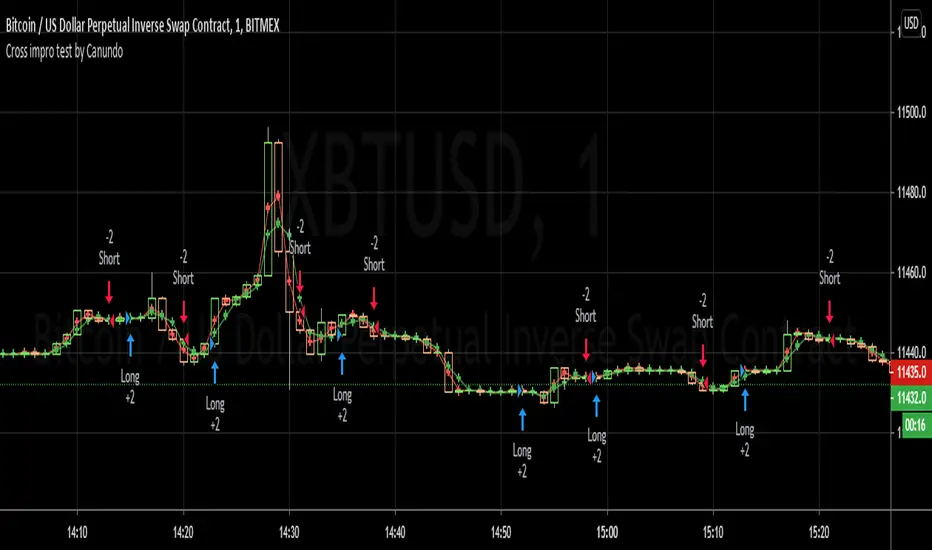
Cross impro test by Canundo Crossover Crossunder Tick valuesThis is a script where I tried to check the following things:
Even thought the tick of an asset is, for example 0.5, there are calculated prices, like SMA's that have even more decimals. Leading to crosses happening that for example happen at the same price. Consequently triggering totally useless in side markets. What happens if SMA values are restricted to the tick resolution? (Option works on it's own or with a combination of the others.)
What happens if I set my own tick value, like 0.8 instead of 0.5, what will be the effect for calculated values that are used for crossings? Will tick sizes improve the success rate? (This option will work only when the first option is active.)
Can success rate, especially for sideway markets be improved when adding a spread between MA's, so that it triggers less in sideway markets? (Option works on it's own or with a combination of the others.)
First of all, I had a hard time to round prices properly when it needs to be dynamic and working for different assets with different amounts of decimal values in the tick. The solution is that abs(floor(syminfo.mintick)) will give you the amount of decimals a tick has. It works for all ticks that are at least lower than 10. I'm not sure how huge ticks are out there. I did not implement this solution at the end since I found another way to test it.
Findings:
The first option, when activated, takes out half the trades and raises the percent profitability by 8% so there is some effect. However, all of the tested options have less advantage than I hoped for but are nevertheless something worthy for sideway markets. The first option just forces the MA's from the example to use the tick resolution.
See these two images. One when the first option is off, the second when it's active.
The lines are the MA's with adjusted values, the crosses are the places of the MA's when left as is.
Here a screenshot of the third option set to the value 2 on the 1 minute XBTUSD chart.
The advantage is that less trades trigger that have a low change in price and so less trading fees will happen.
The disadvantage is that all options can implement some delay for a crossing since the crossing will trigger once a slightly bigger move into the direction was taken.
This test environment was not meant to be profitable but to test the effects.
Maybe someone finds it interesting or wanted to test the same, so here you can save some work.
Trade Secrets by Pratik - Dual Intraday StrategyThe "Trade Secrets by Pratik" strategy is a high-momentum, dual-direction trading system designed to capture explosive moves after brief market pullbacks. It relies on a rigorous combination of trend-following moving averages and a strength filter.
1. Core Concept
The strategy identifies "Clean Pullbacks"—brief pauses in a strong trend where the price stays strictly away from the short-term average (10 EMA). This indicates extreme momentum, as buyers (in an uptrend) or sellers (in a downtrend) are too aggressive to allow a deeper correction.
2. Technical Filters
Trend Direction: Price must be above both 10 and 35 EMAs for Buys, and below both for Sells.
Strength Filter (RSI): Requires an RSI > 60 for Longs (to ensure high demand) and RSI < 40 for Shorts (to ensure heavy selling pressure).
3. Trade Execution
The Setup: Look for a "Floating Candle"—a Red candle for Buys or a Green candle for Sells that does not touch the 10 EMA.
The Trigger: A trade is entered only if the very next candle breaks the "Setup Candle's" high (Buy) or low (Sell).
Risk-Reward: Aim for a fixed 1:3 Ratio, ensuring that one winner covers three losing trades.
4. Safety Logic
The system includes a "No-Same-Candle-Exit" rule, preventing the script from triggering a Stop Loss on the same bar as the Entry. This filters out immediate price "whipsaws" and ensures the trade has room to develop.

ShooterViz Lazy Trader EMA SystemShooterViz Lazy Trader EMA System - Complete User Guide
What This Script Does
This is a position scaling indicator that tells you exactly when to enter, add to, and exit trades using a simplified 5-EMA system. It removes the guesswork and decision fatigue from trading by giving you clear visual signals.
The Core Concept
3 entry signals that build your position from 20% → 50% → 100%
2 exit signals that scale you out at 50% → 50% (complete exit)
1 higher timeframe filter that keeps you on the right side of the trend
No Fibonacci calculations, no RSI divergence, no multi-indicator confusion. Just EMAs and price action.
What You'll See On Your Chart
1. Colored EMA Lines
Blue Lines (Entry Zone):
3 EMA (lightest blue) - Early reversal detector
5 EMA (darker blue) - Confirmation line
Green Lines (Add Zone):
21 EMA (bright green) - First add location
34 EMA (lighter green) - Final add location
Red Lines (Exit Zone):
89 EMA (lighter red) - First exit trigger
144 EMA (darker red) - Final exit trigger
Orange Lines (Hyper Frame - optional):
Hyper 21 EMA (from higher timeframe) - Trend direction
Hyper 34 EMA (from higher timeframe) - Bias confirmation
2. Triangle Signals
Green Triangles (Below Price) = BUY/ADD:
Lime triangle with "20%" = Entry 1: Price reclaimed 3→5 EMA (starter position)
Green triangle with "30%" = Entry 2: Price bounced off 21 EMA (first add)
Teal triangle with "50%" = Entry 3: Price broke out from 34 EMA compression (final add)
Red Triangles (Above Price) = SELL:
Orange triangle with "50% OFF" = Exit 1: Price broke below 89 EMA (take half off)
Red triangle with "EXIT ALL" = Exit 2: Price broke below 144 EMA (close remaining position)
3. Background Color (Trend Bias)
Light green background = Hyper frame EMAs trending up (bias LONG)
Light red background = Hyper frame EMAs trending down (bias SHORT)
Gray background = Neutral/choppy (be cautious)
4. Info Table (Top Right Corner)
A live status dashboard showing:
Which entry signals are currently active (✓ or —)
Which exit signals are currently active (⚠ or ⛔)
Current hyper frame bias (🟢 LONG / 🔴 SHORT / ⚪ NEUTRAL)
Which timeframe you're using for hyper frame filtering
How to Install and Set Up
Step 1: Add the Script to TradingView
Open TradingView
Click "Pine Editor" at the bottom of the screen
Copy the entire script code
Paste it into the Pine Editor
Click "Add to Chart"
Step 2: Configure Your Settings
Click the gear icon ⚙️ next to "LazyEMA" in your indicators list.
Critical Settings to Configure:
Hyper Frame Selection (Most Important!)
Location: "Hyper Frame (Pick ONE)" section
Setting: "Timeframe"
What to choose:
Trading 15min or 1H charts? → Use "240" (4-hour)
Trading 4H or Daily charts? → Use "D" (Daily)
Trading Daily or Weekly charts? → Use "W" (Weekly)
Why this matters: This filter keeps you aligned with the bigger trend. Only take longs when this timeframe is green, shorts when it's red.
MA Type (Optional, default is fine)
Location: "MA Config" section
Default: EMA (recommended)
Options: EMA, SMA, WMA, HMA, RMA, VWMA
Most traders should stick with EMA
Visual Toggles (Customize your view)
Entry Zone: Turn individual EMAs on/off (3, 5, 21, 34)
Exit Zone: Turn individual EMAs on/off (89, 144)
Hyper Frame: Toggle the higher timeframe EMAs on/off
Step 3: Clean Up Your Chart
Turn OFF these if visible:
Volume bars (they clutter the view)
Any other indicators you have loaded
Grid lines (optional, but cleaner)
Keep ONLY:
Price candles
Your ShooterViz Lazy Trader EMA System
Maybe support/resistance levels if you manually draw them
How to Trade With This Script
The Basic Workflow
Before the Market Opens:
Check the background color and info table bias
Green background? Look for LONG setups only
Red background? Look for SHORT setups only
Gray background? Stay flat or trade small
During the Trading Session:
LONGS (When hyper frame is bullish):
Wait for Entry 1 signal:
Lime triangle appears with "20%"
Price has reclaimed the 5 EMA after dipping to 3 EMA
Action: Enter 20% of your intended position
Stop loss: Place below the 5 EMA or recent swing low
Wait for Entry 2 signal:
Green triangle appears with "30%"
Price pulled back to 21 EMA and bounced
Action: Add 30% more (you're now at 50% total)
Move stop: Trail it up to below 21 EMA
Wait for Entry 3 signal:
Teal triangle appears with "50%"
Price compressed at 34 EMA and broke out
Action: Add final 50% (you're now 100% loaded)
Move stop: Trail it up to below 34 EMA
Wait for Exit 1 signal:
Orange triangle appears with "50% OFF"
Price broke below 89 EMA
Action: Exit 50% of your position immediately
Move stop on rest: Trail to 89 EMA or lock in profits
Wait for Exit 2 signal:
Red triangle appears with "EXIT ALL"
Price broke below 144 EMA
Action: Exit remaining 50% (you're now flat)
Or: Stop gets hit at 89 EMA (same result)
SHORTS (When hyper frame is bearish):
Same process, but inverted
Triangles appear above price instead of below
Look for breakdowns below EMAs instead of bounces off them
Exit when price reclaims 89 and 144 EMAs
Real-World Example Walkthrough
Setup: Trading ES (S&P 500 Futures) on 1H Chart
Chart Configuration:
Timeframe: 1 Hour
Hyper Frame: 240 (4-hour)
Ticker: ES
Pre-Market Check:
Background is light green
Info table shows "🟢 LONG" for Hyper Bias
Decision: Only look for long entries today
9:30 AM - Market Opens
Price dips and touches 3 EMA
Watch for: Reclaim of 5 EMA
9:45 AM - Entry 1 Triggers
Lime triangle appears below bar
Price closed above 5 EMA at $4,550
Action taken:
Enter long 20% position (2 contracts if targeting 10 total)
Stop loss at $4,545 (below 5 EMA)
Risk: $10 per contract × 2 = $20 risk
10:30 AM - Entry 2 Triggers
Price rallied to $4,565, pulls back
Green triangle appears at 21 EMA ($4,555)
Action taken:
Add 30% (3 more contracts, now have 5 total)
Move stop to $4,550 (below 21 EMA)
Current P/L: +$25 ($5 gain on original 2 contracts, break-even on new 3)
11:15 AM - Entry 3 Triggers
Price consolidates at 34 EMA around $4,560
Teal triangle appears as price breaks to $4,568
Action taken:
Add final 50% (5 more contracts, now have 10 total)
Move stop to $4,555 (below 34 EMA)
Current P/L: +$70
1:00 PM - Price Extends
Price rallies to $4,595 (on track)
89 EMA is at $4,575
No action yet, let it run
2:15 PM - Exit 1 Triggers
Price pulls back from $4,600
Orange triangle appears as price breaks below 89 EMA at $4,580
Action taken:
Exit 50% (5 contracts closed at $4,580)
Keep 5 contracts with stop at 89 EMA ($4,575)
Banked: +$150 average gain on closed 5 contracts
2:45 PM - Exit 2 Triggers
Price continues down
Red triangle appears as price breaks 144 EMA at $4,570
Action taken:
Exit remaining 5 contracts at $4,570
Banked: +$100 on remaining 5 contracts
Final Results:
Total gain: $250 on the trade
Initial risk: $50 (if stopped out at Entry 1)
Risk/Reward: 5:1
Time in trade: ~5 hours
Common Questions
"What if I miss Entry 1? Can I still take Entry 2?"
Yes! Each entry is independent. If you miss the 3→5 reclaim, wait for the 21 EMA bounce. You'll start with a 30% position instead of 20%, but that's fine.
Rule: Never chase. Wait for the next EMA setup.
"What if multiple entry signals trigger at the same bar?"
Rare, but possible. If you see both Entry 1 and Entry 2 trigger together:
Take Entry 1 first (20%)
If the next bar confirms Entry 2 is still valid, add 30%
When in doubt, scale in gradually
"The hyper frame is green but I'm seeing short signals?"
Don't take them. The hyper frame is your bias filter. If it says "go long," ignore short setups. They're usually lower probability and will get stopped out.
"Can I use this for swing trading overnight?"
Absolutely. Just switch your hyper frame:
If you're on Daily charts, use Weekly hyper frame
If you're on 4H charts, use Daily hyper frame
Adjust position sizes for overnight risk
"What if the signal appears right at market close?"
Don't chase it. Wait for the next bar (next day) to confirm. Signals that appear in the last 5 minutes are often noise.
"How do I set up alerts?"
Right-click on the chart
Select "Add Alert"
Choose "LazyEMA" from the condition dropdown
Select which signal you want alerts for:
Entry 1: 3→5 Reclaim
Entry 2: 21 EMA Add
Entry 3: 34 EMA Breakout
Exit 1: 89 EMA Break
Exit 2: 144 EMA Break
Click "Create"
Pro tip: Set up all 5 alerts so you never miss a signal.
Position Sizing Guide see
swingtradenotes.substack.com
Critical Rule: Know your total risk BEFORE you take Entry 1. Don't wing it.
Customization Tips
For Day Traders (Scalpers)
Use 5min or 15min charts
Hyper frame: 1H or 4H
Expect 2-4 setups per day
Tighter stops (0.5% risk per entry)
For Swing Traders
Use 4H or Daily charts
Hyper frame: Daily or Weekly
Expect 1-2 setups per week
Wider stops (1-2% risk per entry)
For Position Traders
Use Daily or Weekly charts
Hyper frame: Weekly or Monthly
Expect 1-2 setups per month
Widest stops (2-3% risk per entry)
The "Don't Be Stupid" Checklist
Before taking ANY signal from this script, ask:
✅ Is the hyper frame bias pointing in my direction?
✅ Is the signal clean (not at a weird time or during news)?
✅ Do I know my stop loss level?
✅ Do I know my position size?
✅ Can I afford to lose if this trade fails?
If you answered "no" to ANY of these, skip the trade.
Troubleshooting
"I'm not seeing any signals"
Possible causes:
The "Show Lazy Trader System" toggle is off (turn it on)
Your chart timeframe is too high (try 1H or 4H)
Market is in a tight range (EMAs are compressed)
You need to refresh the chart
"Too many signals, getting whipsawed"
Fixes:
Increase your chart timeframe (go from 15m to 1H)
Switch to a less volatile ticker
Only trade when hyper frame bias is STRONG (not neutral)
Add a minimum bar count between signals
"The info table is covering my price action"
Fix:
Edit the script
Find the line: table.new(position.top_right, ...
Change position.top_right to position.bottom_right or position.top_left
"Signals appear then disappear"
This is normal (repainting). Some signals (especially compression breakouts) can disappear if the next bar reverses. This is why you:
Wait for bar close before acting
Use alerts that only fire on confirmed bars
Don't chase signals mid-bar
Final Thoughts
This script is a decision-making tool, not a crystal ball. It shows you high-probability setups based on EMA dynamics and trend structure. You still need to:
Manage your risk
Choose your position size
Stick to the rules
Accept losses when they happen
The system works when YOU work the system.
Print this guide, tape it next to your monitor, and follow it religiously for 20 trades before making ANY changes.
Good luck, and stay lazy (the smart way).

Micro Pullback Entry SystemMicro Pullback Entry System - Quick Reference
The Pattern
▲ ENTRY (first green to break high)
│
┌──┴───┐
│ 1-3 │ ← PULLBACK (red candles)
│ red │ Stop = Low of this zone
└──────┘
│
┌──┴───┐
│ 3+ │ ← THE MOVE (green candles)
│green │ Strong momentum
└──────┘
Pattern Checklist
Requirement: Why It Matters
3+ green candlesConfirms momentum
1-3 red pullback Brief = momentum intact< 50% retracementShallow = buyers in controlVolume on entryConfirms breakout Above EMA Trend support
Status Flow
Scanning... → 📈 TRENDING → 👀 WATCHING → ⏳ FORMING → 🎯 ENTRY!
StatusMeaningActionScanningLooking for setupWait📈 TRENDINGGreen streak buildingMonitor👀 WATCHINGPullback startedPrepare⏳ FORMINGValid pullback readyGet ready!🎯 ENTRY!Signal triggeredExecute
Entry/Stop/Target
LevelLine ColorHow to SetEntryLime solidClose of signal candleStopRed dashedLow of pullbackTarget 1Aqua dottedEntry + (2 × Risk)Target 2Yellow dottedEntry + (3 × Risk)
Example
Entry: $5.00
Stop: $4.80
Risk: $0.20
Target 1 (2R): $5.00 + $0.40 = $5.40
Target 2 (3R): $5.00 + $0.60 = $5.60
Quality Grades
GradeScoreActionA+5/5 ✓Best setup - full sizeA4/5 ✓Good setup - standard sizeB3/5 ✓Average - reduced sizeC2/5 ✓Weak - skip or tiny size
Scoring Factors
✓ Green streak met minimum
✓ Pullback length valid (1-3)
✓ Retracement shallow (<50%)
✓ Volume confirmed
✓ Above EMA
Trade Execution
Entry
Wait for "⏳ FORMING" status
Watch for green candle forming
Entry triggers when green candle closes above pullback high
Enter at market or small limit above current price
Stop Loss
Set at pullback low (red dashed line)
Non-negotiable - this is your max risk
Trade Management
If no immediate follow-through → exit early
Take 50% off at Target 1 (aqua line)
Move stop to breakeven
Let remainder run to Target 2
Settings Guide
Default (Recommended)
Min Green Candles: 3
Min Pullback: 1
Max Pullback: 3
Max Retracement: 50%
Volume Multiplier: 1.2x
EMA Filter: ON (20)
Conservative (Fewer, Better)
Min Green Candles: 4
Min Pullback: 2
Max Pullback: 3
Max Retracement: 40%
Volume Multiplier: 1.5x
EMA Filter: ON (20)
Aggressive (More Signals)
Min Green Candles: 2
Min Pullback: 1
Max Pullback: 4
Max Retracement: 60%
Volume Multiplier: 1.0x
EMA Filter: OFF
Common Mistakes
❌ Entering before signal
Wait for green triangle
"FORMING" ≠ "ENTRY"
❌ Wide stop
Stop must be at pullback low
If too wide, skip the trade
❌ Ignoring volume
Low volume entries fail more often
Look for ✓ in volume row
❌ Fighting trend
Check EMA status
Should show "Above ✓"
❌ Chasing after entry
If you miss entry by 3+ candles, wait for next setup
Don't chase extended moves
Best Setups
A+ Quality Setup ✓
4-5 green candles (strong move)
2 candle pullback (brief)
25-35% retracement (shallow)
2x+ volume on entry
Well above EMA
Stock already up 5%+ on day
Avoid These ✗
Only 2 green candles
4+ candle pullback (losing momentum)
50%+ retracement (too deep)
Below average volume
Below or at EMA
Against market direction
Timeframe Guide
TFSignalsQualityBest For1mMostLowerScalping5mBalancedGoodDay trading15mFewestHigherSwing entries
Quick Decision Tree
1. Status showing "FORMING"?
NO → Wait
YES → Continue
2. Quality grade A or better?
NO → Skip or small size
YES → Continue
3. Volume confirmed (✓)?
NO → Caution, reduce size
YES → Continue
4. Above EMA (✓)?
NO → Skip
YES → Continue
5. Risk acceptable? (Stop not too wide)
NO → Skip
YES → TAKE THE TRADE
Alert Setup
Essential Alert
"Micro Pullback Entry" - Main signal
How to Set
Right-click chart → Add Alert
Condition: Micro Pullback Entry System
Select "Micro Pullback Entry"
Set notification preferences
Combining with Other Indicators
IndicatorHow to Use5 PillarsFind stocks meeting criteria firstGap & GoLook for micro pullbacks after gap breakoutsR2G TrackerConfirm stock is green before enteringFloat RotationHigh rotation + micro pullback = best setupsBull FlagMicro pullback is a "mini" bull flag
Example Trade
Stock: XYZ
Pre-market: Gapped up 15%
9:35 - 9:38: 4 green candles (move from $4.50 to $5.00)
9:39 - 9:40: 2 red candles (pullback to $4.85)
9:41: Green candle breaks $4.90 (pullback high)
ENTRY: $4.92
STOP: $4.82 (pullback low)
RISK: $0.10
TARGET 1: $5.12 (+$0.20 = 2R)
TARGET 2: $5.22 (+$0.30 = 3R)
Result: Hit Target 2 by 9:55 → +$0.30 per share
Key Takeaways
Micro = 1-3 candles - Brief pullback
Entry = First green to break high - Specific trigger
Stop = Pullback low - Tight risk
Quality matters - Focus on A/A+ setups
Breakout or bailout - Exit if no follow-through

Hidden Impulse═══════════════════════════════════════════════════════════════════
HIDDEN IMPULSE - Multi-Timeframe Momentum Detection System
═══════════════════════════════════════════════════════════════════
OVERVIEW
Hidden Impulse is an advanced momentum oscillator that combines the Schaff Trend Cycle (STC) and Force Index into a comprehensive multi-timeframe trading system. Unlike standard implementations of these indicators, this script introduces three distinct trading setups with specific entry conditions, multi-timeframe confirmation, and trend filtering.
═══════════════════════════════════════════════════════════════════
ORIGINALITY & KEY FEATURES
This indicator is original in the following ways:
1. DUAL-TIMEFRAME STC ANALYSIS
Standard STC implementations work on a single timeframe. This script
simultaneously analyzes STC on both your trading timeframe and a higher
timeframe, providing trend context and filtering out low-probability signals.
2. FORCE INDEX INTEGRATION
The script combines STC with Force Index (volume-weighted price momentum)
to confirm the strength behind price moves. This combination helps identify
when momentum shifts are backed by genuine buying/selling pressure.
3. THREE DISTINCT TRADING SETUPS
Rather than generic overbought/oversold signals, the indicator provides
three specific, rule-based setups:
- Setup A: Classic trend-following entries with multi-timeframe confirmation
- Setup B: Divergence-based reversal entries (highest probability)
- Setup C: Mean-reversion bounce trades at extreme levels
4. INTELLIGENT FILTERING
All signals are filtered through:
- 50 EMA trend direction (prevents counter-trend trades)
- Higher timeframe STC alignment (ensures macro trend agreement)
- Force Index confirmation (validates volume support)
═══════════════════════════════════════════════════════════════════
HOW IT WORKS - TECHNICAL EXPLANATION
SCHAFF TREND CYCLE (STC) CALCULATION:
The STC is a cyclical oscillator that combines MACD concepts with stochastic
smoothing to create earlier and smoother trend signals.
Step 1: Calculate MACD
- Fast MA = EMA(close, Length1) — default 23
- Slow MA = EMA(close, Length2) — default 50
- MACD Line = Fast MA - Slow MA
Step 2: First Stochastic Smoothing
- Apply stochastic calculation to MACD
- Stoch1 = 100 × (MACD - Lowest(MACD, Smoothing)) / (Highest(MACD, Smoothing) - Lowest(MACD, Smoothing))
- Smooth result with EMA(Stoch1, Smoothing) — default 10
Step 3: Second Stochastic Smoothing
- Apply stochastic calculation again to the smoothed stochastic
- This creates the final STC value between 0-100
The dual stochastic smoothing makes STC more responsive than MACD while
being smoother than traditional stochastics.
FORCE INDEX CALCULATION:
Force Index measures the power behind price movements by incorporating volume:
Force Raw = (Close - Close ) × Volume
Force Index = EMA(Force Raw, Period) — default 13
Interpretation:
- Positive Force Index = Buying pressure (bulls in control)
- Negative Force Index = Selling pressure (bears in control)
- Force Index crossing zero = Momentum shift
- Divergences with price = Weakening momentum (reversal signal)
TREND FILTER:
A 50-period EMA serves as the trend filter:
- Price above EMA50 = Uptrend → Only LONG signals allowed
- Price below EMA50 = Downtrend → Only SHORT signals allowed
This prevents counter-trend trading which accounts for most losing trades.
═══════════════════════════════════════════════════════════════════
THE THREE TRADING SETUPS - DETAILED
SETUP A: CLASSIC MOMENTUM ENTRY
Concept: Enter when STC exits oversold/overbought zones with trend confirmation
LONG CONDITIONS:
1. Higher timeframe STC > 25 (macro trend is up)
2. Primary timeframe STC crosses above 25 (momentum turning up)
3. Force Index crosses above 0 OR already positive (volume confirms)
4. Price above 50 EMA (local trend is up)
SHORT CONDITIONS:
1. Higher timeframe STC < 75 (macro trend is down)
2. Primary timeframe STC crosses below 75 (momentum turning down)
3. Force Index crosses below 0 OR already negative (volume confirms)
4. Price below 50 EMA (local trend is down)
Best for: Trending markets, continuation trades
Win rate: Moderate (60-65%)
Risk/Reward: 1:2 to 1:3
───────────────────────────────────────────────────────────────────
SETUP B: DIVERGENCE REVERSAL (HIGHEST PROBABILITY)
Concept: Identify exhaustion points where price makes new extremes but
momentum (Force Index) fails to confirm
BULLISH DIVERGENCE:
1. Price makes a lower low (LL) over 10 bars
2. Force Index makes a higher low (HL) — refuses to follow price down
3. STC is below 25 (oversold condition)
Trigger: STC starts rising AND Force Index crosses above zero
BEARISH DIVERGENCE:
1. Price makes a higher high (HH) over 10 bars
2. Force Index makes a lower high (LH) — refuses to follow price up
3. STC is above 75 (overbought condition)
Trigger: STC starts falling AND Force Index crosses below zero
Why this works: Divergences signal that the current trend is losing steam.
When volume (Force Index) doesn't confirm new price extremes, a reversal
is likely.
Best for: Reversal trading, range-bound markets
Win rate: High (70-75%)
Risk/Reward: 1:3 to 1:5
───────────────────────────────────────────────────────────────────
SETUP C: QUICK BOUNCE AT EXTREMES
Concept: Catch rapid mean-reversion moves when price touches EMA50 in
extreme STC zones
LONG CONDITIONS:
1. Price touches 50 EMA from above (pullback in uptrend)
2. STC < 15 (extreme oversold)
3. Force Index > 0 (buyers stepping in)
SHORT CONDITIONS:
1. Price touches 50 EMA from below (pullback in downtrend)
2. STC > 85 (extreme overbought)
3. Force Index < 0 (sellers stepping in)
Best for: Scalping, quick mean-reversion trades
Win rate: Moderate (55-60%)
Risk/Reward: 1:1 to 1:2
Note: Use tighter stops and quick profit-taking
═══════════════════════════════════════════════════════════════════
HOW TO USE THE INDICATOR
STEP 1: CONFIGURE TIMEFRAMES
Primary Timeframe (STC - Primary Timeframe):
- Leave empty to use your current chart timeframe
- This is where you'll take trades
Higher Timeframe (STC - Higher Timeframe):
- Default: 30 minutes
- Recommended ratios:
* 5min chart → 30min higher TF
* 15min chart → 1H higher TF
* 1H chart → 4H higher TF
* Daily chart → Weekly higher TF
───────────────────────────────────────────────────────────────────
STEP 2: ADJUST STC PARAMETERS FOR YOUR MARKET
Default (23/50/10) works well for stocks and forex, but adjust for:
CRYPTO (volatile):
- Length 1: 15
- Length 2: 35
- Smoothing: 8
(Faster response for rapid price movements)
STOCKS (standard):
- Length 1: 23
- Length 2: 50
- Smoothing: 10
(Balanced settings)
FOREX MAJORS (slower):
- Length 1: 30
- Length 2: 60
- Smoothing: 12
(Filters out noise in 24/7 markets)
───────────────────────────────────────────────────────────────────
STEP 3: ENABLE YOUR PREFERRED SETUPS
Toggle setups based on your trading style:
Conservative Trader:
✓ Setup B (Divergence) — highest win rate
✗ Setup A (Classic) — only in strong trends
✗ Setup C (Bounce) — too aggressive
Trend Trader:
✓ Setup A (Classic) — primary signals
✓ Setup B (Divergence) — for entries on pullbacks
✗ Setup C (Bounce) — not suitable for trending
Scalper:
✓ Setup C (Bounce) — quick in-and-out
✓ Setup B (Divergence) — high probability scalps
✗ Setup A (Classic) — too slow
───────────────────────────────────────────────────────────────────
STEP 4: READ THE SIGNALS
ON THE CHART:
Labels appear when conditions are met:
Green labels:
- "LONG A" — Setup A long entry
- "LONG B DIV" — Setup B divergence long (best signal)
- "LONG C" — Setup C bounce long
Red labels:
- "SHORT A" — Setup A short entry
- "SHORT B DIV" — Setup B divergence short (best signal)
- "SHORT C" — Setup C bounce short
IN THE INDICATOR PANEL (bottom):
- Blue line = Primary timeframe STC
- Orange dots = Higher timeframe STC (optional)
- Green/Red bars = Force Index histogram
- Dashed lines at 25/75 = Entry/Exit zones
- Background shading = Oversold (green) / Overbought (red)
INFO TABLE (top-right corner):
Shows real-time status:
- STC values for both timeframes
- Force Index direction
- Price position vs EMA
- Current trend direction
- Active signal type
═══════════════════════════════════════════════════════════════════
TRADING STRATEGY & RISK MANAGEMENT
ENTRY RULES:
Priority ranking (best to worst):
1st: Setup B (Divergence) — wait for these
2nd: Setup A (Classic) — in confirmed trends only
3rd: Setup C (Bounce) — scalping only
Confirmation checklist before entry:
☑ Signal label appears on chart
☑ TREND in info table matches signal direction
☑ Higher timeframe STC aligned (check orange dots or table)
☑ Force Index confirming (check histogram color)
───────────────────────────────────────────────────────────────────
STOP LOSS PLACEMENT:
Setup A (Classic):
- LONG: Below recent swing low
- SHORT: Above recent swing high
- Typical: 1-2 ATR distance
Setup B (Divergence):
- LONG: Below the divergence low
- SHORT: Above the divergence high
- Typical: 0.5-1.5 ATR distance
Setup C (Bounce):
- LONG: 5-10 pips below EMA50
- SHORT: 5-10 pips above EMA50
- Typical: 0.3-0.8 ATR distance
───────────────────────────────────────────────────────────────────
TAKE PROFIT TARGETS:
Conservative approach:
- Exit when STC reaches opposite level
- LONG: Exit when STC > 75
- SHORT: Exit when STC < 25
Aggressive approach:
- Hold until opposite signal appears
- Trail stop as STC moves in your favor
Partial profits:
- Take 50% at 1:2 risk/reward
- Let remaining 50% run to target
───────────────────────────────────────────────────────────────────
WHAT TO AVOID:
❌ Trading Setup A in sideways/choppy markets
→ Wait for clear trend or use Setup B only
❌ Ignoring higher timeframe STC
→ Always check orange dots align with your direction
❌ Taking signals against the major trend
→ If weekly trend is down, be cautious with longs
❌ Overtrading Setup C
→ Maximum 2-3 bounce trades per session
❌ Trading during low volume periods
→ Force Index becomes unreliable
═══════════════════════════════════════════════════════════════════
ALERTS CONFIGURATION
The indicator includes 8 alert types:
Individual setup alerts:
- "Setup A - LONG" / "Setup A - SHORT"
- "Setup B - DIV LONG" / "Setup B - DIV SHORT" ⭐ recommended
- "Setup C - BOUNCE LONG" / "Setup C - BOUNCE SHORT"
Combined alerts:
- "ANY LONG" — fires on any long signal
- "ANY SHORT" — fires on any short signal
Recommended alert setup:
- Create "Setup B - DIV LONG" and "Setup B - DIV SHORT" alerts
- These are the highest probability signals
- Set "Once Per Bar Close" to avoid false alerts
═══════════════════════════════════════════════════════════════════
VISUALIZATION SETTINGS
Show Labels on Chart:
Toggle on/off the signal labels (green/red)
Disable for cleaner chart once you're familiar with the indicator
Show Higher TF STC:
Toggle the orange dots showing higher timeframe STC
Useful for visual confirmation of multi-timeframe alignment
Info Panel:
Cannot be disabled — always shows current status
Positioned top-right to avoid chart interference
═══════════════════════════════════════════════════════════════════
EXAMPLE TRADE WALKTHROUGH
SETUP B DIVERGENCE LONG EXAMPLE:
1. Market Context:
- Price in downtrend, below 50 EMA
- Multiple lower lows forming
- STC below 25 (oversold)
2. Divergence Formation:
- Price makes new low at $45.20
- Force Index refuses to make new low (higher low forms)
- This indicates selling pressure weakening
3. Signal Trigger:
- STC starts turning up
- Force Index crosses above zero
- Label appears: "LONG B DIV"
4. Trade Execution:
- Entry: $45.50 (current price at signal)
- Stop Loss: $44.80 (below divergence low)
- Target 1: $47.90 (STC reaches 75) — risk/reward 1:3.4
- Target 2: Opposite signal or trail stop
5. Trade Management:
- Price rallies to $47.20
- STC reaches 68 (approaching target zone)
- Take 50% profit, move stop to breakeven
- Exit remaining at $48.10 when STC crosses 75
Result: 3.7R gain
═══════════════════════════════════════════════════════════════════
ADVANCED TIPS
1. MULTI-TIMEFRAME CONFLUENCE
For highest probability trades, wait for:
- Primary TF signal
- Higher TF STC aligned (>25 for longs, <75 for shorts)
- Even higher TF trend in same direction (manual check)
2. VOLUME CONFIRMATION
Watch the Force Index histogram:
- Increasing bar size = Strengthening momentum
- Decreasing bar size = Weakening momentum
- Use this to gauge signal strength
3. AVOID THESE MARKET CONDITIONS
- Major news events (Force Index becomes erratic)
- Market open first 30 minutes (volatility spikes)
- Low liquidity instruments (Force Index unreliable)
- Extreme trending days (wait for pullbacks)
4. COMBINE WITH SUPPORT/RESISTANCE
Best signals occur near:
- Key horizontal levels
- Fibonacci retracements
- Previous day's high/low
- Psychological round numbers
5. SESSION AWARENESS
- Asia session: Use lower timeframes, Setup C works well
- London session: Setup A and B both effective
- New York session: All setups work, highest volume
═══════════════════════════════════════════════════════════════════
INDICATOR WINDOWS LAYOUT
MAIN CHART:
- Price action
- 50 EMA (green/red)
- Signal labels
- Info panel
INDICATOR WINDOW:
- STC oscillator (blue line, 0-100 scale)
- Higher TF STC (orange dots, optional)
- Force Index histogram (green/red bars)
- Reference levels (25, 50, 75)
- Background zones (green oversold, red overbought)
═══════════════════════════════════════════════════════════════════
PERFORMANCE OPTIMIZATION
For best results:
Backtesting:
- Test on your specific instrument and timeframe
- Adjust STC parameters if win rate < 55%
- Record which setup works best for your market
Position Sizing:
- Risk 1-2% per trade
- Setup B can use 2% risk (higher win rate)
- Setup C should use 1% risk (lower win rate)
Trade Frequency:
- Setup B: 2-5 signals per week (be patient)
- Setup A: 5-10 signals per week
- Setup C: 10+ signals per week (scalping)
═══════════════════════════════════════════════════════════════════
CREDITS & REFERENCES
This indicator builds upon established technical analysis concepts:
Schaff Trend Cycle:
- Developed by Doug Schaff (1996)
- Original concept published in Technical Analysis of Stocks & Commodities
- Implementation based on standard STC formula
Force Index:
- Developed by Dr. Alexander Elder
- Described in "Trading for a Living" (1993)
- Classic volume-momentum indicator
The multi-timeframe integration, three-setup system, and specific
entry conditions are original contributions of this indicator.
═══════════════════════════════════════════════════════════════════
DISCLAIMER
This indicator is a technical analysis tool and does not guarantee profits.
Past performance is not indicative of future results. Always:
- Use proper risk management
- Test on demo account first
- Combine with fundamental analysis
- Never risk more than you can afford to lose
═══════════════════════════════════════════════════════════════════
SUPPORT & QUESTIONS
If you find this indicator helpful, please:
- Leave a like and comment
- Share your feedback and results
- Report any bugs or issues
For questions about usage or optimization for specific markets,
feel free to comment below.
═════════════════════════════════════════════════════════════

JOPA Channel (Dual-Volumed) v1 [JopAlgo]JOPA Channel (Dual-Volumed) v1
Short title: JOPAV1 • License: MPL-2.0 • Provider: JopAlgo
We have developed our own, first channel-based trading indicator and we’re making it available to all traders. The goal was a channel that breathes with the tape—built on a volume-weighted backbone—so the outcome stays lively instead of static. That led to the JOPA Channel.
All important features (at a glance)
In one line: A Rolling-VWAP channel whose width adapts with two volumes (RVOL + dollar-flow), adds order-flow asymmetry (OBV tilt) and regime awareness (Efficiency Ratio), and frames risk with outer containment bands from residual extremes—so you see fair value, momentum, and exhaustion in one view.
Feature list
Rolling VWAP centerline: Tracks where volume traded (fair value).
Dual-volume width: Bands expand/contract with relative volume and value traded (price×volume).
OBV tilt: Upper/lower widths skew toward the side actually pushing.
Regime adapter (ER): Tighter in trend, wider in chop—automatically.
Outer containment rails: Residual-extreme ceilings/floors, smoothed + margin.
20% / 80% guides: 20% light blue (discount), 80% light red (premium).
Squeeze dots (optional): Orange circles below candles during compression.
Non-repainting: Uses rolling sums and past-only math; no lookahead.
Default visual in this release
Containment rails + fill: ON (stepline, medium).
Inner Value rails + fill: Rails OFF (stepline, thin), fill ON (drawn only if rails are shown).
20% & 80% guides: ON (dashed, thin; 20% light blue, 80% light red).
Squeeze dots: OFF by default (orange circles when enabled).
What you see on the chart
RVWAP (centerline): Your compass for fair value.
Inner Value Bands (optional): Tight rails for breakouts and pullback timing.
Outer Containment Bands (default ON): High-confidence ceilings/floors for targets and fades.
20% / 80% guides: Quick read of “where in the channel” price is sitting.
Squeeze dots (optional): Volatility compression heads-up (no text labels).
Non-repainting note: The indicator does not revise closed bars. Forecast-Lock uses linear regression to extrapolate 1–3 bars ahead without using future data.
How to use it
Core reads (works on any timeframe)
Bias: Above a rising RVWAP → long bias; below a falling RVWAP → short bias.
Breakouts (momentum): Close beyond an Inner Value rail with RVOL ≥ threshold (alert provided).
Reversions (fades): Tag Outer Containment, stall, then close back inside → expect mean reversion toward RVWAP.
20/80 timing:
At/above 80% (light red) → premium/exhaustion risk; trim longs or consider fades if RVOL cools.
At/below 20% (light blue) → discount/exhaustion risk; trim shorts or consider longs if RVOL cools.
Squeeze clusters: When dots bunch up, expect a range break; use the Breakout alert as confirmation.
Playbooks by trading style
Day Trading (1–5m)
Setup: Keep the chart clean (Containment ON, Value rails OFF). Toggle Inner Value ON when hunting a breakout or timing a pullback.
Pullback Long: Dip to RVWAP / Lower Value with sub-threshold RVOL, then a close back above RVWAP → long.
Stop: Just beyond Lower Containment or the pullback swing.
Targets (1:1:1): ⅓ at RVWAP, ⅓ at Upper Value, ⅓ trail toward Upper Containment.
Breakout Long: After a squeeze cluster, take the Breakout Long alert (close > Upper Value, RVOL ≥ min). If no retest, demand the next bar holds outside.
Range Fade: Only when RVWAP is flat and dots cluster; short Upper Containment → RVWAP (mirror for longs at the lower rail).
Intraday (15m–1H)
HTF compass: Take bias from 4H.
Pullback Long: “Touch & reclaim” of RVWAP while RVOL cools; enter on the reclaim close or break of that candle’s high.
Breakout: Run Inner Value ON; act on Breakout alerts (RVOL gate ≈ 1.10–1.15 typical).
Avoid low-probability fades against the 4H slope unless RVWAP is flat.
Swing (4H–1D)
Continuation: In uptrends, buy pullbacks to RVWAP / Lower Value with sub-threshold RVOL; scale at Upper Containment.
Adds: Post-squeeze Breakout Long adds; trail on RVWAP or Lower Value.
Fades: Prefer when RVWAP flattens and price oscillates between containments.
Position (1D+)
Framework: Daily RVWAP slope + position within containment.
Add rule: Each reclaim of RVWAP after a dip is an add; trim into Upper Containment or near 80% light red.
Sizing: Containment distance is larger—size down and trail on RVWAP.
Inputs & Settings (complete)
Core
Source: Price input for RVWAP.
Rolling VWAP Length: Window of the centerline (higher = smoother).
Volume Baseline (RVOL): SMA window for relative volume.
Inner Value Bands (volatility-based width)
k·StdDev(residuals), k·ATR, k·MAD(residuals): Blend three measures into base width.
StdDev / ATR / MAD Lengths: Lookbacks for each.
Two-Volume Fusion
RVOL Exponent: How aggressively width responds to relative volume.
Dollar-Flow Gain: Adds push from price×volume (value traded).
Dollar-Flow Z-Window: Standardization window for dollar-flow.
Asymmetry (Order-Flow Tilt)
Enable Tilt (OBV): Lets flow skew upper/lower widths.
Tilt Strength (0..1): Gain applied to OBV slope z-score.
OBV Slope Z-Window: Window to standardize OBV slope.
Regime Adapter
Efficiency Ratio Lookback: Measures trend vs chop.
ER Width Min/Max: Maps ER into a width factor (tighter in trend, wider in chop).
Band Tracking (inner value rails)
Tracking Mode:
Base: Pure base rails.
Parallel-Lock: Smooth RVWAP & width; track in parallel.
Slope-Lock: Adds a fraction of recent slope (momentum-friendly).
Forecast-Lock: 1–3 bar extrapolation via linreg (non-repainting on closed bars).
Attach Strength (0..1): Blend tracked rails vs base rails.
Tracking Smooth Length: EMA smoothing of RVWAP and width.
Slope Influence / Forecast Lead Bars: Gains for the chosen mode.
Outer Containment Bands
Show Containment Bands: Master toggle (default ON).
Residual Extremes Lookback: Highest/lowest residual window.
Extreme Smoothing (EMA): Stability on extreme lines.
Margin vs inner width: Extra padding relative to smoothed inner width.
Squeeze & Alerts
Squeeze Window / Threshold: Width vs average; at/under threshold = dot (when enabled).
Min RVOL for Breakout: Required RVOL for breakout alerts.
Style (defaults in this release)
Inner Value rails: OFF (stepline, thin).
Inner & Containment fills: ON.
Containment rails: ON (stepline, medium).
20% / 80% guides: ON — 20% light blue, 80% light red, dashed, thin.
Squeeze dots: OFF by default (orange circles below candles when enabled).
Practical templates (copy/paste into a plan)
Momentum Breakout
Context: Squeeze cluster near RVWAP; Inner Value ON.
Trigger: Breakout Long (close > Upper Value & RVOL ≥ min).
Stop: Below Lower Value (tight) or below RVWAP (safer).
Targets (1:1:1): ⅓ Value → ⅓ Containment → ⅓ trail on RVWAP.
Pullback Continuation
Context: Uptrend; dip to RVWAP / Lower Value with cooling RVOL.
Trigger: Close back above RVWAP or break of reclaim candle’s high.
Stop: Just outside Lower Containment or pullback swing.
Targets: RVWAP → Upper Value → Upper Containment.
Containment Reversion (range)
Context: RVWAP flat; repeated containment tags.
Trigger: Stall at containment, then close back inside.
Stop: A step beyond that containment.
Target: RVWAP; runner only if RVOL stays muted.
Alerts included
DVWAP Breakout Long / Short (Value Bands)
Top Zone / Bottom Zone (20% / 80% guides)
Tip: On lower TFs, act on Breakout alerts with higher-TF bias (e.g., trade 5–15m in the direction of 1H/4H RVWAP slope/position).
Best practices
Let RVWAP be the compass; if unsure, wait until price picks a side.
Respect RVOL; low-RVOL breaks are prone to fail.
Use guides for timing, not certainty. Pair 20/80 zones with flow context.
Start with defaults; change one knob at a time.
Common pitfalls
Fading every containment touch → only fade when RVWAP is flat or RVOL cools.
Over-tuning inputs → the defaults are robust; small tweaks go a long way.
Fighting the higher timeframe on low TFs → expensive habit.
Footer — License & Publishing
License: Mozilla Public License 2.0 (MPL-2.0). You may modify and redistribute; keep this file under MPL and provide source for this file.
Originality: © 2025 JopAlgo. No third-party code reused; Pine built-ins and common formulas only.
Publishing: Keep this header/description intact when releasing on TradingView. Avoid promotional links in the public script text.

HTF Cross Breakout [CHE] HTF Cross Breakout — Detects higher timeframe close crossovers for breakout signals, anchors VWAP for trend validation, and flags continuations or traps with visual extensions for delta percent and stop levels.
Summary
This indicator spots moments when the current chart's close price crosses a higher timeframe close, marking potential breakouts only when the current bar shows directional strength. It anchors a volume-weighted average price line from the breakout point to track trend health, updating labels to show if the move continues or reverses into a trap. Extensions add a dotted line linking the breakout level to the current close with percent change display, plus a stop-loss marker at the VWAP end. Signals gain robustness from higher timeframe confirmation and anti-repainting options, reducing noise in live bars compared to simple crossover tools.
Motivation: Why this design?
Traders often face false breakouts from intrabar wiggles on lower timeframes, especially without higher timeframe alignment, leading to whipsaws in volatile sessions. This design uses higher timeframe close as a stable reference for crossover detection, combined with anchored volume weighting to gauge sustained momentum. It addresses these by enforcing bar confirmation and directional filters, providing clearer entry validation and risk points without overcomplicating the chart.
What’s different vs. standard approaches?
Reference baseline
Standard crossover indicators like moving average crosses operate solely on the chart timeframe, ignoring higher timeframe context and lacking volume anchoring.
Architecture differences
- Higher timeframe data pulls via security calls with optional repainting control for stability.
- Anchored VWAP resets at each signal, accumulating from the breakout bar only.
- Label dynamics update in real-time for continuation checks, with extensions for visual delta and stop computation.
- Event-driven line finalization prunes old elements after a set bar extension.
Practical effect
Charts show persistent lines and labels that extend live but finalize cleanly on new events, avoiding clutter. This matters for spotting trap reversals early via label color shifts, and extensions provide quick risk visuals without manual calculations, improving decision speed in trend trades.
How it works (technical)
The indicator first determines a higher timeframe based on user selection, pulling its close price securely. It checks for crossovers or crossunders of the current close against this higher close, but only triggers on confirmed bars with matching directional opens and closes. On a valid event, a horizontal line and label mark the higher close level, while a dashed VWAP line starts accumulating typical price times volume from that bar onward. During the active phase, the breakout line extends to the current bar, the label repositions and updates text based on whether the current close holds above or below the level for bulls or bears. A background tint warns if the close deviates adversely from the current VWAP. Extensions draw a vertical dotted line at the last bar between the breakout level and close, placing a midpoint label with percent difference; separately, a label at the VWAP end shows a computed stop price. Persistent variables track the active state and accumulators, resetting on new events after briefly extending old elements. Repaint risk from security calls is mitigated by confirmed bar gating or user opt-in.
Parameter Guide
Plateau Length (reserved for future, currently unused): Sets a length for potential plateau detection in extensions; default 3, minimum 1. Higher values would increase stability but are not active yet—leave at default to avoid tuning.
Line Width: Controls thickness of breakout, VWAP, and extension lines; default 2, range 1 to 5. Thicker lines improve visibility on busy charts but may obscure price action—use 1 for clean views, 3 or more for emphasis.
+Bars after next HTF event (finalize old, then delete): Extends old lines and labels by this many bars before deletion on new signals; default 20, minimum 0. Shorter extensions keep charts tidy but risk cutting visuals prematurely; longer aids review but builds clutter over time.
Evaluate label only on HTF close (prevents gray traps intrabar): When true, label updates wait for higher timeframe confirmation; default true. Enabling reduces intrabar flips for stabler signals, though it may delay feedback—disable for faster live trading at repaint cost.
Allow Repainting: Permits real-time security data without confirmation offset; default false. False ensures historical accuracy but lags live bars; true speeds updates but can repaint on HTF closes.
Timeframe Type: Chooses HTF method—Auto Timeframe (dynamic steps up), Multiplier (chart multiple), or Manual (fixed string); default Auto Timeframe. Auto adapts to chart scale for convenience; Multiplier suits custom scaling like 5 times current; Manual for precise like 1D on any chart.
Multiplier for Alternate Resolution: Scales chart timeframe when Multiplier type selected; default 5, minimum 1. Values near 1 mimic current resolution for subtle shifts; higher like 10 jumps to broader context, increasing signal rarity.
Manual Resolution: Direct timeframe string like 60 for 1H when Manual type; default 60. Match to trading horizon—shorter for swing, longer for positional—to balance frequency and reliability.
Show Extension 1: Toggles dotted line and delta percent label between breakout level and current close; default true. Disable to simplify for basic use, enable for precise momentum tracking.
Dotted Line Width: Thickness for Extension 1 line; default 2, range 1 to 5. Align with main Line Width for consistency.
Text Size: Size for delta percent label; options tiny, small, normal, large; default normal. Smaller reduces overlap on dense charts; larger aids glance reads.
Decimals for Δ%: Precision in percent change display; default 2, range 0 to 6. Fewer decimals speed reading; more suit low-volatility assets.
Positive Δ Color: Hue for upward percent changes; default lime. Choose contrasting for visibility.
Negative Δ Color: Hue for downward percent changes; default red. Pair with positive for quick polarity scan.
Dotted Line Color: Color for Extension 1 line; default gray. Neutral tones blend well; brighter for emphasis.
Background Transparency (0..100): Opacity for delta label background; default 90. Higher values fade for subtlety; lower solidifies for readability.
Show Extension 2: Toggles stop-loss label at VWAP end; default true. Turn off for entry focus only.
Stop Method: Percent from VWAP end or fixed ticks; options Percent, Ticks; default Percent. Percent scales with price levels; Ticks suits tick-based instruments.
Stop %: Distance as fraction of VWAP for Percent method; default 1.0, step 0.05, minimum 0.0. Tighter like 0.5 reduces risk but increases stops; wider like 2.0 allows breathing room.
Stop Ticks: Tick count offset for Ticks method; default 20, minimum 0. Adjust per asset volatility—fewer for tight control.
Price Decimals: Rounding for stop price text; default 4, range 0 to 10. Match syminfo.precision for clean display.
Text Size: Size for stop label; options tiny, small, normal, large; default normal. Scale to chart zoom.
Text Color: Foreground for stop text; default white. Ensure contrast with background.
Inherit VWAP Color (BG tint): Bases stop label background on VWAP hue; default true. True maintains theme; false allows custom black base.
BG Transparency (0..100): Opacity for stop label background; default 0. Zero for no tint; up to 100 for full fade.
Reading & Interpretation
Breakout lines appear green for bullish crosses or red for bearish, extending live until a new event finalizes them briefly then deletes. Labels start blank, updating to Bull Cont. or Bear Cont. in matching colors if holding the level, or gray Bull Trap/Bear Trap on reversal. VWAP dashes yellow for bulls, orange for bears, sloping with accumulated volume weight—deviations trigger faint red background warnings. Extension 1's dotted vertical shows at the last bar, with midpoint label green/red for positive/negative percent from breakout to close. Extension 2 places a left-aligned label at VWAP end with stop price and method note, tinted to VWAP for context.
Practical Workflows & Combinations
For trend following, enter long on green Bull Cont. labels above VWAP with higher highs confirmation, filtering via rising structure; short on red Bear Cont. below. Pair with volume surges or RSI above 50 for bulls to avoid traps. For exits, trail stops using the Extension 2 level, tightening on warnings or gray labels—aggressive on continuations, conservative post-trap. In multi-timeframe setups, use default Auto on 15m charts for 1H signals, scaling multiplier to 4 for daily context on hourly; test on forex/stocks where volume is reliable, avoiding low-liquidity assets.
Behavior, Constraints & Performance
Signals confirm on bar close with HTF gating when strict mode active, but live bars may update if repainting enabled—opt false for backtest fidelity, true for intraday speed. Security calls risk minor repaints on HTF closes, mitigated by confirmation offsets. Resources cap at 1000 bars back, 50 lines/labels total, with event prunes to stay under budgets—no loops, minimal arrays. Limits include VWAP lag in low-volume periods and dependency on accurate HTF data; gaps or holidays may skew anchors.
Sensible Defaults & Quick Tuning
Defaults suit 5m-1H charts on liquid assets: Auto HTF, no repaint, 1% stops. For choppy markets with excess signals, enable strict eval and bump multiplier to 10 for rarer triggers. If sluggish in trends, shorten extend bars to 10 and allow repainting for quicker visuals. On high-vol like crypto, widen stop % to 2.0 and use Ticks method; for stables like indices, tighten to 0.5% and keep Percent.
What this indicator is—and isn’t
This is a signal visualization layer for breakout confirmation and basic risk marking, best as a filter in discretionary setups. It isn’t a standalone system or predictive oracle—combine with price structure, news awareness, and sizing rules for real edges.
Disclaimer
The content provided, including all code and materials, is strictly for educational and informational purposes only. It is not intended as, and should not be interpreted as, financial advice, a recommendation to buy or sell any financial instrument, or an offer of any financial product or service. All strategies, tools, and examples discussed are provided for illustrative purposes to demonstrate coding techniques and the functionality of Pine Script within a trading context.
Any results from strategies or tools provided are hypothetical, and past performance is not indicative of future results. Trading and investing involve high risk, including the potential loss of principal, and may not be suitable for all individuals. Before making any trading decisions, please consult with a qualified financial professional to understand the risks involved.
By using this script, you acknowledge and agree that any trading decisions are made solely at your discretion and risk.
Do not use this indicator on Heikin-Ashi, Renko, Kagi, Point-and-Figure, or Range charts, as these chart types can produce unrealistic results for signal markers and alerts.
Best regards and happy trading
Chervolino

Bull Market Support Band Alert (20W SMA & 21W EMA) - Multi-Alert═══════════════════════════════════════════════════════════════════
🎯 WHAT THIS INDICATOR DOES:
═══════════════════════════════════════════════════════════════════
This indicator monitors the Bull Market Support Band (BMSB) - a popular trend-following system that uses the 20-week Simple Moving Average (SMA) and 21-week Exponential Moving Average (EMA) to identify major market trends. It alerts you when price crosses either moving average on any stock in your watchlist.
═══════════════════════════════════════════════════════════════════
📈 THE BULL MARKET SUPPORT BAND STRATEGY:
═══════════════════════════════════════════════════════════════════
- ABOVE both MAs = Bullish trend (consider holding/buying)
- BELOW both MAs = Bearish trend (consider caution/selling)
- CROSSING ABOVE = Potential trend change to bullish
- CROSSING BELOW = Potential trend change to bearish
Originally popularized by cryptocurrency analysts, the BMSB has proven effective across all markets for identifying major trend changes.
═══════════════════════════════════════════════════════════════════
⚡ KEY FEATURES:
═══════════════════════════════════════════════════════════════════
✅ Single alert monitors your ENTIRE watchlist
✅ Works on ANY timeframe (daily, 4H, 1H) while maintaining weekly MA accuracy
✅ Visual signals when crosses occur (green/red arrows)
✅ Real-time status table showing current values
✅ Background coloring for quick trend identification
✅ Customizable alert settings for crosses above/below
═══════════════════════════════════════════════════════════════════
🔔 HOW TO SET UP ALERTS:
═══════════════════════════════════════════════════════════════════
1. Add this indicator to your chart
2. Click Alert (alarm icon)
3. Select "BMSB Watchlist Alert" → "BMSB Cross Alert"
4. Choose your alert frequency:
• "Once Per Bar" = Immediate alerts (for active traders)
• "Once Per Bar Close" = Confirmed signals (fewer false alarms)
5. CHECK "Apply to all symbols in watchlist" ← IMPORTANT!
6. Select your watchlist and create
═══════════════════════════════════════════════════════════════════
⚙️ RECOMMENDED SETTINGS:
═══════════════════════════════════════════════════════════════════
📍 FOR SWING TRADERS:
- Chart: Daily timeframe
- Alert Trigger: Once Per Bar Close
- Both crosses enabled
📍 FOR ACTIVE TRADERS:
- Chart: 4H or Daily timeframe
- Alert Trigger: Once Per Bar
- Both crosses enabled
📍 FOR LONG-TERM INVESTORS:
- Chart: Weekly timeframe
- Alert Trigger: Once Per Bar Close
- Focus on crosses above
═══════════════════════════════════════════════════════════════════
📊 VISUAL ELEMENTS:
═══════════════════════════════════════════════════════════════════
- BLUE LINE = 20-week Simple Moving Average
- RED LINE = 21-week Exponential Moving Average
- GREEN ARROWS = Price crossed above BMSB
- RED ARROWS = Price crossed below BMSB
- GREEN BACKGROUND = Price above both MAs (bullish)
- RED BACKGROUND = Price below both MAs (bearish)
- STATUS TABLE = Current price position and MA values
═══════════════════════════════════════════════════════════════════
💡 PRO TIPS:
═══════════════════════════════════════════════════════════════════
1. The indicator calculates WEEKLY MAs regardless of your chart timeframe
2. Best used with liquid stocks/cryptos with good volume
3. Consider waiting for daily/weekly close for confirmation
4. Crosses are more significant after extended periods above/below
5. Works great with additional confirmation (volume, RSI, etc.)
═══════════════════════════════════════════════════════════════════
⚠️ IMPORTANT NOTES:
═══════════════════════════════════════════════════════════════════
- FREE accounts limited to 1 active alert
- Alerts check based on YOUR selected timeframe, not the weekly MA calculation
- False signals possible during ranging/choppy markets
- Not financial advice - use as one tool among many
═══════════════════════════════════════════════════════════════════
👨💻 AUTHOR'S NOTE:
═══════════════════════════════════════════════════════════════════
Built for traders who want to monitor multiple stocks efficiently without creating dozens of individual alerts. Perfect for identifying major trend changes across your entire portfolio with a single alert.
Tags: #BMSB #BullMarketSupportBand #20WeekSMA #21WeekEMA #TrendFollowing #MovingAverage #WatchlistAlert #MultiTimeframe #SwingTrading #TrendTrading

RSI + MACD Long-Only StrategyRSI + MACD Long-Only Strategy
Overview: Momentum-based, long-only strategy combining RSI and MACD. Entries favor upside momentum; exits trigger on momentum fades or risk targets. Signals are state-gated so you get one exit per entry (no multiple exits without a prior entry).
Entry conditions:
RSI crosses above the midline (default 50) while MACD is bullish (MACD > Signal, optionally MACD > 0), OR
MACD crosses above its Signal while RSI is at/above the midline.
Optional filters:
EMA trend filter: only enter if price > EMA(n).
Oversold context: only enter within N bars after RSI dipped below the oversold threshold.
Exit conditions:
RSI crosses below the midline, OR
MACD crosses below its Signal with MACD histogram ≤ 0.
Optional risk exit: Take Profit / Stop Loss based on percentage from average entry price.
Risk management:
Inputs: Use TP/SL (on/off), TP% (default 3.0), SL% (default 1.5).
Implements protective strategy.exit (limit/stop) while in position.
Signal-based exit uses strategy.close to flatten.
Position management:
Long-only, no pyramiding (single position at a time).
Internal state ensures entries occur only when flat and exits only when in a position.
Inputs you can tune:
RSI: length, overbought, oversold, midline.
MACD: fast length, slow length, signal length; toggle “Require MACD > 0”.
Signals: oversold lookback window; EMA trend on/off and EMA length.
Risk: TP% and SL%.
Visuals: show entry/exit markers, bar coloring; optional debug background on raw triggers.
Visuals and alerts:
Plots EMA (optional), draws entry/exit markers, optional bar coloring, and a faint background on raw long triggers to aid tuning.
Alert conditions provided for entries and exits.
Notes:
Designed for bar-close evaluation; performance varies by symbol/timeframe—tune inputs accordingly.
Long-only; intended for trend-following momentum with basic risk control.
Not financial advice.

ANDROMEDA - TrendSyncANDROMEDA - TrendSync
Pedro Canto - Portfolio Manager | CGA/CGE
OVERVIEW
Trend Sync is a multi-layered trend-following indicator designed to help traders identify high-probability trend continuation setups while avoiding low-quality entries caused by overbought or oversold market conditions.
This indicator combines the power of Moving Averages (MA), MACD , and a visual RSI-based filter to validate both trend direction and timing for entries. It's goal is simple: filter out noise and highlight only the most technically relevant buy and sell signals based on objective momentum and trend criteria.
---
WALKTHROUGH
This indicator is built for traders seeking to operate in the direction of established trends. It's core principle is to identify and validate current trend conditions, and then signal entry opportunities during pullbacks to key moving averages.
Trend identification is achieved through the alignment of two moving averages. When these MAs are crossed and angled in the same direction, they confirm that a trend is in progress. To double-confirm trend direction, the MACD histogram is used—only. When both the MAs and MACD are aligned in the same direction, then the trend is considered valid.
Once all trend criteria are met, a dynamic coloring system is activated to visually reinforce the trend across the candles and moving averages.
To avoid poor entries during market exhaustion, an RSI-based filter is used. This short-term RSI highlights overbought or oversold zones, helping traders filter trades in extreme price conditions.
Only when the trend is validated and price pulls back to one of the MAs will a buy/sell signal be triggered, aligning momentum, price action and timing into a single actionable setup.
This combination ensures that each component plays a specific role:
i) Moving Averages define the trend
ii) MACD validates it
iii) RSI filters noise
iv) Intrabar price action triggers entries
This synchronism helps improve decision-making and entry timing, especially for swing and intraday traders.
---
USE CASES
- Identifying trend continuation setups
- Filtering false signals during consolidation phases
- Avoiding trades in overbought or oversold zones
- Enhancing entry timing for both swing and intraday strategies
- Providing visual confirmation of trend strength and momentum alignment
---
KEY FEATURES
1. Dual Moving Average Setup
The indicator allows full customization of two moving averages (MA1 and MA2), supporting both EMA and SMA types. The slope of the longer MA (MA2) acts as an essential trend filter, ensuring signals are only generated when the market shows clear directional bias.
2. MACD Histogram Trend Confirmation
A classic MACD Histogram calculation is used to validate the momentum of the prevailing trend.
- Bullish Trend: Histogram > 0
- Bearish Trend: Histogram < 0
This step filters out counter-trend signals and ensures trades are aligned with momentum.
3. Intrabar Price Trigger
Unlike standard crossover systems, this indicator waits for intrabar price action to trigger entries:
- Buy Signal: Price crosses below one of the MAs during an uptrend (dip-buy logic)
- Sell Signal: Price crosses above one of the MAs during a downtrend (rally-sell logic)
This intrabar trigger improves entry timing and helps capture retracement-based opportunities.
4. RSI Visual Filter
A short-term RSI is plotted and color-coded to visually highlight overbought and oversold conditions, acting as a discretionary filter for users to avoid low-probability trades during exhaustion points.
5. Dynamic Coloring System
Bar Colors:
- Blue: Bullish trend
- Red: Bearish trend
- Orange: RSI Overbought/Oversold zones
MA Colors:
- Blue for bullish conditions
- Red for bearish conditions
- Gray for neutral/no-trend phases
6. Signal Markers and Alerts
Clear visual buy and sell markers are plotted directly on the chart.
Additionally, the indicator includes real-time alerts for both Buy and Sell signals, helping traders stay informed even when away from the screen.
---
INPUTS AND CUSTOMIZATION OPTIONS
- Moving Average Types: EMA or SMA for both MA1 and MA2.
- MACD Settings: Customizable fast, slow, and signal periods.
- RSI Settings: Source, length, and overbought/oversold levels fully adjustable.
- Color Customization: Adjust RSI zone colors to suit your chart theme.
---
DISCLAIMER
This indicator is a technical analysis tool designed for educational and informational purposes only. It should not be used as a standalone trading system. Always combine it with sound risk management, price action analysis, and, where applicable, fundamental context.
Past performance does not guarantee future results.

LANZ Strategy 2.0 [Backtest]🔷 LANZ Strategy 2.0 — Structural Breakout Logic with Dynamic Swing Protection
LANZ Strategy 2.0 is a precision-focused backtesting system built for intraday traders who rely on structural confirmations before the London session to guide directional bias. This tool uses smart swing detection, risk-defined position sizing, and strict time-based execution to simulate real trading conditions with clarity and control.
🧠 Core Components:
Structural Confirmation (Trend & BoS): Detects trend direction and break of structure (BoS) using a three-swing logic, aligning trade entries with valid structural movement.
Time-Based Execution: Trades are triggered exclusively at 02:00 a.m. New York time, ensuring disciplined and repeatable intraday testing.
Swing-Based SL Models: Traders can select between three stop-loss protection types:
First Swing: Most recent structural level
Second Swing: Prior level
Full Coverage: All recent swing levels + configurable pip buffer
Dynamic TP Calculation: Take-Profit is projected as a risk-based multiple (RR), fully adjustable via input.
Capital-Based Risk Management: Risk is defined as a percentage of a fixed account size (e.g., $100 per trade from $10,000), and lot size is automatically calculated based on SL distance.
Fallback Entry Logic: If structural breakout is present but trend is not confirmed, a secondary entry is triggered.
End-of-Session Management: Any open trades are automatically closed at 11:45 a.m. NY time, with optional manual labeling or review.
📊 Visual Features (Optional in Indicator Version):
(Note: Visuals apply to the indicator version of LANZ 2.0, not this backtest script)
Swing level labels (1st, 2nd) and dynamic SL/TP lines.
Real-time session coloring for clarity: Pre-London, Entry Window, and NY Close.
Outcome labels: +RR, -RR, or net % at close.
Auto-cleanup of previous drawings for a clean chart per session.
⚙️ How It Works:
Detects last trend and BoS using swing logic before 02:00 a.m. NY.
At 02:00 a.m., evaluates directional bias and executes BUY or SELL if confirmed.
Applies selected SL logic (1st, 2nd, or full swing protection).
Sets TP based on the RR multiplier.
Closes the trade either on SL, TP, or at 11:45 a.m. NY manually.
🔔 Alerts:
Time-of-day alert at 02:00 a.m. NY to monitor execution.
Can be extended to cover SL/TP triggers or new BoS events.
📝 Notes:
Designed for backtesting precision and discretionary decision-making.
Ideal for Forex pairs, indices, or assets active during the London session.
Fully customizable: session timing, swing logic, SL buffer, and RR.
👤 Credits:
Strategy built by @rau_u_lanz using Pine Script v6, combining structural logic, capital-based risk control, and London-session timing in a backtest-ready framework for traders who demand accuracy and structure.

[blackcat] L2 Multi-Level Price Condition TrackerOVERVIEW
The L2 Multi-Level Price Condition Tracker represents an innovative approach to analyzing financial markets by simultaneously monitoring multiple price levels, thus providing traders with a holistic view of market dynamics. By combining dynamic calculations based on moving averages and price deviations, this tool aims to deliver precise and actionable insights into potential entry and exit points. It leverages sophisticated statistical measures to identify key thresholds that signify shifts in market sentiment, thereby aiding traders in making well-informed decisions. 🎯
Key benefits encompass:
• Comprehensive calculation of midpoints and average prices indicating short-term trend directions.
• Interactive visualization elements enhancing interpretability effortlessly.
• Real-time generation of buy/sell signals driven by precise condition evaluations.
TECHNICAL ANALYSIS COMPONENTS
📉 Midpoint Calculations:
Computes central reference points derived from high-low ranges establishing baseline supports/resistances.
Utilizes Simple Moving Averages (SMAs) along with standardized deviation formulas smoothing out volatility while preserving long-term trends accurately.
Facilitates identification of directional biases reflecting underlying market forces dynamically.
🕵️♂️ Advanced Price Level Detection:
Derives upper/lower bounds adjusting sensitivities adaptively responding to changing conditions flexibly.
Employs proprietary logic distinguishing between bullish/bearish sentiments promptly signaling transitions effectively.
Ensures consistent adherence to predefined statistical protocols maintaining accuracy robustly.
🎥 Dynamic Signal Generation:
Detects crossovers indicating dominance shifts between buyers/sellers promptly triggering timely alerts.
Integrates conditional logic reinforcing signal validity minimizing erroneous activations systematically.
Supports adaptive thresholds tuning sensitivities based on evolving market conditions flexibly accommodating varying scenarios.
INDICATOR FUNCTIONALITY
🔢 Core Algorithms:
Utilizes moving averages alongside standardized deviation formulas generating precise net volume measurements.
Implements Arithmetic Mean Line Algorithm (AMLA) smoothing techniques improving interpretability.
Ensures consistent alignment with established statistical principles preserving fidelity.
🖱️ User Interface Elements:
Dedicated plots displaying real-time midpoint markers facilitating swift decision-making.
Context-sensitive color coding distinguishing positive/negative deviations intuitively highlighting key activations clearly.
Background shading emphasizing proximity to crucial threshold activations enhancing visibility focusing attention on vital signals promptly.
STRATEGY IMPLEMENTATION
✅ Entry Conditions:
Confirm bullish/bearish setups validated through multiple confirmatory signals assessing concurrent market sentiment factors.
Validate entry decisions considering alignment between calculated midpoints and broader trend directions ensuring coherence.
Monitor cumulative breaches signifying potential trend reversals executing partial/total closes contingent upon predetermined loss limits preserving capital efficiently.
🚫 Exit Mechanisms:
Trigger exits upon hitting predefined thresholds derived from historical analyses promptly executing closures.
Execute partial/total closes contingent upon cumulative loss limits preserving capital efficiently managing exposures prudently.
Conduct periodic reviews gauging strategy effectiveness rigorously identifying areas needing refinement implementing corrective actions iteratively enhancing performance metrics steadily.
PARAMETER CONFIGURATIONS
🎯 Optimization Guidelines:
Lookback Period: Governs responsiveness versus stability balancing sensitivity/stability governing moving averages aligning with preferred granularity.
Price Source: Dictates primary data series driving volume calculations selecting relevant inputs accurately tailoring strategies accordingly.
💬 Customization Recommendations:
Commence with baseline defaults; iteratively refine parameters isolating individual impacts evaluating adjustments independently prior to combined modifications minimizing disruptions.
Prioritize minimizing erroneous trigger occurrences first optimizing signal fidelity sustaining balanced risk-reward profiles irrespective of chosen settings upholding disciplined approaches preserving capital efficiently.
ADVANCED RISK MANAGEMENT
🛡️ Proactive Risk Mitigation Techniques:
Enforce strict compliance with pre-defined maximum leverage constraints adhering strictly to guidelines managing exposures prudently.
Mandatorily apply trailing stop-loss orders conforming to script outputs enforcing discipline rigorously preventing adverse consequences.
Allocate positions proportionately relative to available capital reserves conducting periodic reviews gauging effectiveness continuously identifying improvement opportunities steadily.
⚠️ Potential Pitfalls & Solutions:
Address frequent violations arising during heightened volatility phases necessitating manual interventions judiciously preparing contingency plans proactively mitigating risks effectively.
Manage false alerts warranting immediate attention avoiding adverse consequences systematically implementing corrective actions reliably.
Prepare proactive responses amid adverse movements ensuring seamless functionality amidst fluctuating conditions fortifying resilience against anomalies robustly.
PERFORMANCE MONITORING METRICS
🔍 Evaluation Criteria:
Assess win percentages consistently across diverse trading instruments gauging reliability measuring profitability efficiency accurately evaluating downside risks comprehensively uncovering systematic biases potentially skewing outcomes.
Calculate average profit ratios per successful execution benchmarking actual vs expected performances documenting results meticulously tracking progress dynamically addressing identified shortcomings proactively fostering continuous improvements.
📈 Historical Data Analysis Tools:
Maintain detailed logs capturing every triggered event recording realized profits/losses comparing simulated projections accurately identifying discrepancies warranting investigation implementing iterative refinements steadily enhancing performance metrics progressively.
Identify recurrent systematic errors demanding corrective actions implementing iterative refinements steadily addressing identified shortcomings proactively fostering continuous enhancements dynamically improving robustness resiliently.
PROBLEM SOLVING ADVICE
🔧 Frequent Encountered Challenges:
Unpredictable behaviors emerging within thinly traded markets requiring filtration processes enhancing signal integrity excluding low-liquidity assets prone to erratic movements effectively.
Latency issues manifesting during abrupt price fluctuations causing missed opportunities introducing buffer intervals safeguarding major news/event impacts mitigating distortions seamlessly verifying reliable connections ensuring uninterrupted data flows guaranteeing accurate interpretations dependably.
💡 Effective Resolution Pathways:
Limit ongoing optimization attempts preventing model degradation maintaining optimal performance levels consistently recalibrating parameters periodically adapting strategies flexibly responding appropriately amidst varying conditions dynamically improving robustness resiliently.
Verify reliable connections ensuring uninterrupted data flows guaranteeing accurate interpretations dependably bolstering overall efficacy systematically addressing identified shortcomings dynamically fostering continuous advancements.
THANKS
Heartfelt acknowledgment extends to all developers contributing invaluable insights regarding multi-level price condition-based trading methodologies! ✨

OrangeCandle 4EMA 55 + Fib Bands + SignalsThe script is a TradingView indicator that combines three popular technical analysis tools: Exponential Moving Averages (EMAs), Fibonacci bands, and buy/sell signals based on these indicators. Here’s a breakdown of its features:
1. EMA Settings and Calculation:
The script calculates and plots several Exponential Moving Averages (EMAs) on the chart with different lengths:
Short-term EMAs: EMA 9, EMA 13, EMA 21, and EMA 55 (used for tracking short-term price trends).
Long-term EMAs: EMA 100 and EMA 200 (used to analyze longer-term trends).
These EMAs are plotted with different colors to visually distinguish between the short-term and long-term trends.
2. Fibonacci Bands:
The script calculates Fibonacci Bands based on the Average True Range (ATR) and a Simple Moving Average (SMA).
Fibonacci factors (1.618, 2.618, 4.236, 6.854, and 11.090) are used to determine the upper and lower bounds of five Fibonacci bands.
Upper Fibonacci Bands (e.g., fib1u, fib2u) represent resistance levels.
Lower Fibonacci Bands (e.g., fib1l, fib2l) represent support levels.
These bands are plotted with different colors for each level, helping traders identify potential price reversal zones.
3. Buy and Sell Signals:
Long Condition: A buy signal occurs when the price crosses above the EMA 55 (long-term trend indicator) and is above the lower Fibonacci band (support zone).
Short Condition: A sell signal occurs when the price crosses below the EMA 55 and is below the upper Fibonacci band (resistance zone).
These conditions trigger visual signals on the chart (green arrow for long, red arrow for short).
4. Alerts:
The script includes alert conditions to notify the trader when a long or short signal is triggered based on the crossover of price and EMA 55 near the Fibonacci support or resistance levels.
Long Entry Alert: Triggers when the price crosses above the EMA 55 and is near a Fibonacci support level.
Short Entry Alert: Triggers when the price crosses below the EMA 55 and is near a Fibonacci resistance level.
5. Visualization:
EMAs are plotted with distinct colors:
EMA 9 is aqua,
EMA 13 is purple,
EMA 21 is orange,
EMA 55 is blue (with thicker line width for emphasis),
EMA 100 is gray,
EMA 200 is black.
Fibonacci bands are plotted with different colors for each level:
Fib Band 1 (upper and lower) in white,
Fib Band 2 in green (upper) and red (lower),
Fib Band 3 in green (upper) and red (lower),
Fib Band 4 in blue (upper) and orange (lower),
Fib Band 5 in purple (upper) and yellow (lower).
Summary:
This script provides a comprehensive strategy for analyzing the market with multiple EMAs for trend detection, Fibonacci bands for support/resistance, and signals based on price action in relation to these indicators. The combination of these tools can assist traders in making more informed decisions by providing potential entry and exit points on the chart.
