Volume+ (RVOL/Alerts)This indicator colors the volume bars based on any of the three follow criteria:
- Volume Amount
- RVOL (Relative Volume)
- Lookback (Highest Over Period)
You can use one, two or all three of these settings at the same time.
You can also set alerts with this indicator. The script will trigger an alert whenever any of the three specified flags are triggered.
RVOL is calculated as: Volume divided by Moving Average value. You can change the moving average period (and type) in the settings.
Cerca negli script per "trigger"
Zindarra Multi Alerts by RRBZindarra Multi Alerts by RRB by RagingRocketBull 2018
Version 1.0
This indicator lets you configure multiple alert levels for an asset. Zindarra Multi Alerts supports 10 custom alert levels.
You have to manually create an alert in Manage Alerts Panel and configure it to use with this indicator.
Free accounts are limited to only 1 alert slot and this indicator will take it (any existing alerts must be disabled/stopped).
Once the alert is configured, the indicator can be removed from chart to free a slot for another indicator, but you won't see the alert levels.
This is the Zindarra Multi Alerts Simple version. You can't auto disable already triggered alerts in this indicator. All alerts will remain active.
If you want to be able to hide/disable/change color of the triggered alert levels use the Zindarra Multi Alerts Pro version.
Features:
- 10 custom alert levels with labels
- set open/high/low/close source point for level penetration
- show/hide levels/labels
Usage:
1. attach indicator to a chart
2. define alert levels in UI settings
3. in TradingView's Manage Alerts panel on the right:
- for free accounts: disable/stop all existing alerts, you are limited to 1 alert slot only. Otherwise you won't be able to save.
- create a new Alert:
- select 'Multi Alerts' indicator name in the Condition dropdown box, leave Level 1 and Multi Alerts Cross as default options
- select 'Once Per Bar' or 'Once Per Minute' instead of 'Only Once' to trigger the alert multiple times
5. click Save. Your 9 alerts are enabled now.
Change Settings:
1. change levels/settings in UI
2. in Manage Alerts panel:
- open/edit the alert you created
- select new instance of 'Multi Alerts' indicator name in the Condition dropdown box (appears at the bottom)
- check the Condition dropdown again - a single instance should remain selected.
3. click Save. Your alert settings are updated.
Notes on using alerts:
- attaching this indicator to a chart and configuring alert levels will not automatically enable the alerts - you have to manually create/configure a new alert in the Alerts Panel
- removing this indicator from chart will not disable the alerts, you have to manually disable the alert you created in the Alerts Panel
- your alert in the Alerts Panel uses another instance (copy) of indicator/settings. Any changes won't affect the alert. You have to manually update the alert every time you change any settings in the indicator.
- recompiling and attaching your own version of indicator will require creating a new Alert (delete the old one).
- alerts are designed to work in realtime. In replay mode you will see only the alert levels but there will be no system alert messages. It's best to test the indicator in realtime on M1 (1 min) chart
- you will only see 1 system alert per bar/60 sec when multiple alert levels are crossed with a single bar.
- you can only see the alert levels when the indicator is attached to chart, they are not shown by the system alert.
- a standard bidirectional cross is used for all penetration sources
1. uses plot*, cross*, alertcondition
SMMA Analyses - Buy / Sell signals and close position signals This script combines the usage of the SMMA indicator in order to provide signals for opening and closing trades, either buy or sell signals.
It uses two SMMA , a fast and a slow one, both configurable by the users.
The trigger of Buy and Sell Signals are calculated through the SMMA crosses:
Buy Signals : The fast SMMA crosses over the slow SMMA . They are highlighting by a green area and a "B" label.
Sell Signals : The fast SMMA crosses under the slow SMMA . They are highlighting by a red area and a "S" label
The trigger of Close Buy and Close Sell Signals are calculated through the close price crosses with the fast SMMA:
Close Buy Signals : The fast SMMA crosses under the close price and at the same time the trend is bullish , so the fast SMMA is greater than the slow SMMA . They are highlighted by a lighter green area
Close Sell Signals : The fast SMMA crosses over the close price and at the same time the trend is bearish , so the fast SMMA is lower than the slow SMMA . They are highlighted by a lighter red area
Few important points about the indicator and the produced signals :
This is not intended to be a strategy, but an indicator for analyzing the SMMA conditions. It gives you the triggers depending on the real time analysis of the SMMA and prices, but not being a proper strategy, pay attention about "fake signals" and add always a visual analysis to the provided signals
Following this indicator, the trade positions should be opened only when a cross happens. Either in this case, analyse the chart in order to see if the signals are a "weak" ones, due to "waves" around the SMMA . In these cases, you might wait for the next confirmation signals after the waves, when the trend will be better defined
The close trade signals are provided in order to help to understand when you should close the buy or sell trades. Even in this case, always add a visual analysis to the signals, and pay attention to the support/resistance areas. Sometimes, you can have the close signals in correspondence to support/resistance areas: in these cases wait for the definition of the trend and eventually for the next close trade signals if they will be better defined

JNSARJust Nifty SAR strategy has been developed by our Master Ilangovan.
Trading based on JNSAR:
JNSAR is a number based on market’s strength and weakness as well as the balance of demand and supply. Whatever the number may be, a choppy market could whipsaw the number occasionally to shake off your confidence in them. However, staying with one method brings you consistent winnings.
Step:1: As the JNSAR for yesterday was xxxx and the previous trade taken was a sell @ yyyy on “previous” day, the moment Nifty breached xxxx yesterday, you close out your earlier short and take a long position in minimum 2 lots – Stop and reverse (SAR).
Step:2: If after triggering a reversal long trade @ xxxx and markets fall again, you keep a filter of 20 to 30 points to JNSAR and manage them. Knowing key support numbers closer to JNSAR help in filtering out the whipsaws during long trades and Knowing key resistance numbers closer to JNSAR help in filtering out the whipsaws during short trades.
Step:3:Once a new trade is taken in with a minimum of 2 lots, you book on one lot with a profit of 50, 100+ points and keep the 2nd lot till a reverse trade is triggered based on each subsequent day’s JNSAR.
Step:4: After booking out on the 1st lot, if Nifty climbs back(retraces) substantially and start to fall again, take a new trade(rebuying) again. Rebuying the part booked trade is done at 50% to 61.8% of last segment of rise ( Reselling the part booked trade is done at 50% to 61.8% of last segment of fall) OR at critical 21 or 34 HrSmas. This step is optional and suited for the experienced.
Step:5: You may use the filter of 25 to 30 points on JNSAR for 2 days once JNSAR new trade is taken to give the new trade a fighting chance & survive. For eg: For the new long trade taken @ xxxx yesterday, the JNSAR of today @ zzzz may be altered to zzzz-30.
Step:6: Do not count your winnings. Stay focussed on each trade.
Get Rich Slowly & Quietly.
(Mr. Ilangovan)

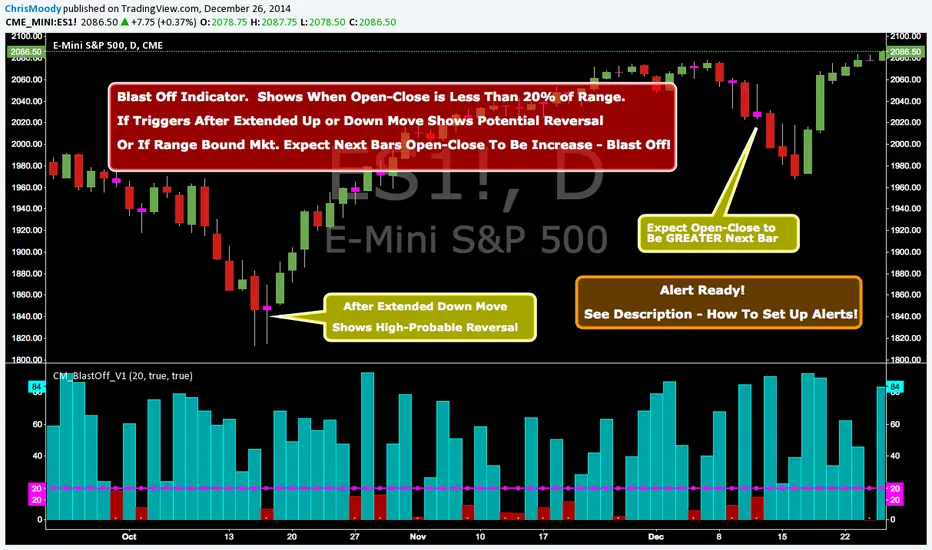
CM_Blast_Off_V1_Alerts ReadyBlast Off Indicator - Alert Ready!!!
Created By Request from @elpuerto936c
Description of Indicator:
***This measures the day's open / close vs then high lows of the day (range)
***When the open /close is less than 20% of the range, then it's likely that the following day will have a big jump.
***The Thought Process is Simply When (Open - Close) is Less Than 20% Of The Range…Shows Indecision and Breakout is Probable.
***Which way? Use whatever indicator you want to figure out if the market is oversold or overbought.
***NOTE: If Indicator Triggers After Extended Up or Down Move…This = High Probability Reversal.
In Inputs Tab:
-Ability to Change The Trigger Value…(This is Percent The (Open-Close) is to the Total RANGE of The Bar).
-Ability to Turn On/Off Highlight Bars via Check Box.
To Set Alert:
-In First Drop Down Box Select Name of Indicator
-In Drop Down to Right Select “Alert Blast Off If Below Trigger”.
-Then Select “Greater Than”.
-Then Select “Value”
-To the Right of Value type in .99
-Select On Bar Close, If not you will get FALSE Alerts.
Lux-Reversal Sniper V2Lux-Reversal Sniper V2 – Strategy Description
Lux-Reversal Sniper V2 is a precision-focused trading indicator designed to capture the earliest phase of trend reversals with strong momentum confirmation.
The script combines LuxAlgo-style pivot structure analysis with a proprietary real-body breakout filter, allowing traders to isolate only high-quality reversal entries while avoiding common false signals.
Core Concept
This indicator targets moments when price decisively breaks a key structural level at the exact moment momentum enters the market.
Rather than reacting late, Lux-Reversal Sniper V2 is built to identify the first actionable move following a structural shift.
Entry Conditions
A signal is generated only when all required conditions align:
1. Structural Breakout
Price breaks above resistance or below support derived from LuxAlgo-style pivot highs and lows.
This confirms that a previously respected market structure has been invalidated.
2. Real Body Break (Momentum Validation)
The candle’s real body must fully exceed the previous candle’s wick.
This condition removes wick-based false breakouts and ensures that only genuine, committed price movement triggers a signal.
3. Trend Synchronization (5-Minute EMA)
The script references the 20-period EMA on the 5-minute timeframe, requiring price to align with the new directional bias before signaling.
Market Environment Filter
To prevent low-energy trades, the indicator monitors market conditions in real time:
ATR (5-minute) ≥ 5.5, or
ADX (5-minute) ≥ 20
When either condition is met, the chart background turns orange, indicating the Trading Zone.
No signals are generated outside this zone, regardless of pattern quality.
Real-Time Signal Execution
Signals are triggered immediately when conditions are met, without waiting for candle close.
This allows traders to capture the initial pips of a reversal, making the indicator particularly effective for scalping and fast intraday trading.
Target Projection
Upon entry, the script automatically plots a 10-pip target line, encouraging traders to move beyond minimal scalps and focus on higher-expectancy moves.
Design Philosophy
Lux-Reversal Sniper V2 is not designed to trade every setup.
It is engineered to act only at moments of maximum probability, when structure breaks, momentum confirms, and market energy is present simultaneously.
When the background turns orange and a breakout occurs with a real-body candle, the signal represents the most critical opportunity of the reversal phase.
If you want:
a short marketing description,
a technical whitepaper version, or
a simplified beginner-friendly explanation,
I can provide those as well.

Futures Ultra CVD (Pure )Futures Ultra CVD (Pure)
Futures Ultra CVD (Pure) is a volume-driven Cumulative Volume Delta (CVD) indicator designed to expose real buying and selling pressure behind price movement. Unlike price-only indicators, this script analyzes how volume is distributed within each bar to determine whether aggressive buyers or sellers are in control, then tracks how that pressure evolves over time.
This version is intentionally pure and ungated: it does not rely on external symbols, market filters, session bias, or macro confirmation. All signals are derived strictly from price, volume, and delta behavior of the active chart, making it suitable for futures, equities, crypto, and FX.
Core Concept: How CVD Is Calculated
For each bar, volume is split into buying pressure and selling pressure using the bar’s price position:
Buying volume increases as price closes closer to the high
Selling volume increases as price closes closer to the low
The difference between buying and selling volume forms Delta:
Positive delta = net aggressive buying
Negative delta = net aggressive selling
This delta is then accumulated into Cumulative Volume Delta (CVD) using one of three user-selectable modes:
Total – running cumulative sum of all delta values
Periodic – rolling sum over a fixed lookback period
EMA – smoothed cumulative delta using an exponential average
This flexibility allows traders to choose between raw order-flow tracking or smoother, trend-like behavior depending on timeframe and instrument.
Visual Structure & Histogram Logic
The CVD is displayed as a column histogram, not a line, to emphasize momentum and pressure shifts.
Enhanced coloring provides additional context:
Brighter green/red bars indicate increasing momentum
Muted colors indicate stalling or weakening pressure
Optional footprint-style highlights appear when buy or sell volume overwhelms the opposite side by a user-defined imbalance factor
This allows traders to visually distinguish:
Strength vs weakness
Continuation vs exhaustion
Absorption and aggressive participation
Built-In Order Flow Signals
The script automatically detects and labels key order-flow events:
Strong Delta
Triggered when delta exceeds a user-defined threshold, highlighting unusually aggressive buying or selling.
Delta Surge
Detects sudden expansion in delta compared to the prior bar, often associated with breakout attempts or liquidation events.
Zero-Line Crosses
Marks transitions between net bullish and bearish participation as CVD crosses above or below zero.
CVD Continuation Logic (Trend Confirmation)
Beyond raw delta, the script evaluates CVD structure to identify continuation conditions:
A bullish continuation requires:
Positive and rising CVD
Strong buy delta
Confirmation from at least one of the following:
CVD above its EMA and SMA
Bullish price expansion
Sustained positive delta pressure
Bearish continuation follows the inverse logic.
These continuation signals are designed to confirm participation strength, not predict reversals.
Conflict Detection (Divergence Warning)
The indicator also flags conflict conditions, where:
Strong buying occurs while CVD remains negative
Strong selling occurs while CVD remains positive
These scenarios often precede failed breakouts, absorption zones, or short-term reversals and can be used as cautionary signals.
Alerts & Practical Use
All major events include built-in alerts:
Strong delta
Delta surge
CVD continuations
Zero-line crosses
Buy/sell imbalances
Conflict signals
Alerts can be set to trigger on bar close or intrabar in real time, depending on trader preference.
How Traders Typically Use This Indicator
Confirm breakouts with delta participation
Validate trends using CVD continuation instead of price alone
Identify absorption or exhaustion via conflicts and imbalances
Combine with price structure, VWAP, or market profile tools
This script is not a trading system by itself. It is a decision-support tool designed to reveal what price alone cannot: who is actually in control of the market.
On-Chart Symbols & What They Mean
This script uses a small number of visual symbols to communicate order-flow events clearly and consistently. All symbols are derived directly from the Cumulative Volume Delta calculations described above.
Δ+ (Green Up Arrow)
Strong Buy Delta
Indicates that buying pressure on the current bar exceeded the Strong Delta Threshold
Represents aggressive market buying dominating selling volume
Often appears during breakouts, trend acceleration, or initiative buying
This symbol does not imply direction by itself; it only confirms strong buyer participation.
Δ− (Red Down Arrow)
Strong Sell Delta
Indicates that selling pressure on the current bar exceeded the Strong Delta Threshold
Represents aggressive market selling dominating buying volume
Often appears during breakdowns, liquidation events, or initiative selling
Like Δ+, this symbol measures participation strength, not trade direction.
↑ (Green Label Up)
CVD Bullish Continuation
Appears when all of the following are present:
CVD is positive and increasing
Strong buy delta is detected
At least one confirmation condition is met:
CVD is above its EMA and SMA
Price shows bullish expansion
Consecutive positive delta bars (sustained buying pressure)
This symbol highlights trend continuation supported by volume, not a reversal signal.
↓ (Red Label Down)
CVD Bearish Continuation
Appears when:
CVD is negative and decreasing
Strong sell delta is detected
At least one confirmation condition is met:
CVD is below its EMA and SMA
Price shows bearish expansion
Consecutive negative delta bars (sustained selling pressure)
This indicates bearish continuation with participation confirmation.
Cyan / Orange Histogram Bars
Footprint-Style Volume Imbalance
Cyan bars indicate buy volume exceeds sell volume by the imbalance factor
Orange bars indicate sell volume exceeds buy volume by the imbalance factor
These bars highlight areas where one side is overwhelming the other, often associated with absorption, initiative moves, or failed auctions.
Bright vs Muted Histogram Colors
CVD Momentum State
Bright colors = CVD increasing in the direction of its current bias
Muted colors = CVD losing momentum or stalling
This allows quick visual identification of strengthening vs weakening participation.
Conflict Alerts (No Symbol by Default)
Delta vs CVD Disagreement
These conditions trigger alerts (but no fixed chart icon):
Strong buying while CVD remains negative
Strong selling while CVD remains positive
Conflicts often signal absorption, trap conditions, or short-term exhaustion.
Important Usage Notes
All symbols are informational, not trade entries.
Signals are calculated from price-based volume distribution, not true bid/ask data.
Results depend on the quality of volume data provided by the exchange and TradingView.

UT Bot + Hull MA Close-Cross Confirm (Strategy)UT Bot + Hull MA Close-Cross Confirm (Strategy)
This strategy combines the classic UT Bot ATR trailing stop with a Hull Moving Average (HMA) close-cross confirmation to reduce false signals and improve trade quality.
The system works in two stages:
UT Bot Signal Detection
A volatility-adjusted ATR trailing stop identifies potential trend shifts using a 1-period EMA crossover. This provides early buy and sell signals based on momentum and volatility.
Hull MA Close-Cross Confirmation
UT Bot signals are only confirmed once price closes across the Hull Moving Average. If a UT signal occurs on the wrong side of the Hull MA, the strategy waits until a valid close-cross occurs before triggering an entry. This confirmation step helps filter chop and late-trend reversals.
Key Features
Non-repainting logic (uses bar-close confirmation)
Futures-friendly design (fixed contracts, point-based TP/SL)
Supports Long, Short, or Both directions
Built-in Take Profit & Stop Loss
Configurable Hull MA type (HMA / EHMA / THMA)
Optional Heikin Ashi signal source
Clean Buy/Sell alerts for automation and webhook execution
Trade Logic Summary
Long Entry:
UT Bot buy signal + confirmed close above Hull MA
Short Entry:
UT Bot sell signal + confirmed close below Hull MA
Exit:
Fixed Take Profit or Stop Loss (user-defined in points)
Alerts & Automation
The strategy includes dedicated Buy Alert and Sell Alert conditions designed for webhook automation (e.g., trade logging, execution engines, or external dashboards). Alerts trigger only on confirmed bar closes, matching backtest behavior.
Intended Use
This strategy is designed for futures markets (e.g., MNQ, ES, GC) and performs best on intraday timeframes. Session filters, risk rules, and trade management can be handled externally if desired.
Disclaimer
This script is provided for educational and research purposes only and is not financial advice. Always test thoroughly and use proper risk management.

Iridescent Liquidity Prism [JOAT]Iridescent Liquidity Prism | Peer Momentum HUD
A multi-layered order-flow indicator that combines microstructure analysis, smart-money footprint detection, and intermarket momentum signals. The script uses dynamic color-shifting themes to visualize liquidity patterns, structure, and peer momentum data directly on the chart.
There is so much to choose from inside the settings, if you think it's a mess on the chart it's because you have to personally customize it based on your needs...
Core Functionality
The indicator calculates and displays several analytical layers simultaneously:
Order-Flow Imbalance (OFI): Calculates buy vs. sell volume pressure using volume-weighted price distribution within each bar. Uses an EMA filter (default: 55 periods) to smooth the signal. Values are normalized using standard deviation to identify significant imbalances.
Smart Money Footprints: Detects accumulation and distribution zones by comparing volume rate of change (ROC) against price ROC. When volume ROC exceeds a threshold (default: 65%) and price ROC is positive, accumulation is detected. When volume ROC is high but price ROC is negative, distribution is detected.
Fractal Structure Mapping: Identifies pivot highs and lows using a fractal detection algorithm (default: 5-bar period). Maintains a rolling window of recent structure points (default: 4 levels) and draws connecting lines to show trend structure.
Fair Value Gap (FVG) Detection: Automatically detects price gaps where three consecutive candles create an imbalance. Bullish FVGs occur when the current low exceeds the high two bars ago. Bearish FVGs occur when the current high is below the low two bars ago. Gaps persist for a configurable duration (default: 320 bars) and fade when price fills the gap.
Liquidity Void Detection: Identifies candles where the high-low range exceeds an ATR threshold (default: 1.7x ATR) while volume is below average (default: 65% of 20-bar average). These conditions suggest areas where liquidity may be thin.
Price/Volume Divergence: Uses linear regression to detect when price trend direction disagrees with volume trend direction. A divergence alert appears when price is trending up while volume is trending down, or vice versa.
Peer Momentum Heatmap (PMH): Calculates composite momentum scores for up to 6 symbols across 4 timeframes. Each score combines RSI (default: 14 periods) and StochRSI (default: 14 periods, 3-bar smooth) to create a momentum composite between -1 and +1. The highest absolute momentum score across all combinations is displayed in the HUD.
Custom settings using Fractal Pivots, Skeleton Structure, Pulse Liquidity Voids, Bottom Colorful HeatMaps, and Iridescent Field.
---
Visual Components
Spectrum Aura Glow: ATR-weighted bands (default: 0.25x ATR) that expand and contract around price action, indicating volatility conditions. The thickness adapts to market volatility.
Chromatic Flow Trail: A blended line combining EMA and WMA of price (default: 8-period EMA blended with WMA at 65% ratio). The trail uses gradient colors that shift based on a phase oscillator, creating an iridescent effect.
Volume Heat Projection: Creates horizontal volume profile bands at price levels (default: 14 levels). Scans recent bars (default: 150 bars) to calculate volume concentration. Each level is colored based on its volume density relative to the maximum volume level.
Structure Skeleton: Dashed lines connecting fractal pivot points. Uses two layers: a primary line (2-3px width) and an optional glow overlay (4-5px width) for enhanced visibility.
Fractal Markers: Diamond shapes placed at pivot high and low points. Color-coded: primary color for highs, secondary color for lows.
Iridescent Color Themes: Five color themes available: Iridescent (default), Pearlescent, Prismatic, ColorShift, and Metallic. Colors shift dynamically using a phase oscillator that cycles through the color spectrum based on bar index and a speed multiplier (default: 0.35).
---
HUD Console Metrics
The right-side HUD displays seven key metrics:
Flow: Shows OFI status: ▲ FLOW BUY when normalized OFI exceeds imbalance threshold (default: 2.2), ▼ FLOW SELL when below -2.2, or ◆ FLOW BAL when balanced.
Struct: Structure trend bias: ▲ STRUCT BULL when microtrend > 2, ▼ STRUCT BEAR when < -2, or ◆ STRUCT RANGE when neutral.
Smart$: Institutional activity: ◈ ACCUM when smart money index = 1, ◈ DISTRIB when = -1, or ○ IDLE when inactive.
Liquid: Liquidity state: ⚡ VOID when a liquidity void is detected, or ● NORMAL otherwise.
Diverg: Divergence status: ⚠ ALERT when price/volume divergence detected, or ✓ CLEAR when aligned.
PMH: Peer Momentum Heatmap status: Shows dominant timeframe and momentum score. Displays 🪩 for bull surge (above 0.55 threshold) or 🧨 for bear surge (below -0.55).
FVG: Fair Value Gap status: Shows active gap count or CLEAR when no gaps exist. Displays GAP LONG when bullish gap detected, GAP SHORT when bearish gap detected.
Pearlscent Color with Volume Heatmap.
Parameters and Settings
Microstructure Engine:
Analysis Depth: 20-250 bars (default: 55) - Controls OFI smoothing period
Liquidity Threshold ATR: 1.0-4.0 (default: 1.7) - Multiplier for void detection
Imbalance Ratio: 1.5-6.0 (default: 2.2) - Standard deviations for OFI significance
Smart Money Layer:
Smart Money Window: 10-150 bars (default: 24) - Period for ROC calculations
Accumulation Threshold: 40-95% (default: 65%) - Volume ROC threshold
Structural Mapping:
Fractal Pivot Period: 3-15 bars (default: 5) - Period for pivot detection
Structure Memory: 2-8 levels (default: 4) - Number of structure points to track
Volume Heat Projection:
Heat Map Lookback: 60-400 bars (default: 150) - Bars to analyze for volume profile
Heat Map Levels: 5-30 levels (default: 14) - Number of price level bands
Heat Map Opacity: 40-100% (default: 92%) - Transparency of heat map boxes
Heat Map Width Limit: 6-80 bars (default: 26) - Maximum width of heat map boxes
Heat Map Visibility Threshold: 0.0-0.5 (default: 0.08) - Minimum density to display
Iridescent Enhancements:
Visual Theme: Iridescent, Pearlescent, Prismatic, ColorShift, or Metallic
Color Shift Speed: 0.05-1.00 (default: 0.35) - Speed of color phase oscillation
Aura Thickness (ATR): 0.05-1.0 (default: 0.25) - Multiplier for aura band width
Chromatic Trail Length: 2-50 bars (default: 8) - Period for trail calculation
Trail Blend Ratio: 0.1-0.95 (default: 0.65) - EMA/WMA blend percentage
FVG Persistence: 50-600 bars (default: 320) - Bars to keep FVG boxes active
Max Active FVG Boxes: 10-200 (default: 40) - Maximum boxes on chart
FVG Base Opacity: 20-95% (default: 80%) - Transparency of FVG boxes
Peer Momentum Heatmap:
Peer Symbols: Comma-separated list of up to 6 symbols (e.g., "BTCUSD,ETHUSD")
Peer Timeframes: Comma-separated list of up to 4 timeframes (default: "60,240,D")
PMH RSI Length: 5-50 periods (default: 14)
PMH StochRSI Length: 5-50 periods (default: 14)
PMH StochRSI Smooth: 1-10 periods (default: 3)
Super Momentum Threshold: 0.2-0.95 (default: 0.55) - Threshold for surge detection
Clarity & Readability:
Liquidity Void Opacity: 5-90% (default: 30%)
Smart Money Footprint Opacity: 5-90% (default: 35%)
HUD Background Opacity: 40-95% (default: 70%)
Iridescent Field:
Field Opacity: 20-100% (default: 86%) - Background color intensity
Field Smooth Length: 10-200 bars (default: 34) - Smoothing for background gradient
---
Alerts
The indicator provides seven alert conditions:
Liquidity Void Detected - Triggers when void conditions are met
Strong Order Flow - Triggers when normalized OFI exceeds imbalance ratio
Smart Money Activity - Triggers when accumulation or distribution detected
Price/Volume Divergence - Triggers when divergence conditions occur
Structure Shift - Triggers when structure polarity changes significantly
PMH Bull Surge - Triggers when PMH exceeds positive threshold (if enabled)
PMH Bear Surge - Triggers when PMH exceeds negative threshold (if enabled)
Bull/Bear Prismatic FVG - Triggers when new FVG is detected (if FVG display enabled)
---
Usage Considerations
Performance may vary on lower timeframes due to the volume heat map calculations scanning multiple bars. Consider reducing heat map lookback or levels if experiencing slowdowns.
The PMH feature requires data requests to other symbols/timeframes, which may impact performance. Limit the number of peer symbols and timeframes for optimal performance.
FVG boxes automatically expire after the persistence period to prevent chart clutter. The maximum box limit (default: 40) prevents excessive memory usage.
Color themes affect all visual elements. Choose a theme that provides good contrast with your chart background.
The indicator is designed for overlay display. All visual elements are positioned relative to price action.
Structure lines are drawn dynamically as new pivots form. On fast-moving markets, structure may update frequently.
Volume calculations assume typical volume data availability. Symbols without volume may show incomplete data for volume-dependent features.
---
Technical Notes
Built on Pine Script v6 with dynamic request capability for PMH functionality.
Uses exponential moving averages (EMA) and weighted moving averages (WMA) for trail calculations to balance responsiveness and smoothness.
Volume profile calculation uses price level buckets. Higher levels provide finer granularity but require more computation.
Iridescent color engine uses a phase oscillator with sine wave calculations for smooth color transitions.
Box management includes automatic cleanup of expired boxes to maintain performance.
All visual elements use color gradients and transparency for smooth blending with price action.
---
Customization Examples
Intraday Scalping Setup:
Analysis Depth: 30 bars
Heat Map Lookback: 100 bars
FVG Persistence: 150 bars
PMH Window: 15 bars
Fast color shift speed: 0.5+
Macro Structure Tracking:
Analysis Depth: 100+ bars
Heat Map Lookback: 300+ bars
FVG Persistence: 500+ bars
Structure Memory: 6-8 levels
Slower color shift speed: 0.2
---
Limitations
Volume heat map calculations may be computationally intensive on lower timeframes with high lookback values.
PMH requires valid symbol names and accessible timeframes. Invalid symbols or timeframes will return no data.
FVG detection requires at least 3 bars of history. Early bars may not show FVG boxes.
Structure lines connect points but do not predict future structure. They reflect historical pivot relationships.
Color themes are aesthetic choices and do not affect calculation logic.
The indicator does not provide trading signals. All visual elements are analytical tools that require interpretation in context of market conditions.
Open Source
This indicator is open source and available for modification and distribution. The code is published with Pine Script v6 compliance. Users are free to customize parameters, modify calculations, and adapt the visual elements to their trading needs.
For questions, suggestions, or anything please talk to me in private messages or comments below!
Would love to help!
- officialjackofalltrades

Unmitigated MTF High Low Pro - Cave Diving Bookmap Heatmap Plot
Unmitigated MTF High Low Pro - Cave Diving Bookmap Heatmap Plot
---
## 📖 Table of Contents
1. (#what-this-indicator-does)
2. (#core-concepts)
3. (#visual-components)
4. (#the-cave-diving-framework)
5. (#how-to-use-it-for-trading)
6. (#settings--customization)
7. (#best-practices)
8. (#common-scenarios)
---
## What This Indicator Does
The **Unmitigated MTF High Low v2.0** tracks unmitigated (untouch) high and low levels across multiple timeframes, helping you identify key support and resistance zones that the market hasn't revisited yet. Think of it as a sophisticated memory system for price action - it remembers where price has been, and more importantly, where it *hasn't been back to*.
### Why "Unmitigated" Matters
In futures trading, especially on instruments like NQ and ES, the market has a tendency to revisit levels where liquidity was left behind. An "unmitigated" level is one that hasn't been touched since it was formed. These levels often act as magnets for price, and understanding their age and proximity gives you a significant edge in:
- **Entry timing** - Waiting for price to approach tested levels
- **Exit planning** - Taking profits before ancient resistance/support
- **Risk management** - Avoiding entries when approaching multiple old levels
- **Liquidity mapping** - Visualizing where orders likely cluster
---
## Core Concepts
### 1. **Sessions & Age**
The indicator uses **New York trading sessions** (6:00 PM to 5:59 PM NY time) as the primary time measurement. This aligns with how futures markets naturally segment their activity.
**Age Categories:**
- 🟢 **New (0-1 sessions)** - Fresh levels, recently formed
- 🟡 **Medium (2-3 sessions)** - Tested by time, gaining significance
- 🔴 **Old (4-6 sessions)** - Highly significant, survived multiple days
- 🟣 **Ancient (7+ sessions)** - Extreme significance, major support/resistance
The longer a level remains unmitigated, the more significant it becomes. Think of it like compound interest - time adds weight to these zones.
### 2. **Multi-Timeframe Tracking**
You can set the indicator to track high/low levels from any timeframe (default is 15 minutes). This means you're watching for unmitigated 15-minute highs and lows while trading on, say, a 1-minute or 5-minute chart.
**Why this matters:**
- Higher timeframe levels have more weight
- You can see multiple timeframe structure simultaneously
- Helps you avoid fighting larger timeframe momentum
### 3. **Mitigation**
A level becomes "mitigated" (deactivated) when price touches it:
- **High levels** are mitigated when price reaches or exceeds them
- **Low levels** are mitigated when price reaches or goes below them
Once mitigated, the level disappears from view. The indicator only shows you the untouch levels that still matter.
---
## Visual Components
### 📊 The Dashboard Table
Located in the corner of your chart (configurable), the table shows:
```
┌─────────┬───────────┬────────┬─────┬───────┐
│ Level │ Price │ Points │ Age │ % │
├─────────┼───────────┼────────┼─────┼───────┤
│ ↑↑↑↑↑ │ 21,450.25 │ +45.50 │ 8 │ +0.21%│ ← 5th High (Ancient)
│ ↑↑↑↑ │ 21,430.00 │ +25.25 │ 5 │ +0.12%│ ← 4th High (Old)
│ ↑↑↑ │ 21,420.50 │ +15.75 │ 3 │ +0.07%│ ← 3rd High (Medium)
│ ↑↑ │ 21,412.00 │ +7.25 │ 1 │ +0.03%│ ← 2nd High (New)
│ ↑ ⚠️ │ 21,408.25 │ +3.50 │ 0 │ +0.02%│ ← 1st High (Proximity Alert!)
├─────────┼───────────┼────────┼─────┼───────┤
│ 15 mins │ 🟢 │ Δ 8.75 │ 2U │ │ ← Status Row
├─────────┼───────────┼────────┼─────┼───────┤
│ ↓ ⚠️ │ 21,399.50 │ -5.25 │ 0 │ -0.02%│ ← 1st Low (Proximity Alert!)
│ ↓↓ │ 21,395.00 │ -9.75 │ 2 │ -0.05%│ ← 2nd Low (Medium)
│ ↓↓↓ │ 21,385.25 │ -19.50 │ 4 │ -0.09%│ ← 3rd Low (Old)
│ ↓↓↓↓ │ 21,370.00 │ -34.75 │ 6 │ -0.16%│ ← 4th Low (Old)
│ ↓↓↓↓↓ │ 21,350.75 │ -54.00 │ 9 │ -0.25%│ ← 5th Low (Ancient)
├─────────┼───────────┼────────┼─────┼───────┤
│ 📊 15↑ / 12↓ │ ← Statistics (optional)
└─────────┴───────────┴────────┴─────┴───────┘
```
**Reading the Table:**
- **Level Column**: Number of arrows indicates position (1-5), color shows age
- **Price**: The actual price level
- **Points**: Distance from current price (+ for highs, - for lows)
- **Age**: Number of full sessions since creation
- **%**: Percentage distance from current price
- **⚠️**: Proximity alert - price is within threshold distance
- **Status Row**: Shows timeframe, direction (🟢 bullish/🔴 bearish), tunnel width (Δ), and Strat pattern
### 📈 Visual Elements on Chart
**1. Level Lines**
- Horizontal lines showing each unmitigated level
- **Color-coded by age**: Bright colors = new, darker = older, deep purple/teal = ancient
- **Line style**: Customizable (solid, dashed, dotted)
- Automatically turn **yellow** when price gets close (proximity alert)
**2. Price Labels**
- Show the exact price and age: "21,450.25 (8d)"
- Fixed at small size for clean readability
- Positioned with configurable offset from current bar
**3. Bands (Optional)**
- Shaded zones between pairs of unmitigated levels
- Default: Between 1st and 2nd levels (the "tunnel")
- Can switch to 1st-3rd, 2nd-3rd, or disable entirely
- **Upper band** (pink/maroon) - Between unmitigated highs
- **Lower band** (blue/teal) - Between unmitigated lows
- These represent the "no man's land" or consolidation zones
---
## The Cave Diving Framework
This indicator is designed around the **Cave Diving Trading Framework** - a psychological and technical approach that maps cave diving safety protocols to futures trading risk management.
### 🤿 The Core Metaphor
**Cave diving has clear danger zones based on depth and overhead environment. Your trading should too.**
#### Shallow Water (New Levels, 0-1 Sessions)
- **Light**: Bright colors (bright red highs, bright green lows)
- **Psychology**: Fresh territory, recently tested
- **Trading**: Be aware but not overly concerned
- **Cave Diving Parallel**: You can see the surface, easy exit
#### Penetration Depth (Medium Levels, 2-3 Sessions)
- **Light**: Medium intensity colors
- **Psychology**: Building significance, market memory forming
- **Trading**: Start respecting these levels for entries/exits
- **Cave Diving Parallel**: Deeper in, need to track your line back
#### Deep Dive Zone (Old Levels, 4-6 Sessions)
- **Light**: Dark colors (deep maroon, dark blue)
- **Psychology**: Highly tested support/resistance
- **Trading**: Major decision points, plan accordingly
- **Cave Diving Parallel**: Significant overhead, careful navigation required
#### Overhead Environment (Ancient Levels, 7+ Sessions)
- **Light**: Very dark, purple/deep teal
- **Psychology**: Extreme caution required, major liquidity zones
- **Trading**: These are your "turn back" signals - don't fight ancient levels
- **Cave Diving Parallel**: Maximum danger, no room for error
### 🎯 The Proximity Alert System
Just like a cave diver's depth gauge that warns at critical thresholds, the proximity alerts (⚠️) tell you when you're entering a danger zone. When price gets within your configured threshold (default 5 points), the indicator:
- Highlights the level in **yellow** on the chart
- Shows **⚠️** in the table
- Signals: "You're entering a high-significance zone - adjust your position accordingly"
This prevents the trading equivalent of going deeper into a cave without checking your air supply.
---
## How to Use It for Trading
### 🎯 Entry Strategies
**1. The "Bounce Setup" (Mean Reversion)**
- Wait for price to approach an old or ancient unmitigated level
- Look for confluence: multiple levels nearby, bands narrowing
- Enter when price shows rejection (reversal candle patterns)
- **Example**: Price drops to a 6-session-old low, shows bullish engulfing → Long entry
**2. The "Break and Retest" (Trend Following)**
- Wait for price to break through an unmitigated level (mitigates it)
- Enter on the retest of the newly broken level
- **Example**: Price breaks above 4-session-old high → Wait for pullback to that level → Long entry
**3. The "Tunnel Trade" (Range Trading)**
- When bands are active, trade the range between 1st-2nd levels
- Short near upper band resistance, long near lower band support
- Exit at opposite side or when bands break
### 🚨 Risk Management Rules
**The Ancient Level Rule**
> Never fight ancient levels (7+ sessions). If you're long and approaching an ancient high, take profits. If you're short and approaching an ancient low, take profits.
These levels have survived a full trading week without being touched - there's likely significant liquidity and institutional interest there.
**The Proximity Exit Rule**
> When you see ⚠️ proximity alerts on multiple levels above/below your position, tighten stops or scale out.
This is your "overhead environment" warning. You're in dangerous territory.
**The New Level Filter**
> Be cautious taking positions based solely on new levels (0-1 sessions). Wait for them to age or combine with other confluence.
Fresh levels haven't been tested by time. They're like unconfirmed support/resistance.
### 📊 Reading Market Structure
**Bullish Structure (🟢 in status row)**
- Unmitigated lows are aging and holding
- Price respecting the lower band
- Old lows below acting as strong support
- **Bias**: Look for long entries at lower levels
**Bearish Structure (🔴 in status row)**
- Unmitigated highs are aging and holding
- Price respecting the upper band
- Old highs above acting as strong resistance
- **Bias**: Look for short entries at higher levels
**The Tunnel Compression**
- When the Δ (delta) in the status row is small, levels are tight
- This often precedes a breakout
- **Trading**: Wait for breakout direction, then trade the break
### 🔄 Strat Integration
The indicator shows Strat patterns in the status row:
- **1** - Inside bar (consolidation)
- **2U** - Broke high only (bullish)
- **2D** - Broke low only (bearish)
- **3** - Broke both (wide range, volatility)
Use these with the unmitigated levels:
- **2U near old high** → Potential resistance, watch for rejection
- **2D near old low** → Potential support, watch for bounce
- **3 pattern** → High volatility, respect wider stops
---
## Settings & Customization
### 📅 Session & Timeframe Settings
**HL Interval** (Default: 15 minutes)
- The timeframe for high/low calculation
- **Lower (1m, 5m)**: More levels, more noise, good for scalping
- **Higher (30m, 1H, 4H)**: Fewer levels, stronger significance, good for swing trading
- **Recommendation for NQ/ES**: 15m or 30m for day trading, 1H for swing trading
**Session Age Threshold** (Default: 2)
- How many sessions before a level is considered "old"
- Lower = more levels classified as old
- Higher = stricter definition of significance
### 📊 Level Display Options
**Show Level Lines**
- Toggle: Display horizontal lines for each level
- **Turn off** if you prefer a cleaner chart and only want the table
**Show Level Labels**
- Toggle: Display price labels on the chart
- **Turn off** for minimal visual clutter
**Label Offset**
- Distance (in bars) from current price bar to place labels
- Increase if labels overlap with price action
**Level Line Width & Style**
- Customize visual appearance
- **Thin solid**: Minimal distraction
- **Thick dashed**: High visibility
### 🎨 Age-Based Color Coding
Customize colors for each age category (high and low separately):
- **New (0-1 sessions)**: Default bright red/green
- **Medium (2-3 sessions)**: Default medium intensity
- **Old (4+ sessions)**: Default dark red/blue
- **Ancient (7+ sessions)**: Default deep purple/teal
**Color Strategy Tips:**
- Keep ancient levels in highly contrasting colors
- Use opacity (transparency) if you want subtler lines
- Match your chart's color scheme for aesthetic coherence
### 🎯 Band Settings
**Band Mode**
- **1st-2nd** (Default): The primary "tunnel" between most recent levels
- **1st-3rd**: Wider band, more room for price action
- **2nd-3rd**: Band between less immediate levels
- **Disabled**: No bands, lines only
**Band Colors & Borders**
- Customize fill color and border separately
- **Tip**: Keep bands very transparent (90-95% transparency) to avoid obscuring price action
### ⚠️ Proximity Alert Settings
**Enable Proximity Alerts**
- Toggle: Turn on/off the warning system
- When enabled, levels within threshold distance show ⚠️ and turn yellow
**Alert Threshold** (Default: 5.0 points)
- Distance in points to trigger the alert
- **For NQ**: 5-10 points is reasonable
- **For ES**: 2-5 points is reasonable
- **For MES/MNQ**: Scale down proportionally
**Alert Highlight Color**
- The color lines/labels turn when proximity is triggered
- Default: Yellow (high visibility)
### 📋 Table Settings
**Show Table**
- Toggle: Display the dashboard table
**Table Location**
- Top Left, Top Right, Bottom Left, Bottom Right
- Choose based on your chart layout and other indicators
**Text Size**
- Tiny, Small, Normal, Large
- **Recommendation**: Normal for 1080p monitors, Small for 4K
**Show % Distance**
- Toggle: Add percentage distance column to table
- Useful for comparing relative distances across different price ranges
**Show Statistics Row**
- Toggle: Show total count of unmitigated highs/lows
- Format: "📊 15↑ / 12↓" (15 unmitigated highs, 12 unmitigated lows)
- Useful for gauging overall market structure
### ⚡ Performance Settings
**Enable Level Cleanup**
- Automatically remove very old levels to maintain performance
- **Keep on** unless you want unlimited history
**Max Lookback Levels** (Default: 10,000)
- Maximum number of levels to track
- 10,000 ≈ 6+ months of 15-minute bars
- **Increase** if you want more history
- **Decrease** if experiencing performance issues
**Max Boxes Per Band** (Default: 245)
- TradingView limit is 500 total boxes
- With 2 bands, 245 each = 490 total (safe maximum)
---
## Best Practices
### 🎯 Position Management
**1. Scaling In Near Old Levels**
```
Price approaching 5-session-old low:
- First position: 30% size at proximity alert (⚠️)
- Second position: 40% size at exact level
- Third position: 30% size if it shows strong rejection
```
**2. Scaling Out Near Ancient Levels**
```
Holding long position, approaching 8-session-old high:
- Exit 50% at proximity alert (⚠️)
- Exit 30% at exact level
- Trail stop on remaining 20%
```
### 🧠 Trading Psychology Integration
Drawing from principles in *The Mountain Is You*, this indicator helps you:
**1. Recognize Self-Sabotage Patterns**
- **The Premature Entry**: Entering before price reaches your planned level
- **Solution**: Set alerts at unmitigated levels, wait for proximity warnings
- **The Profit-Taking Problem**: Exiting too early from fear
- **Solution**: Identify the next unmitigated level and commit to holding until proximity alert
- **The Loss Holding**: Refusing to exit losing trades
- **Solution**: When price breaks through and mitigates your entry level, it's telling you the structure changed
**2. Building Better Habits**
The color-coded age system trains your brain to:
- Respect levels that have proven themselves over time
- Distinguish between noise (new levels) and structure (old levels)
- Make decisions based on objective data, not fear or greed
**3. Emotional Regulation**
The proximity alerts serve as:
- **Circuit breakers** - Forcing you to re-evaluate before dangerous zones
- **Permission to act** - Giving you objective signals to exit without second-guessing
- **Validation** - Confirming when you're in alignment with market structure
### 📝 Pre-Market Routine
**Daily Setup Checklist:**
1. ✅ Identify the 3 nearest unmitigated highs above current price
2. ✅ Identify the 3 nearest unmitigated lows below current price
3. ✅ Note which are ancient (7+) - these are your "no-go" zones
4. ✅ Check the tunnel width (Δ in status row) - tight or wide?
5. ✅ Set alerts at the 1st high and 1st low for proximity warnings
6. ✅ Plan: "If we go up, I exit at ___. If we go down, I enter at ___."
### 🔄 Timeframe Confluence
**Multi-Timeframe Strategy:**
Run the indicator on **three instances**:
- **15-minute** (short-term structure)
- **1-hour** (intermediate structure)
- **4-hour** (major structure)
**Strong Setup**: When all three timeframes show unmitigated levels converging at the same price zone.
**Example:**
- 15m: Old low at 21,400
- 1H: Ancient low at 21,398
- 4H: Ancient low at 21,395
- **Result**: 21,395-21,400 is a monster support zone
### ⚠️ What This Indicator Doesn't Do
**Not a Crystal Ball**
- It doesn't predict where price will go
- It shows you where price *hasn't been* and how long it's been avoided
- The trading decisions are still yours
**Not an Entry Signal Generator**
- It provides context and structure
- You need to combine it with your entry methodology (price action, indicators, order flow, etc.)
**Not Foolproof**
- Ancient levels get broken
- Proximity alerts can trigger early in strong trends
- The market doesn't "owe" you a reversal at any level
---
## Common Scenarios
### Scenario 1: "Level Cluster Ahead"
**Situation**: You're long at 21,400. The table shows:
- 1st High: 21,425 (2 sessions old)
- 2nd High: 21,428 (3 sessions old)
- 3rd High: 21,435 (6 sessions old)
**Interpretation**: There's a resistance cluster just 25-35 points away. The 6-session-old level is particularly significant.
**Action**:
- Set first profit target at 21,420 (before the cluster)
- Set second target at 21,426 (between 1st and 2nd)
- Trail remaining position, but be ready to exit on rejection at 21,435
**Cave Diving Analogy**: You're approaching an overhead section with limited clearance. Lighten your load (reduce position) before entering.
---
### Scenario 2: "Ancient Level Approaches"
**Situation**: The market is grinding higher. You see ⚠️ appear next to a 9-session-old high at 21,500.
**Interpretation**: This level has survived over a week without being touched. Massive potential liquidity zone.
**Action**:
- If long, this is your absolute exit zone. Take profits before or at level.
- If looking to short, wait for clear rejection (price taps and reverses)
- Don't try to buy the breakout until it clearly breaks and retests
**Cave Diving Analogy**: Your dive computer is beeping - you've reached your planned turn-back depth. No matter how interesting it looks ahead, honor your plan.
---
### Scenario 3: "Mitigated Levels Create New Structure"
**Situation**: Price breaks and mitigates the 1st High. The previous 2nd High becomes the new 1st High.
**Interpretation**: The structure just shifted. What was the 2nd level is now most relevant.
**Action**:
- Watch how price reacts to the newly-mitigated level
- If it holds below (acts as resistance), bearish
- If it reclaims and holds above (acts as support), bullish
- The NEW 1st High is your next target/resistance
**Cave Diving Analogy**: You've passed through a restriction - the cave layout ahead is different now. Update your mental map.
---
### Scenario 4: "Tight Tunnel, Upcoming Breakout"
**Situation**: The Δ in the status row shows 3.25 points (very tight). Bands are converging.
**Interpretation**: Price is consolidating between very close unmitigated levels. Breakout likely.
**Action**:
- Don't try to predict direction
- Set alerts above 1st High and below 1st Low
- When break occurs, trade the retest
- Expect volatility - use wider stops
**Cave Diving Analogy**: You're in a narrow passage. Movement will be sudden and directional once it starts.
---
### Scenario 5: "Imbalanced Structure"
**Situation**: The statistics row shows "📊 22↑ / 7↓"
**Interpretation**: There are many more unmitigated highs than lows. This suggests:
- Price has been declining (hitting lows, leaving highs behind)
- Potential bullish reversal zone (lots of overhead supply mitigated)
- Or continued bearish structure (resistance everywhere above)
**Action**:
- Look at the age of those 22 highs
- If mostly new (0-2 sessions): Just a recent downmove, not significant yet
- If many old/ancient: Strong overhead resistance, be cautious on longs
- Compare to price action: Is price respecting the remaining lows?
**Cave Diving Analogy**: You've swam deeper than your starting point - most of your markers are above you now. Are you planning the ascent or going deeper?
---
## Final Thoughts: The Philosophy
This indicator is built on a simple but powerful principle: **The market has memory, and that memory has weight.**
Every unmitigated level represents:
- Liquidity left behind
- Orders waiting to be filled
- Institutional interest potentially parked
- Psychological significance for participants
The longer a level remains unmitigated, the more "charged" it becomes. When price finally revisits it, something significant usually happens - either a strong reversal or a definitive break.
Your job as a trader isn't to predict which outcome will occur. Your job is to:
1. **Recognize** when you're approaching these charged zones
2. **Respect** them by adjusting position size and risk
3. **React** appropriately based on how price behaves at them
4. **Remember** that ancient levels (like ancient wisdom) deserve extra reverence
The Cave Diving Framework embedded in this indicator serves as a constant reminder: Trading, like cave diving, requires rigorous respect for environmental hazards, meticulous planning, and the discipline to turn back when your limits are reached.
**Every proximity alert is the market asking you**: *"Do you really want to go deeper?"*
Sometimes the answer is yes - when your setup, confluence, and risk management all align.
Often, the answer should be no - and that's the trader avoiding the accident that would have happened to the gambler.
---
### 🎯 Quick Reference Card
**Color System:**
- 🟢 Bright colors = New (0-1 sessions) = Shallow water
- 🟡 Medium colors = Medium (2-3 sessions) = Penetration depth
- 🔴 Dark colors = Old (4-6 sessions) = Deep dive zone
- 🟣 Deep dark colors = Ancient (7+ sessions) = Overhead environment
**Symbols:**
- ↑ ↑↑ ↑↑↑ ↑↑↑↑ ↑↑↑↑↑ = High levels (1st through 5th)
- ↓ ↓↓ ↓↓↓ ↓↓↓↓ ↓↓↓↓↓ = Low levels (1st through 5th)
- ⚠️ = Proximity alert (danger zone)
- 🟢 = Bullish structure
- 🔴 = Bearish structure
- Δ = Tunnel width (distance between 1st high and 1st low)
**Critical Rules:**
1. Never fight ancient levels (7+ sessions)
2. Respect proximity alerts (⚠️)
3. Scale out near old/ancient resistance
4. Wait for confluence when entering
5. Let mitigated levels prove their new role
---
**Remember**: The indicator gives you structure. The trading edge comes from your discipline in respecting that structure.
Trade safe, trade smart, and always know your exit before your entry. 🎯
---
*"You don't become your best self by denying your patterns. You become your best self by recognizing them, understanding them, and choosing differently." - Adapted from The Mountain Is You*
In trading: You don't become profitable by ignoring market structure. You become profitable by recognizing it, understanding it, and choosing your entries accordingly.

Amihud Illiquidity Ratio [MarkitTick]💡This indicator implements the Amihud Illiquidity Ratio, a financial metric designed to measure the price impact of trading volume. It assesses the relationship between absolute price returns and the volume required to generate that return, providing traders with insight into the "stress" levels of the market liquidity.
Concept and Originality
Standard volume indicators often look at volume in isolation. This script differentiates itself by contextualizing volume against price movement. It answers the question: "How much did the price move per unit of volume?" Furthermore, unlike static indicators, this implementation utilizes dynamic percentile zones (Linear Interpolation) to adapt to the changing volatility profile of the specific asset you are viewing.
Methodology
The calculation proceeds in three distinct steps:
1. Daily Return: The script calculates the absolute percentage change of the closing price relative to the previous close.
2. Raw Ratio: The absolute return is divided by the volume. I have introduced a standard scaling factor (1,000,000) to the calculation. This resolves the issue of the values being astronomically small (displayed as roughly 0) without altering the fundamental logic of the Amihud ratio (Absolute Return / Volume).
- High Ratio: Indicates that price is moving significantly on low volume (Illiquid/Thin Order Book).
- Low Ratio: Indicates that price requires massive volume to move (Liquid/Deep Order Book).
3. Dynamic Regimes: The script calculates the 75th and 25th percentiles of the ratio over a lookback period. This creates adaptive bands that define "High Stress" and "Liquid" zones relative to recent history.
How to Use
Traders can use this tool to identify market fragility:
- High Stress Zone (Red Background): When the indicator crosses above the 75th percentile, the market is in a High Illiquidity Regime. Price is slipping easily. This is often observed during panic selling or volatile tops where the order book is thin.
- Liquid Zone (Green Background): When the indicator drops below the 25th percentile, the market is in a Liquid Regime. The market is absorbing volume well, which is often characteristic of stable trends or accumulation phases.
- Dashboard: A visual table on the chart displays the current Amihud Ratio and the active Market Regime (High Stress, Normal, or Liquid).
Inputs
- Calculation Period: The lookback length for the average illiquidity (Default: 20).
- Smoothing Period: The length of the additional moving average to smooth out noise (Default: 5).
- Show Quant Dashboard: Toggles the visibility of the on-screen information table.
● How to read this chart
• Spike in Illiquidity (Red Zones)
Price is moving on "thin air." Expect high volatility or potential reversals.
• Low Illiquidity (Green/Stable Zones)
The market is deep and liquid. Trends here are more sustainable and reliable.
• Divergence
Watch for price making new highs while liquidity is drying up—a classic sign of an exhausted trend.
Example:
● Chart Overview
The chart displays the Amihud Illiquidity indicator applied to a Gold (XAUUSD) 4-hour timeframe.
Top Pane: Price action with manual text annotations highlighting market reversals relative to liquidity zones.
Bottom Pane: The specific technical indicator defined in the logic. It features a Blue Line (Raw Illiquidity), a Red Line (Signal/Smoothed), and dynamic background coloring (Red and Green vertical strips).
● Deep Visual Analysis
• High Stress Regime (Red Zones)
Visual Event: In the bottom pane, the background periodically shifts to a translucent red.
Technical Logic: This event is triggered when the amihudAvg (the smoothed illiquidity ratio) exceeds the 75th percentile ( hZone ) of the lookback period.
Forensic Interpretation: The logic calculates the absolute price change relative to volume. A spike into the red zone indicates that price is moving significantly on relatively lower volume (high price impact). Visually, the chart shows these red zones aligning with local price peaks (volatility expansion), leading to the bearish reversal marked by the red box in the top pane.
• Liquid Regime (Green Zones)
Visual Event: The background shifts to a translucent green in the bottom pane.
Technical Logic: This triggers when the amihudAvg falls below the 25th percentile ( lZone ).
Forensic Interpretation: This state represents a period where large volumes are absorbed with minimal price impact (efficiency). On the chart, this green zone corresponds to the consolidation trough (green box, top pane), validating the annotated accumulation phase before the bullish breakout.
• Indicator Lines
Blue Line: This is the illiquidityRaw value. It represents the raw daily return divided by volume.
Red Line: This is the smoothedVal , a Simple Moving Average (SMA) of the raw data, used to filter out noise and define the trend of liquidity stress.
● Anomalies & Critical Data
• The Reversal Pivot
The transition from the "High Stress" (Red) background to the "Liquid" (Green) background serves as a visual proxy for market regime change. The chart shows that as the Red zones dissipate (volatility contraction), the market enters a Green zone (efficient liquidity), which acted as the precursor to the sustained upward trend on the right side of the chart.
● About Yakov Amihud
Yakov Amihud is a leading researcher in market liquidity and asset pricing.
• Brief Background
Professor of Finance, affiliated with New York University (NYU).
Specializes in market microstructure, liquidity, and quantitative finance.
His work has had a major impact on both academic research and practical investment models.
● The Amihud (2002) Paper
In 2002, he published his influential paper: “Illiquidity and Stock Returns: Cross-Section and Time-Series Effects” .
• Key Contributions
Introduced the Amihud Illiquidity Measure, a simple yet powerful proxy for market liquidity.
Demonstrated that less liquid stocks tend to earn higher expected returns as compensation for liquidity risk.
The measure became one of the most widely used liquidity metrics in finance research.
● Why It Matters in Practice
Used in quantitative trading models.
Applied in portfolio construction and risk management.
Helpful as a liquidity filter to avoid assets with excessive price impact.
In short: Yakov Amihud established a practical and robust link between liquidity and returns, making his 2002 work a cornerstone in modern financial economics.
Disclaimer: All provided scripts and indicators are strictly for educational exploration and must not be interpreted as financial advice or a recommendation to execute trades. I expressly disclaim all liability for any financial losses or damages that may result, directly or indirectly, from the reliance on or application of these tools. Market participation carries inherent risk where past performance never guarantees future returns, leaving all investment decisions and due diligence solely at your own discretion.

Market Regime# MARKET REGIME IDENTIFICATION & TRADING SYSTEM
## Complete User Guide
---
## 📋 TABLE OF CONTENTS
1. (#overview)
2. (#regimes)
3. (#indicator-usage)
4. (#entry-signals)
5. (#exit-signals)
6. (#regime-strategies)
7. (#confluence)
8. (#backtesting)
9. (#optimization)
10. (#examples)
---
## OVERVIEW
### What This System Does
This is a **complete market regime identification and trading system** that:
1. **Identifies 6 distinct market regimes** automatically
2. **Adapts trading tactics** to each regime
3. **Provides high-probability entry signals** with confluence scoring
4. **Shows optimal exit points** for each trade
5. **Can be backtested** to validate performance
### Two Components Provided
1. **Indicator** (`market_regime_indicator.pine`)
- Visual regime identification
- Entry/exit signals on chart
- Dynamic support/resistance
- Info tables with live data
- Use for manual trading
2. **Strategy** (`market_regime_strategy.pine`)
- Fully automated backtestable version
- Same logic as indicator
- Position sizing and risk management
- Performance metrics
- Use for backtesting and automation
---
## THE 6 MARKET REGIMES
### 1. 🟢 BULL TRENDING
**Characteristics:**
- Strong uptrend
- Price above SMA50 and SMA200
- ADX > 25 (strong trend)
- Higher highs and higher lows
- DI+ > DI- (bullish momentum)
**What It Means:**
- Market has clear upward direction
- Buyers in control
- Pullbacks are buying opportunities
- Strongest regime for long positions
**How to Trade:**
- ✅ **BUY dips to EMA20 or SMA20**
- ✅ Enter when RSI < 60 on pullback
- ✅ Hold through minor corrections
- ❌ Don't short against the trend
- ❌ Don't sell too early
**Expected Behavior:**
- Pullbacks are shallow (5-10%)
- Bounces are strong
- Support at moving averages holds
- Volume increases on rallies
---
### 2. 🔴 BEAR TRENDING
**Characteristics:**
- Strong downtrend
- Price below SMA50 and SMA200
- ADX > 25 (strong trend)
- Lower highs and lower lows
- DI- > DI+ (bearish momentum)
**What It Means:**
- Market has clear downward direction
- Sellers in control
- Rallies are selling opportunities
- Strongest regime for short positions
**How to Trade:**
- ✅ **SELL rallies to EMA20 or SMA20**
- ✅ Enter when RSI > 40 on bounce
- ✅ Hold through minor bounces
- ❌ Don't buy against the trend
- ❌ Don't cover shorts too early
**Expected Behavior:**
- Rallies are weak (5-10%)
- Selloffs are strong
- Resistance at moving averages holds
- Volume increases on declines
---
### 3. 🔵 BULL RANGING
**Characteristics:**
- Bullish bias but consolidating
- Price near or above SMA50
- ADX < 20 (weak trend)
- Trading in range
- Choppy price action
**What It Means:**
- Uptrend is pausing
- Accumulation phase
- Support and resistance zones clear
- Lower volatility
**How to Trade:**
- ✅ **BUY at support zone**
- ✅ Enter when RSI < 40
- ✅ Take profits at resistance
- ⚠️ Smaller position sizes
- ⚠️ Tighter stops
**Expected Behavior:**
- Range-bound oscillations
- Support bounces repeatedly
- Resistance rejections common
- Eventually breaks higher (usually)
---
### 4. 🟠 BEAR RANGING
**Characteristics:**
- Bearish bias but consolidating
- Price near or below SMA50
- ADX < 20 (weak trend)
- Trading in range
- Choppy price action
**What It Means:**
- Downtrend is pausing
- Distribution phase
- Support and resistance zones clear
- Lower volatility
**How to Trade:**
- ✅ **SELL at resistance zone**
- ✅ Enter when RSI > 60
- ✅ Take profits at support
- ⚠️ Smaller position sizes
- ⚠️ Tighter stops
**Expected Behavior:**
- Range-bound oscillations
- Resistance holds repeatedly
- Support bounces are weak
- Eventually breaks lower (usually)
---
### 5. ⚪ CONSOLIDATION
**Characteristics:**
- No clear direction
- Range compression
- Very low ADX (< 15 often)
- Price inside tight range
- Neutral sentiment
**What It Means:**
- Market is coiling
- Building energy for next move
- Indecision between buyers/sellers
- Calm before the storm
**How to Trade:**
- ✅ **WAIT for breakout direction**
- ✅ Enter on high-volume breakout
- ✅ Direction becomes clear
- ❌ Don't trade inside the range
- ❌ Avoid choppy scalping
**Expected Behavior:**
- Narrow range
- Low volume
- False breakouts possible
- Explosive move when it breaks
---
### 6. 🟣 CHAOS (High Volatility)
**Characteristics:**
- Extreme volatility
- No clear direction
- Erratic price swings
- ATR > 2x average
- Unpredictable
**What It Means:**
- Market panic or euphoria
- News-driven moves
- Emotion dominates logic
- Highest risk environment
**How to Trade:**
- ❌ **STAY OUT!**
- ❌ No positions
- ❌ Wait for stability
- ✅ Protect existing positions
- ✅ Reduce risk
**Expected Behavior:**
- Large intraday swings
- Gaps up/down
- Stop hunts
- Whipsaws
- Eventually calms down
---
## INDICATOR USAGE
### Visual Elements
#### 1. Background Colors
- **Light Green** = Bull Trending (go long)
- **Light Red** = Bear Trending (go short)
- **Light Teal** = Bull Ranging (buy dips)
- **Light Orange** = Bear Ranging (sell rallies)
- **Light Gray** = Consolidation (wait)
- **Purple** = Chaos (stay out!)
#### 2. Regime Labels
- Appear when regime changes
- Show new regime name
- Positioned at highs (bullish) or lows (bearish)
#### 3. Entry Signals
- **Green "LONG"** labels = Buy here
- **Red "SHORT"** labels = Sell here
- Number shows confluence score (X/5 signals)
- Hover for details (stop, target, RSI, etc.)
#### 4. Exit Signals
- **Orange "EXIT LONG"** = Close long position
- **Orange "EXIT SHORT"** = Close short position
- Shows exit reason in tooltip
#### 5. Support/Resistance Lines
- **Green line** = Dynamic support (buy zone)
- **Red line** = Dynamic resistance (sell zone)
- Adapts to regime automatically
#### 6. Moving Averages
- **Blue** = SMA 20 (short-term trend)
- **Orange** = SMA 50 (medium-term trend)
- **Purple** = SMA 200 (long-term trend)
### Information Tables
#### Top Right Table (Main Info)
Shows real-time market conditions:
- **Current Regime** - What regime we're in
- **Bias** - Long, Short, Breakout, or Stay Out
- **ADX** - Trend strength (>25 = strong)
- **Trend** - Strong, Moderate, or Weak
- **Volatility** - High or Normal
- **Vol Ratio** - Current vs average volatility
- **RSI** - Momentum (>70 overbought, <30 oversold)
- **vs SMA50/200** - Price position relative to MAs
- **Support/Resistance** - Exact price levels
- **Long/Short Signals** - Confluence scores (X/5)
#### Bottom Right Table (Regime Guide)
Quick reference for each regime:
- What action to take
- What strategy to use
- Color-coded for quick identification
---
## ENTRY SIGNALS EXPLAINED
### Confluence Scoring System (5 Factors)
Each entry signal is scored 0-5 based on how many factors align:
#### For LONG Entries:
1. ✅ **Regime Alignment** - In Bull Trending or Bull Ranging
2. ✅ **RSI Pullback** - RSI between 35-50 (not overbought)
3. ✅ **Near Support** - Price within 2% of dynamic support
4. ✅ **MACD Turning Up** - Momentum shifting bullish
5. ✅ **Volume Confirmation** - Above average volume
#### For SHORT Entries:
1. ✅ **Regime Alignment** - In Bear Trending or Bear Ranging
2. ✅ **RSI Rejection** - RSI between 50-65 (not oversold)
3. ✅ **Near Resistance** - Price within 2% of dynamic resistance
4. ✅ **MACD Turning Down** - Momentum shifting bearish
5. ✅ **Volume Confirmation** - Above average volume
### Confluence Requirements
**Minimum Confluence** (default = 2):
- 2/5 = Entry signal triggered
- 3/5 = Good signal
- 4/5 = Strong signal
- 5/5 = Excellent signal (rare)
**Higher confluence = Higher probability = Better trades**
### Specific Entry Patterns
#### 1. Bull Trending Entry
```
Requirements:
- Regime = Bull Trending
- Price pulls back to EMA20
- Close above EMA20 (bounce)
- Up candle (close > open)
- RSI < 60
- Confluence ≥ 2
```
#### 2. Bear Trending Entry
```
Requirements:
- Regime = Bear Trending
- Price rallies to EMA20
- Close below EMA20 (rejection)
- Down candle (close < open)
- RSI > 40
- Confluence ≥ 2
```
#### 3. Bull Ranging Entry
```
Requirements:
- Regime = Bull Ranging
- RSI < 40 (oversold)
- Price at or below support
- Up candle (reversal)
- Confluence ≥ 1 (more lenient)
```
#### 4. Bear Ranging Entry
```
Requirements:
- Regime = Bear Ranging
- RSI > 60 (overbought)
- Price at or above resistance
- Down candle (rejection)
- Confluence ≥ 1 (more lenient)
```
#### 5. Consolidation Breakout
```
Requirements:
- Regime = Consolidation
- Price breaks above/below range
- Volume > 1.5x average (explosive)
- Strong directional candle
```
---
## EXIT SIGNALS EXPLAINED
### Three Types of Exits
#### 1. Regime Change Exits (Automatic)
- **Long Exit**: Regime changes to Bear Trending or Chaos
- **Short Exit**: Regime changes to Bull Trending or Chaos
- **Reason**: Market character changed, strategy no longer valid
#### 2. Support/Resistance Break Exits
- **Long Exit**: Price breaks below support by 2%
- **Short Exit**: Price breaks above resistance by 2%
- **Reason**: Key level violated, trend may be reversing
#### 3. Momentum Exits
- **Long Exit**: RSI > 70 (overbought) AND down candle
- **Short Exit**: RSI < 30 (oversold) AND up candle
- **Reason**: Overextension, take profits
### Stop Loss & Take Profit
**Stop Loss** (Automatic in strategy):
- Placed at Entry - (ATR × 2)
- Adapts to volatility
- Protected from whipsaws
- Typically 2-4% for stocks, 5-10% for crypto
**Take Profit** (Automatic in strategy):
- Placed at Entry + (Stop Distance × R:R Ratio)
- Default 2.5:1 reward:risk
- Example: $2 risk = $5 reward target
- Allows winners to run
---
## TRADING EACH REGIME
### BULL TRENDING - Most Profitable Long Environment
**Strategy: Buy Every Dip**
**Entry Rules:**
1. Wait for pullback to EMA20 or SMA20
2. Look for RSI < 60
3. Enter when candle closes above MA
4. Confluence should be 2+
**Stop Loss:**
- Below the recent swing low
- Or 2 × ATR below entry
**Take Profit:**
- At previous high
- Or 2.5:1 R:R minimum
**Position Size:**
- Can use full size (2% risk)
- High win rate regime
**Example Trade:**
```
Price: $100, pulls back to $98 (EMA20)
Entry: $98.50 (close above EMA)
Stop: $96.50 (2 ATR)
Target: $103.50 (2.5:1)
Risk: $2, Reward: $5
```
---
### BEAR TRENDING - Most Profitable Short Environment
**Strategy: Sell Every Rally**
**Entry Rules:**
1. Wait for bounce to EMA20 or SMA20
2. Look for RSI > 40
3. Enter when candle closes below MA
4. Confluence should be 2+
**Stop Loss:**
- Above the recent swing high
- Or 2 × ATR above entry
**Take Profit:**
- At previous low
- Or 2.5:1 R:R minimum
**Position Size:**
- Can use full size (2% risk)
- High win rate regime
**Example Trade:**
```
Price: $100, rallies to $102 (EMA20)
Entry: $101.50 (close below EMA)
Stop: $103.50 (2 ATR)
Target: $96.50 (2.5:1)
Risk: $2, Reward: $5
```
---
### BULL RANGING - Buy Low, Sell High
**Strategy: Range Trading (Long Bias)**
**Entry Rules:**
1. Wait for price at support zone
2. Look for RSI < 40
3. Enter on reversal candle
4. Confluence should be 1-2+
**Stop Loss:**
- Below support zone
- Tighter than trending (1.5 ATR)
**Take Profit:**
- At resistance zone
- Don't hold through resistance
**Position Size:**
- Reduce to 1-1.5% risk
- Lower win rate than trending
**Example Trade:**
```
Range: $95-$105
Entry: $96 (at support, RSI 35)
Stop: $94 (below support)
Target: $104 (at resistance)
Risk: $2, Reward: $8 (4:1)
```
---
### BEAR RANGING - Sell High, Buy Low
**Strategy: Range Trading (Short Bias)**
**Entry Rules:**
1. Wait for price at resistance zone
2. Look for RSI > 60
3. Enter on rejection candle
4. Confluence should be 1-2+
**Stop Loss:**
- Above resistance zone
- Tighter than trending (1.5 ATR)
**Take Profit:**
- At support zone
- Don't hold through support
**Position Size:**
- Reduce to 1-1.5% risk
- Lower win rate than trending
**Example Trade:**
```
Range: $95-$105
Entry: $104 (at resistance, RSI 65)
Stop: $106 (above resistance)
Target: $96 (at support)
Risk: $2, Reward: $8 (4:1)
```
---
### CONSOLIDATION - Wait for Breakout
**Strategy: Breakout Trading**
**Entry Rules:**
1. Identify consolidation range
2. Wait for VOLUME SURGE (1.5x+ avg)
3. Enter on close outside range
4. Direction must be clear
**Stop Loss:**
- Opposite side of range
- Or 2 ATR
**Take Profit:**
- Measure range height, project it
- Example: $10 range = $10 move expected
**Position Size:**
- Reduce to 1% risk
- 50% false breakout rate
**Example Trade:**
```
Consolidation: $98-$102 (4-point range)
Breakout: $102.50 (high volume)
Entry: $103
Stop: $100 (back in range)
Target: $107 (4-point range projected)
Risk: $3, Reward: $4
```
---
### CHAOS - STAY OUT!
**Strategy: Preservation**
**What to Do:**
- ❌ NO new positions
- ✅ Close existing positions if near entry
- ✅ Tighten stops on profitable trades
- ✅ Reduce position sizes dramatically
- ✅ Wait for regime to stabilize
**Why It's Dangerous:**
- Stop hunts are common
- Whipsaws everywhere
- News-driven volatility
- No technical reliability
- Even "perfect" setups fail
**When Does It End:**
- Volatility ratio drops < 1.5
- ADX starts rising (direction appears)
- Price respects support/resistance again
- Usually 1-5 days
---
## CONFLUENCE SYSTEM
### How It Works
The system scores each potential entry on 5 factors. More factors aligning = higher probability.
### Confluence Requirements by Regime
**Trending Regimes** (strictest):
- Minimum 2/5 required
- 3/5 = Good
- 4-5/5 = Excellent
**Ranging Regimes** (moderate):
- Minimum 1-2/5 required
- 2/5 = Good
- 3+/5 = Excellent
**Consolidation** (breakout only):
- Volume is most critical
- Direction confirmation
- Less confluence needed
### Adjusting Minimum Confluence
**If too few signals:**
- Lower from 2 to 1
- More trades, lower quality
**If too many false signals:**
- Raise from 2 to 3
- Fewer trades, higher quality
**Recommendation:**
- Start at 2
- Adjust based on win rate
- Aim for 55-65% win rate
---
## STRATEGY BACKTESTING
### Loading the Strategy
1. Copy `market_regime_strategy.pine`
2. Open Pine Editor in TradingView
3. Paste and "Add to Chart"
4. Strategy Tester tab opens at bottom
### Initial Settings
```
Risk Per Trade: 2%
ATR Stop Multiplier: 2.0
Reward:Risk Ratio: 2.5
Trade Longs: ✓
Trade Shorts: ✓
Trade Trending Only: ✗ (test both)
Avoid Chaos: ✓
Minimum Confluence: 2
```
### What to Look For
**Good Results:**
- Win Rate: 50-60%
- Profit Factor: 1.8-2.5
- Net Profit: Positive
- Max Drawdown: <20%
- Consistent equity curve
**Warning Signs:**
- Win Rate: <45% (too many losses)
- Profit Factor: <1.5 (barely profitable)
- Max Drawdown: >30% (too risky)
- Erratic equity curve (unstable)
### Testing Different Regimes
**Test 1: Trending Only**
```
Trade Trending Only: ✓
Result: Higher win rate, fewer trades
```
**Test 2: All Regimes**
```
Trade Trending Only: ✗
Result: More trades, potentially lower win rate
```
**Test 3: Long Only**
```
Trade Longs: ✓
Trade Shorts: ✗
Result: Works in bull markets
```
**Test 4: Short Only**
```
Trade Longs: ✗
Trade Shorts: ✓
Result: Works in bear markets
```
---
## SETTINGS OPTIMIZATION
### Key Parameters to Adjust
#### 1. Risk Per Trade (Most Important)
- **0.5%** = Very conservative
- **1.0%** = Conservative (recommended for beginners)
- **2.0%** = Moderate (recommended)
- **3.0%** = Aggressive
- **5.0%** = Very aggressive (not recommended)
**Impact:** Higher risk = higher returns BUT bigger drawdowns
#### 2. Reward:Risk Ratio
- **2:1** = More wins needed, hit target faster
- **2.5:1** = Balanced (recommended)
- **3:1** = Fewer wins needed, hold longer
- **4:1** = Very patient, best in trending
**Impact:** Higher R:R = can have lower win rate
#### 3. Minimum Confluence
- **1** = More signals, lower quality
- **2** = Balanced (recommended)
- **3** = Fewer signals, higher quality
- **4** = Very selective
- **5** = Almost never triggers
**Impact:** Higher = fewer but better trades
#### 4. ADX Thresholds
- **Trending: 20-30** (default 25)
- Lower = detect trends earlier
- Higher = only strong trends
- **Ranging: 15-25** (default 20)
- Lower = identify ranging earlier
- Higher = only weak trends
#### 5. Trend Period (SMA)
- **20-50** = Short-term trends
- **50** = Medium-term (default, recommended)
- **100-200** = Long-term trends
**Impact:** Longer period = slower regime changes, more stable
### Optimization Workflow
**Step 1: Baseline**
- Use all default settings
- Test on 3+ years
- Record: Win Rate, PF, Drawdown
**Step 2: Risk Optimization**
- Test 1%, 1.5%, 2%, 2.5%
- Find best risk-adjusted return
- Balance profit vs drawdown
**Step 3: R:R Optimization**
- Test 2:1, 2.5:1, 3:1
- Check which maximizes profit factor
- Consider holding time
**Step 4: Confluence Optimization**
- Test 1, 2, 3
- Find sweet spot for win rate
- Aim for 55-65% win rate
**Step 5: Regime Filter**
- Test with/without trend filter
- Test with/without chaos filter
- Find what works for your asset
---
## REAL TRADING EXAMPLES
### Example 1: Bull Trending - SPY
**Setup:**
- Regime: BULL TRENDING
- Price pulls back from $450 to $445
- EMA20 at $444
- RSI drops to 45
- Confluence: 4/5
**Entry:**
- Price closes at $445.50 (above EMA20)
- LONG signal appears
- Enter at $445.50
**Risk Management:**
- Stop: $443 (2 ATR = $2.50)
- Target: $451.75 (2.5:1 = $6.25)
- Risk: $2.50 per share
- Position: 80 shares (2% of $10k = $200 risk)
**Outcome:**
- Price rallies to $452 in 3 days
- Target hit
- Profit: $6.50 × 80 = $520
- Return: 2.6 × risk (excellent)
---
### Example 2: Bear Ranging - AAPL
**Setup:**
- Regime: BEAR RANGING
- Range: $165-$175
- Price rallies to $174
- Resistance at $175
- RSI at 68
- Confluence: 3/5
**Entry:**
- Rejection candle at $174
- SHORT signal appears
- Enter at $173.50
**Risk Management:**
- Stop: $176 (above resistance)
- Target: $166 (support)
- Risk: $2.50
- Position: 80 shares
**Outcome:**
- Price drops to $167 in 2 days
- Target hit
- Profit: $6.50 × 80 = $520
- Return: 2.6 × risk
---
### Example 3: Consolidation Breakout - BTC
**Setup:**
- Regime: CONSOLIDATION
- Range: $28,000 - $30,000
- Compressed for 2 weeks
- Volume declining
**Breakout:**
- Price breaks $30,000
- Volume surges 200%
- Close at $30,500
- LONG signal
**Entry:**
- Enter at $30,500
**Risk Management:**
- Stop: $29,500 (back in range)
- Target: $32,000 (range height = $2k)
- Risk: $1,000
- Position: 0.2 BTC ($200 risk on $10k)
**Outcome:**
- Price runs to $33,000
- Target exceeded
- Profit: $2,500 × 0.2 = $500
- Return: 2.5 × risk
---
### Example 4: Avoiding Chaos - Tesla
**Setup:**
- Regime: BULL TRENDING
- LONG position from $240
- Elon tweets something crazy
- Regime changes to CHAOS
**Action:**
- EXIT signal appears
- Close position immediately
- Current price: $242 (small profit)
**Outcome:**
- Next 3 days: wild swings
- High $255, Low $230
- By staying out, avoided:
- Potential stop out
- Whipsaw losses
- Stress
**Result:**
- Small profit preserved
- Capital protected
- Re-enter when regime stabilizes
---
## ALERTS SETUP
### Available Alerts
1. **Bull Trending Regime** - Market goes bullish
2. **Bear Trending Regime** - Market goes bearish
3. **Chaos Regime** - High volatility, stay out
4. **Long Entry Signal** - Buy opportunity
5. **Short Entry Signal** - Sell opportunity
6. **Long Exit Signal** - Close long
7. **Short Exit Signal** - Close short
### How to Set Up
1. Click **⏰ (Alert)** icon in TradingView
2. Select **Condition**: Choose indicator + alert type
3. **Options**: Popup, Email, Webhook, etc.
4. **Message**: Customize notification
5. Click **Create**
### Recommended Alert Strategy
**For Active Traders:**
- Long Entry Signal
- Short Entry Signal
- Long Exit Signal
- Short Exit Signal
**For Position Traders:**
- Bull Trending Regime (enter longs)
- Bear Trending Regime (enter shorts)
- Chaos Regime (exit all)
**For Conservative:**
- Only regime change alerts
- Manually review entries
- More selective
---
## TIPS FOR SUCCESS
### 1. Start Small
- Paper trade first
- Then 0.5% risk
- Build to 1-2% over time
### 2. Follow the Regime
- Don't fight it
- Adapt your style
- Different tactics for each
### 3. Trust the Confluence
- 4-5/5 = Best trades
- 2-3/5 = Good trades
- 1/5 = Skip unless desperate
### 4. Respect Exits
- Don't hope and hold
- Cut losses quickly
- Take profits at targets
### 5. Avoid Chaos
- Seriously, just stay out
- Protect your capital
- Wait for clarity
### 6. Keep a Journal
- Record every trade
- Note regime and confluence
- Review weekly
- Learn patterns
### 7. Backtest Thoroughly
- 3+ years minimum
- Multiple market conditions
- Different assets
- Walk-forward test
### 8. Be Patient
- Best setups are rare
- 1-3 trades per week is normal
- Quality over quantity
- Compound over time
---
## COMMON QUESTIONS
**Q: How many trades per month should I expect?**
A: Depends on timeframe and settings. Daily chart: 5-15 trades/month. 4H chart: 15-30 trades/month.
**Q: What's a good win rate?**
A: 55-65% is excellent. 50-55% is good. Below 50% needs adjustment.
**Q: Should I trade all regimes?**
A: Beginners: Only trending. Intermediate: Trending + ranging. Advanced: All except chaos.
**Q: Can I use this on any timeframe?**
A: Best on Daily and 4H. Works on 1H with more noise. Not recommended <1H.
**Q: What if I'm in a trade and regime changes?**
A: Exit immediately (if using indicator) or let strategy handle it automatically.
**Q: How do I know if I'm over-optimizing?**
A: If results are perfect on one period but fail on another. Use walk-forward testing.
**Q: Should I always take 5/5 confluence trades?**
A: Yes, but they're rare (1-2/month). Don't wait only for these.
**Q: Can I combine this with other indicators?**
A: Yes, but keep it simple. RSI, MACD already included. Maybe add volume profile.
**Q: What assets work best?**
A: Liquid stocks, major crypto, futures. Avoid forex spot (use futures), penny stocks.
**Q: How long to hold positions?**
A: Trending: Days to weeks. Ranging: Hours to days. Breakout: Days. Let the regime guide you.
---
## FINAL THOUGHTS
This system gives you:
- ✅ Clear market context (regime)
- ✅ High-probability entries (confluence)
- ✅ Defined exits (automatic signals)
- ✅ Adaptable tactics (regime-specific)
- ✅ Backtestable results (strategy version)
**Success requires:**
- 📚 Understanding each regime
- 🎯 Following the signals
- 💪 Discipline to wait
- 🧠 Emotional control
- 📊 Proper risk management
**Start your journey:**
1. Load the indicator
2. Watch for 1 week (no trading)
3. Identify regime patterns
4. Paper trade for 1 month
5. Go live with small size
6. Scale up as you gain confidence
**Remember:** The market will always be here. There's no rush. Master one regime at a time, and you'll be profitable in all conditions!
Good luck! 🚀

Trinity Bollinger Bands Pro with BreakoutsTrinity Bollinger Bands Pro Indicator
The **Trinity Bollinger Bands Pro + Triple Bands & Expansion** is a highly customized, advanced volatility and breakout indicator built on the classic Bollinger Bands framework. It expands the standard single-pair bands into **three independent deviation levels** (typically 1σ, 2σ, and 3σ) around a user-selectable moving average basis (default EMA 20). This creates clear "zones" of volatility, with dynamic trend-based coloring, layered fills, fixed-style labels, and a statistical volatility expansion detector shown as a directional background highlight in a separate pane. The result is a visually intuitive tool that helps traders identify consolidation, building momentum, confirmed trends, and rare explosive moves with high-probability filtering.
### Why It's Good and Different from Standard Indicators
This indicator stands out by addressing common limitations of traditional Bollinger Bands and multi-deviation scripts:
- **Layered statistical significance**: Unlike single (2σ) or basic double-band setups, it provides three distinct levels—early momentum (1σ), standard confirmation (2σ), and extreme/rare breakouts (3σ)—making it easier to stage trades progressively rather than relying on one ambiguous cross.
- **Trend-aware visuals**: Bands, basis, and fills change color based on price position relative to a separate trend MA, giving immediate bullish/bearish bias without needing additional indicators.
- **Clean, fixed labels**: Tiny, arrow-pointing labels ("1/2/3 SD Above/Below", "BB Basis") with consistent colors (purple upper, blue lower, yellow basis) provide instant identification
- **Statistical expansion detection**: Uses percentile ranking of band width "bell curve" concept" to identify abnormally high volatility, triggering directional background highlights (green bullish, red bearish) earlier than raw width spikes.
- **Reduced noise and fakeouts**: Tiered breakouts + expansion filter focus alerts on high-probability moves, unlike most BB scripts that flood signals on every touch.
Compared to popular public scripts (e.g., standard Bollinger Bands, Triple BB variants, or separate BBW Percentile tools), this combines everything into one cohesive indicator with superior visual clarity and statistical rigor.
### Key Features
- **Triple customizable bands**: Enable/disable and adjust multipliers for 1σ (early), 2σ (confirmed), 3σ (extreme) deviations.
- **Trend-based dynamic coloring**: Separate editable colors for each band set (bullish/bearish).
- **Layered zone fills**: Colored between bands with transparency, reflecting current trend.
- **Fixed tiny labels**: All left-pointing arrows with purple (upper), blue (lower), yellow (basis) backgrounds for quick reference.
- **Statistical expansion overlay**: with directional background (green/red) during extreme volatility expansions (earlier trigger using 2σ width).
- **Tiered alerts**: Early (Band 1), Confirmed (Band 2), Extreme (Band 3), High-Probability (Extreme + expansion), and general expansion alerts.
- **Fully configurable basis**: Length, type (SMA/EMA/WMA/RMA), and thin fixed lines for minimal clutter.
### How Traders Can Use It
- **Spot squeezes and breakouts**: Watch for tight bands (low width) → expansion background → price closing outside Band 1 (early entry), Band 2 (add/confirm), Band 3 (strong trend conviction).
- **Filter fakeouts**: Only act on crosses accompanied by expansion background color matching trend direction—dramatically reduces whipsaws.
- **Trend riding**: Price "walking" colored bands (e.g., hugging upper purple-label bands in green background = strong bullish momentum).
- **Scalping/intraday**: On lower timeframes (e.g., 10min), use early Band 1 signals with expansion for quick moves.
- **Swing/position trading**: Wait for Band 3 extreme breakout + colored background for higher-probability, larger moves.
- **Risk management**: Place stops near basis or inner band; trail using outer bands during expansions.
Overall, this indicator excels at turning volatility into actionable, staged signals with visual simplicity—ideal for traders seeking an edge in identifying real explosive trends over noise. It's particularly powerful on volatile stocks like AMD/INTC or indices during news/events.

able FRVP Reversal# able FRVP Reversal - Complete User Guide
## 📌 Overview
**able FRVP Reversal** is a professional-grade Volume Profile indicator with an integrated reversal detection system. It combines Fixed Range Volume Profile (FRVP) analysis with a confluence-based reversal scoring system to identify high-probability turning points at key volume levels.
---
## ✨ Key Features
| Feature | Description |
|---------|-------------|
| **Session-Based Volume Profile** | Automatically resets at the beginning of each regular trading session |
| **POC (Point of Control)** | Highest volume price level - strongest support/resistance |
| **VAH (Value Area High)** | Upper boundary of the 70% value area - resistance zone |
| **VAL (Value Area Low)** | Lower boundary of the 70% value area - support zone |
| **Confluence Scoring System** | 5-point scoring system for reversal detection |
| **Smart Cooldown** | Prevents signal spam with customizable cooldown period |
| **Real-time Info Table** | Displays all key metrics in a retro-style dashboard |
---
## 🔧 Installation
1. Open TradingView and go to **Pine Editor**
2. Delete any existing code and paste the indicator code
3. Click **"Add to Chart"**
4. Configure settings as needed
---
## ⚙️ Settings Explained
### 📊 Volume Profile Settings
| Setting | Default | Description |
|---------|---------|-------------|
| **Number of Rows** | 50 | Resolution of the volume profile (more rows = finer detail) |
| **Value Area %** | 70 | Percentage of volume to include in Value Area (industry standard: 70%) |
| **Profile Width** | 40 | Visual width of the histogram on chart |
| **Show Histogram** | ✓ | Display volume histogram bars |
| **Show POC/VAH/VAL** | ✓ | Display the three key levels |
| **Show Labels** | ✓ | Display price labels for each level |
| **Extend Lines** | ✓ | Extend levels to the right of current price |
| **Extend Length** | 100 | How far to extend the lines (in bars) |
### 🔄 Reversal Detection Settings
| Setting | Default | Description |
|---------|---------|-------------|
| **Enable Reversal Detection** | ✓ | Turn reversal signals on/off |
| **Min Confluence Score** | 3 | Minimum score required to trigger signal (1-5) |
| **Cooldown Bars** | 10 | Minimum bars between signals to prevent spam |
#### Understanding Min Confluence Score:
- **Score 1-2**: Very sensitive, many signals (not recommended)
- **Score 3**: Balanced - good for most traders ⭐ Recommended
- **Score 4**: Conservative - fewer but higher quality signals
- **Score 5**: Very strict - only strongest reversals
### 🎨 Color Settings
All colors are fully customizable:
- **POC Line**: Default Gold (#FFD700)
- **VAH Line**: Default Coral Red (#FF6B6B)
- **VAL Line**: Default Teal (#4ECDC4)
- **Bullish Reversal**: Default Green (#00E676)
- **Bearish Reversal**: Default Red (#FF5252)
---
## 📖 How to Read the Indicator
### Volume Profile Histogram
```
█████████████ ← High volume = Strong S/R
████████ ← Medium volume
████ ← Low volume = Weak S/R
██
```
- **Darker/Longer bars** = More trading activity at that price
- **Inside Value Area** = Colored based on session direction (Bull/Bear)
- **Outside Value Area** = Muted gray color
### Key Levels
| Level | Color | Meaning |
|-------|-------|---------|
| **POC** | Yellow | Price with highest volume - Strongest magnet |
| **VAH** | Red | Upper resistance - Look for bearish reversals |
| **VAL** | Teal | Lower support - Look for bullish reversals |
---
## 🔄 Reversal Detection System
### How the Scoring System Works
The indicator uses a **5-point confluence scoring system**. Each condition adds 1 point:
#### 🟢 Bullish Reversal Score (at VAL)
| Condition | Points | Description |
|-----------|--------|-------------|
| Price at VAL Zone | +1 | Price is within VAL ± 0.2 ATR |
| Bullish Candle | +1 | Close > Open (green candle) |
| RSI Oversold | +1 | RSI < 35 |
| Rejection Wick | +1 | Lower wick > 1.5× body size |
| Failed Breakdown | +1 | Touched below VAL but closed above |
#### 🔴 Bearish Reversal Score (at VAH)
| Condition | Points | Description |
|-----------|--------|-------------|
| Price at VAH Zone | +1 | Price is within VAH ± 0.2 ATR |
| Bearish Candle | +1 | Close < Open (red candle) |
| RSI Overbought | +1 | RSI > 65 |
| Rejection Wick | +1 | Upper wick > 1.5× body size |
| Failed Breakout | +1 | Touched above VAH but closed below |
### Signal Quality Ratings
| Score | Rating | Meaning |
|-------|--------|---------|
| 5/5 | ★★★ | Excellent - Highest probability |
| 4/5 | ★★ | Good - High probability |
| 3/5 | ★ | Acceptable - Moderate probability |
| <3 | - | No signal triggered |
---
## 📋 Info Table Explained
```
╔═ able-REV ═╗ 15 ████████ SCR
─────────────────────────────────────
ZONE UPPER VA ▒▒▓▓████ ▲
POC 4272.680 ██████·· ▲
VAH 4322.745 ████···· ·
VAL 4264.977 ██████·· ·
═ SCORE ═════════════════════════════
BULL 0/5 ········ ·
BEAR 1/5 ░······· ·
RSI 49 ▒▒▓▓···· ·
◄SIGNAL► WAIT ········ ·
```
| Row | Description |
|-----|-------------|
| **ZONE** | Current price position relative to Value Area |
| **POC/VAH/VAL** | Price levels with distance indicators |
| **BULL Score** | Current bullish confluence score |
| **BEAR Score** | Current bearish confluence score |
| **RSI** | RSI value with OB/OS status |
| **SIGNAL** | Current signal status (BUY/SELL/WAIT) |
### Zone Types
| Zone | Meaning | Bias |
|------|---------|------|
| ABOVE VAH | Price broke above resistance | Bullish (but watch for rejection) |
| ⚠ AT VAH | Price testing resistance | Watch for bearish reversal |
| UPPER VA | Price in upper value area | Slight bullish bias |
| LOWER VA | Price in lower value area | Slight bearish bias |
| ⚠ AT VAL | Price testing support | Watch for bullish reversal |
| BELOW VAL | Price broke below support | Bearish (but watch for rejection) |
---
## 📈 Trading Strategies
### Strategy 1: VAH Rejection (Bearish Reversal)
**Setup:**
1. Price approaches or touches VAH (red dashed line)
2. BEAR score reaches 3+ (or your minimum setting)
3. REV signal appears above the candle
**Entry:**
- Enter SHORT on signal candle close
- Or wait for confirmation candle
**Stop Loss:**
- Above the signal candle high
- Or above VAH + 0.5 ATR
**Take Profit:**
- First target: POC (yellow line)
- Second target: VAL (teal line)
---
### Strategy 2: VAL Bounce (Bullish Reversal)
**Setup:**
1. Price approaches or touches VAL (teal dashed line)
2. BULL score reaches 3+ (or your minimum setting)
3. REV signal appears below the candle
**Entry:**
- Enter LONG on signal candle close
- Or wait for confirmation candle
**Stop Loss:**
- Below the signal candle low
- Or below VAL - 0.5 ATR
**Take Profit:**
- First target: POC (yellow line)
- Second target: VAH (red line)
---
### Strategy 3: POC Bounce
**Setup:**
1. Price pulls back to POC after trending
2. POC acts as support/resistance
3. Watch for reversal candle patterns
**Entry:**
- Long if bullish candle at POC from below
- Short if bearish candle at POC from above
**Stop Loss:**
- Other side of POC ± buffer
---
## ⚠️ Important Notes
### When Signals Work Best
✅ **High Probability Setups:**
- Score 4-5 with clear rejection wick
- RSI confirms (oversold for long, overbought for short)
- First test of VAH/VAL in the session
- Clear trend before reversal
❌ **Low Probability Setups:**
- Score barely meeting minimum (3/5)
- Multiple tests of same level (level weakening)
- Low volume/choppy market
- News events pending
### Risk Management Rules
1. **Never risk more than 1-2% per trade**
2. **Always use stop loss** - place beyond the level
3. **Wait for candle close** - don't enter on wick touches
4. **Respect the cooldown** - avoid overtrading
5. **Consider the trend** - counter-trend reversals are riskier
---
## 🔔 Alerts
The indicator includes built-in alerts:
| Alert | Trigger |
|-------|---------|
| VAL Bullish Reversal | BULL score meets minimum at VAL |
| VAH Bearish Reversal | BEAR score meets minimum at VAH |
### Setting Up Alerts:
1. Right-click on the chart
2. Select "Add Alert"
3. Choose "able FRVP Reversal" as condition
4. Select desired alert type
5. Configure notification method
---
## 💡 Pro Tips
1. **Combine with trend analysis** - Reversals in trend direction are more reliable
2. **Watch for confluence with other S/R** - If VAH/VAL aligns with round numbers, previous highs/lows, or fib levels, the level is stronger
3. **Volume confirmation** - Higher volume on reversal candle = stronger signal
4. **Time of day matters** - Reversals during active trading hours are more reliable
5. **Adjust sensitivity by market** - Volatile assets may need higher Min Confluence Score
6. **Use multiple timeframes** - Check if reversal level aligns with higher timeframe levels
---
## 🔧 Recommended Settings by Trading Style
| Style | Min Confluence | Cooldown | Best For |
|-------|----------------|----------|----------|
| Scalping | 3 | 5-7 | Quick trades, more signals |
| Day Trading | 3-4 | 10-15 | Balanced approach |
| Swing Trading | 4-5 | 20+ | Fewer, higher quality signals |
---
## ❓ Troubleshooting
| Issue | Solution |
|-------|----------|
| No signals appearing | Lower Min Confluence Score or check if market is ranging |
| Too many signals | Increase Min Confluence Score or Cooldown Bars |
| Levels not showing | Enable Show POC/VAH/VAL in settings |
| Histogram too wide/narrow | Adjust Profile Width setting |
---
## 📞 Support
For questions, suggestions, or bug reports, please contact the developer.
---
**Version:** 1.0
**Last Updated:** 2024
**Platform:** TradingView (Pine Script v6)

On Balance Volume [BrightSideTrading]
# On Balance Volume - Complete User Guide
## Overview
This enhanced OBV indicator provides clean, actionable volume analysis with intelligent signal filtering. It combines On-Balance Volume (OBV) with a smoothed signal line to identify shifts in buying and selling pressure without chart clutter.
**Key Features:**
- Real-time OBV and signal line visualization
- Smart crossover detection with confirmation filtering
- Z-Score momentum analysis
- Customizable signal alerts with V-shaped markers
- Window-normalized option for detrended analysis
---
## What is On-Balance Volume (OBV)?
OBV is a volume-based momentum indicator that accumulates volume on up days and subtracts volume on down days. It answers a fundamental question: **Is volume flowing in (buying) or out (selling)?**
**Formula:**
- If Close > Previous Close: OBV = Previous OBV + Volume
- If Close < Previous Close: OBV = Previous OBV - Volume
- If Close = Previous Close: OBV = Previous OBV (unchanged)
**What it tells you:**
- **Rising OBV** = Accumulation (smart money buying)
- **Falling OBV** = Distribution (smart money selling)
- **OBV above zero line** = Net positive buying pressure
- **OBV below zero line** = Net negative selling pressure
---
## Interface & Settings
### **MAIN VISUALIZATION**
**OBV Line (Green/Red Ribbon)**
- Green when OBV is above the signal line (bullish trend)
- Red when OBV is below the signal line (bearish trend)
- Toggles between window-normalized (detrended) and raw values
**Signal Line (Orange)**
- Smoothed average of OBV
- Crossovers with OBV generate buy/sell signals
- Default: 21-period SMA
**V-Shaped Markers**
- Green upward V = Bullish crossover (buy signal)
- Red downward V = Bearish crossover (sell signal)
- Appears at the OBV value when signal is triggered
**Zero Line (Yellow)**
- Center equilibrium point for volume balance
- Acts as support/resistance for OBV
- Separates buying pressure (above) from selling pressure (below)
---
### **SOURCE GROUP**
**Source**
- **Default:** Close
- **Options:** Open, High, Low, or any custom value
- Controls which price value triggers OBV direction changes
- Most traders use Close for standard OBV calculation
---
### **SIGNAL SMOOTHING GROUP**
**Show Signal?**
- **Default:** ON
- Toggle visibility of the signal line
- Disable if you prefer to see raw OBV only
**Smoothing Type**
- **SMA (Simple Moving Average)** - Default, standard smoothing
- **EMA (Exponential Moving Average)** - Faster response, weights recent bars more heavily
- **Choose SMA** for consistent, traditional OBV signals
- **Choose EMA** for faster trend identification (more whipsaws possible)
**Smoothing Length**
- **Default:** 21 bars
- **Range:** 1-200 bars
- **Lower values** (5-14): Faster signals, more noise
- **Higher values** (30-50): Slower signals, fewer false alarms
- **Recommendation:** Use 21-25 for most timeframes
---
### **SIGNAL FILTERING GROUP**
This is your primary control for signal quality and frequency.
**Show Signal Markers?**
- **Default:** ON
- Toggle the V-shaped buy/sell markers on/off
- Disable if markers distract from your analysis
**Signal Filter Type**
- **None** - Shows every single crossover (noisy, best for skilled traders)
- **Confirmation Bars** - Waits N bars before confirming signal (recommended)
- **Strength-Based** - Only signals during strong momentum (filters weakest moves)
#### **CONFIRMATION BARS MODE** (Recommended)
Best for reducing false signals while staying responsive to real moves.
**Confirmation Bars**
- **Default:** 2 bars
- **Range:** 1-10 bars
- Waits for the signal to hold for N consecutive bars after crossover
- **Setting 1:** Every crossover (same as "None")
- **Setting 2:** Wait 1 bar confirmation (good balance)
- **Setting 3:** Wait 2 bars confirmation (filters 50% of noise)
- **Setting 4+:** Very selective, misses quick reversals
**How it works:**
1. OBV crosses signal line → Confirmation counter starts
2. If OBV stays on correct side for 2 bars → V-marker appears
3. If OBV crosses back → Counter resets, no signal
#### **STRENGTH-BASED MODE**
Only signals when momentum is statistically significant.
**Min Z-Score Strength**
- **Default:** 0.3
- **Range:** 0.0-3.0
- Requires OBV deviation from its mean to reach this threshold
- **Setting 0.1-0.3:** More signals, lower quality
- **Setting 0.5-0.8:** Moderate signals, good quality
- **Setting 1.0+:** Only the strongest momentum shifts
**How it works:**
- Calculates how far OBV is from its 50-bar average (Z-score)
- Only shows signals when this distance is meaningful
- Automatically avoids weak, choppy market conditions
---
### **VISUALS & COLORS GROUP**
**Highlight Crossovers?**
- **Default:** ON
- Master toggle for all signal markers
- Turn OFF to see only the OBV/signal lines
**Apply Ribbon Filling?**
- **Default:** ON
- Colors the space between OBV and signal line
- Green fill = OBV above signal (bullish)
- Red fill = OBV below signal (bearish)
- Provides clear visual trend confirmation
- Turn OFF for minimal chart clutter
---
### **STATS & ZONES GROUP**
**Use Window-Normalized OBV (visual only)?**
- **Default:** ON
- Removes long-term trend from OBV for clearer short-term signals
- Detrends the indicator to highlight recent momentum changes
- **ON:** Better for swing trading and identifying reversals
- **OFF:** Better for trend-following strategies
- Note: Z-Score always uses raw OBV for statistical accuracy
**OBV Normalize Window**
- **Default:** 200 bars
- Lookback period for detrending calculation
- Larger values = more aggressive detrending
- Adjust if you want OBV to oscillate more/less around zero
**Show Z-Score (OBV)?**
- **Default:** ON
- Displays statistical momentum indicator below main chart
- Ranges from -3 to +3 (most data within -2 to +2)
- High Z-Score = Strong buying momentum
- Low Z-Score = Strong selling momentum
**Z-Score Lookback**
- **Default:** 50 bars
- Period for calculating Z-Score mean and standard deviation
- Larger = smoother Z-Score, slower response
- Smaller = noisier Z-Score, faster response
**Show ROC (OBV Momentum)?**
- **Default:** OFF
- Rate of Change indicator for OBV velocity
- Useful for identifying momentum turning points
- Enable if you want to see speed of volume changes
**ROC Lookback**
- **Default:** 14 bars
- Period for ROC calculation
**Show Z-Score StdDev Zones?**
- **Default:** ON
- Shaded regions around zero line showing statistical boundaries
- Inner Zone (±1 Z) = Normal variation
- Outer Zone (±2 Z) = Extreme moves, potential reversals
- Helps identify overbought/oversold volume conditions
**Inner Zone (±Z)**
- **Default:** 1.0
- First boundary for standard deviation zones
- Most normal trading occurs within ±1
**Outer Zone (±Z)**
- **Default:** 2.0
- Second boundary for extreme conditions
- Crossing these zones indicates significant momentum shift
---
## Trading Strategy Examples
### **Strategy 1: Signal Line Crossovers (Beginner)**
**Setup:**
- Signal Filter Type: **Confirmation Bars**
- Confirmation Bars: **2-3**
- Show Signal Markers: **ON**
**Rules:**
1. **BUY signal** (green V): When OBV crosses above signal line and holds for 2-3 bars
- Confirms buying pressure is building
- Look for price to follow within 1-3 bars
2. **SELL signal** (red V): When OBV crosses below signal line and holds for 2-3 bars
- Confirms selling pressure is increasing
- Expect price decline
3. **Exit:** Take profits at next signal or use price support/resistance
**Best For:** Swing trading, intraday reversals, timeframes 5m-1h
---
### **Strategy 2: Zero Line Bounce (Intermediate)**
**Setup:**
- Signal Filter Type: **Strength-Based**
- Min Z-Score Strength: **0.5**
- Show Z-Score StdDev Zones: **ON**
**Rules:**
1. **Watch OBV approach zero line** during established trends
- OBV bouncing repeatedly off zero = trend is healthy
- OBV breaking through zero = trend reversal imminent
2. **Enter on bounce:** Buy when OBV bounces from zero line in uptrend
3. **Exit on break:** Close position when OBV breaks below zero line
4. **Confirm with Z-Score:** Only take trades when Z-Score shows momentum (|Z| > 0.5)
**Best For:** Trend traders, identifying trend strength, medium timeframes 15m-4h
---
### **Strategy 3: Momentum Extremes (Advanced)**
**Setup:**
- Signal Filter Type: **None**
- Show Z-Score StdDev Zones: **ON**
- Outer Zone: **2.0**
**Rules:**
1. **Identify extremes:** When Z-Score breaks outer zone (±2.0)
- Indicator is in extreme territory
- Likely overextended
2. **Fade extremes:** Take opposite position when Z-Score hits extreme
- High Z (>2.0) = OBV overbought, expect pullback
- Low Z (<-2.0) = OBV oversold, expect bounce
3. **Confirm:** Wait for crossover signal to enter
4. **Target:** Outer zone of opposite side or zero line
**Best For:** Range trading, mean reversion, experienced traders only
---
## Reading the Indicator in Different Markets
### **Strong Uptrend**
- OBV consistently above signal line (green)
- OBV well above zero line, rising higher lows
- Z-Score positive, trending upward
- **Action:** Buy dips to signal line, sell at resistance
### **Strong Downtrend**
- OBV consistently below signal line (red)
- OBV well below zero line, making lower highs
- Z-Score negative, trending downward
- **Action:** Sell rallies to signal line, cover at support
### **Consolidation/Choppy Market**
- OBV whipsaws around signal line frequently
- Crossovers occur every few bars
- Z-Score oscillating between -1 and +1
- **Action:** Increase confirmation bars to 3-4, or switch to strength-based filter
### **Accumulation (Bottom Formation)**
- OBV rising while price is flat or falling
- Volume flowing in despite downtrend (bullish divergence)
- Z-Score climbing while price lows hold
- **Action:** Expect breakout up; prepare buy near support
### **Distribution (Top Formation)**
- OBV falling while price is flat or rising
- Volume flowing out despite uptrend (bearish divergence)
- Z-Score falling while price continues higher
- **Action:** Expect breakdown down; prepare short near resistance
---
## Parameter Tuning Guide
### **Aggressive Settings (More Signals)**
- Smoothing Length: 14
- Signal Filter: None or Confirmation Bars: 1
- Min Z-Score: 0.1
- Best for: Day trading, high volatility stocks
- Risk: More false signals
### **Balanced Settings (Recommended)**
- Smoothing Length: 21
- Signal Filter: Confirmation Bars: 2
- Min Z-Score: 0.3
- Best for: Swing trading, most market conditions
- Risk/Reward: Moderate
### **Conservative Settings (Fewer Signals)**
- Smoothing Length: 30-40
- Signal Filter: Confirmation Bars: 3-4 or Strength-Based: 0.7+
- Min Z-Score: 0.8
- Best for: Position trading, high-conviction trades only
- Risk: May miss some moves
---
## Common Questions & Troubleshooting
**Q: Why are there more sell signals than buy signals?**
A: This reflects the actual market action. Markets often decline faster than they rise (fear > greed). Confirm signals with price action and support/resistance.
**Q: The indicator keeps whipsawing, should I hide it?**
A: Increase Confirmation Bars to 3-4 or switch to Strength-Based filter. Market conditions matter—choppy markets require stricter filters.
**Q: What's the difference between normalized and raw OBV?**
A: Normalized (detrended) shows shorter-term momentum by removing long-term trends. Raw OBV shows absolute accumulation/distribution over the full period. Use normalized for swing signals, raw for trend confirmation.
**Q: My signals come too late. How do I get faster entry?**
A: Reduce Smoothing Length (try 14 instead of 21), use EMA instead of SMA, or set Confirmation Bars to 1. Trade-off: More false signals.
**Q: Can I use this for day trading?**
A: Yes, on 1m-5m charts with aggressive settings. Use Confirmation Bars: 1 and focus on Z-Score > 0.5 entries only.
**Q: Should I trade every signal?**
A: No. Filter signals using: price near support/resistance, multiple indicators confirming, and Z-Score showing momentum. Best signals occur at key levels.
---
## Best Practices
1. **Always confirm with price action:** OBV signals work best when price is near support, resistance, or moving average. Don't trade signals in a vacuum.
2. **Use volume context:** Check if volume is increasing or decreasing on the signal. Strong signals have volume confirmation (increasing volume on OBV spikes).
3. **Adjust settings per timeframe:**
- 1m-5m: Smoothing 12, Confirmation 1, Z-Score 0.2
- 15m-1h: Smoothing 20, Confirmation 2, Z-Score 0.3
- 4h-1d: Smoothing 25, Confirmation 3, Z-Score 0.5
4. **Watch the zero line:** It's your friend. OBV behavior at the zero line reveals trend strength. Bounces = healthy trend. Breaks = reversal.
5. **Risk management:** No indicator is perfect. Use proper position sizing and stop losses. OBV should confirm your thesis, not be the only reason to trade.
6. **Combine with other indicators:**
- Price moving averages for trend confirmation
- RSI or Stochastic for overbought/oversold levels
- Support/resistance for entry/exit zones
- MACD for momentum divergences
---
## Disclaimer
This indicator is for educational and informational purposes only. It is not financial advice. Past performance does not guarantee future results. Always conduct your own research and consult with a financial advisor before making trading decisions. Trading carries risk, including potential loss of principal.
---
## Version History
**Version 1.0** - Initial release with enhanced signal filtering, Z-Score analysis, and customizable parameters.

RSI Cascade DivergencesRSI Cascade Divergences is a tool for detecting divergences between price and RSI with an extended cascade-based strength accumulation logic. A “cascade” represents a sequence of multiple divergences linked through RSI pivot points. The indicator records RSI pivots, checks whether a divergence is present, assigns a strength value to each structure, and displays only signals that meet your minimum strength thresholds.
How Divergence Logic Works
The indicator identifies local RSI extremes (pivots) based on Pivot Length and Pivot Confirm.
For every confirmed pivot it stores:
the RSI value at the pivot,
the corresponding value of the RSI Source price,
the pivot’s bar index.
How a Divergence Is Formed
A divergence is detected when two consecutive RSI pivots of the same type show opposite dynamics relative to the price source defined in RSI Source (default: close), not relative to chart highs/lows.
Bearish divergence: the price source value at the second pivot is higher, but RSI forms a lower high.
Bullish divergence: the price source value at the second pivot is lower, but RSI forms a higher low.
The indicator does not use price highs/lows — only the selected price source at the pivot points.
Cascade Strength Calculation
Each new pivot is compared only with the previous pivot of the same type.
A cascade grows in strength if:
divergence conditions are met,
the difference in RSI values exceeds Min. RSI Distance,
the previous structure already had some strength or the previous pivot was formed in the OB/OS zone.
If the divergence occurs as RSI exits OB/OS, strength is additionally increased by +1.
Behavior in Strong Trends
Divergences may appear repeatedly and even form cascades with high strength. However, if price does not react meaningfully, this indicates strong trend pressure.
In such cases, divergences stop functioning as reversal signals:
RSI attempts to counter-move, but the dominant trend continues.
The indicator accurately reflects this — cascades may form but fail to trigger any reversal, which itself suggests a powerful, persistent trend.
Filtering and Context Reset
To avoid retaining irrelevant pivots:
when RSI is above Overbought → low pivots are cleared;
when RSI is below Oversold → high pivots are cleared.
This prevents false cascades during extreme RSI conditions.
Input Parameters
RSI Source — price source used in RSI calculations (close, hl2, ohlc4, etc.).
RSI Length — RSI calculation period.
Overbought / Oversold — RSI threshold zones.
Pivot Length — number of bars to the left required for a pivot.
Pivot Confirm — bars to the right required to confirm the pivot.
Min. RSI Distance — minimum difference between two pivot RSI values for the divergence to be considered meaningful.
Min. Strength (Bull / Bear) — minimum accumulated strength for:
confirming the signal,
displaying the strength label,
triggering alerts.
Weaker signals below these thresholds appear as dashed guide structures.
Visual
Display settings for lines, markers, and colors.
These parameters do not affect the indicator logic.
Important
Divergences — including cascades — should not be used as a standalone trading signal.
Always combine them with broader market context, trend analysis, structure, volume, and risk management tools.

Auto 5-Wave Fixed Channel + Wave 5 Top / Wave 2-ABC BottomAuto 5-Wave Fixed Channel + Wave 5 Top / Wave 2-ABC Bottom
by Ron999
1. What this indicator does
This tool automatically hunts for bullish 5-wave impulse structures and then:
Labels the waves: W1, W2, W3, W4, W5
Draws a fixed “acceleration” channel based on the wave structure
Projects a Wave-5 target zone using a 1.618 extension
Marks the Wave-2 level as an ABC correction target
Triggers optional alerts when:
A new Wave-5 top completes
An ABC bottom forms back near the Wave-2 low
It’s designed as a mechanical, rule-based approximation of Elliott 5-wave impulses – built for traders who like the idea of wave structure but want something objective and programmable.
2. How the wave logic works
The script continuously scans for pivot highs and lows using a user-defined Pivot Length.
It only keeps the last 5 alternating pivots (high → low → high → low → high).
When those last 5 pivots form this pattern:
Pivot 1 → High (W1)
Pivot 2 → Low (W2)
Pivot 3 → High (W3)
Pivot 4 → Low (W4)
Pivot 5 → High (W5)
…the indicator treats this as a bullish 5-wave impulse.
When such a structure is detected, it “locks in” the wave prices and bars and draws the channels and labels.
Note: Pivots are only confirmed after Pivot Length bars, so swings are slightly delayed by design (standard pivot logic).
3. Channels & levels
Once a valid bullish 5-wave structure is found, the script builds three key pieces:
a) Base Acceleration Channel (Blue)
Anchored from Wave-2 low toward Wave-3 high.
This forms a rising acceleration channel that represents the impulse leg.
The channel extends to the right, so you can see how price interacts with it after W3–W5.
b) Wave-5 Target Line (Red, dashed)
Uses the height from Wave-2 low to Wave-3 high.
Projects a 1.618 extension of that height above Wave-3.
This line acts as a potential Wave-5 exhaustion zone (take-profit / reversal watch area).
c) Wave-2 / ABC Bottom Level (Green, dotted)
Horizontal line drawn at the Wave-2 low.
This acts as a retest / corrective target for the ABC correction after the impulse completes.
When price later revisits this area (within a tolerance), the script can mark it as a potential ABC bottom.
4. Labels & signals
If labels are enabled:
W1, W2, W3, W4, W5 are plotted directly on their corresponding pivot bars.
When an ABC-style retest is detected near the Wave-2 level, an “ABC” label is printed at that low.
Wave-5 Top Event
Triggered when a new valid bullish 5-wave structure is completed.
The last pivot high in the pattern is flagged as Wave-5.
ABC Bottom Event
After a Wave-5 impulse, the script watches for new low pivots.
If a new low forms within ABC Bottom Proximity (%) of the Wave-2 price, it is treated as an ABC bottom near Wave-2 and marked on the chart.
5. Inputs & customization
Show Fixed Channels
Toggle all channel drawing on/off.
Label Waves
Toggle plotting of W1–W5 and ABC labels.
Alerts: Wave-5 Top & ABC Bottom
Master switch for enabling the script’s alert conditions.
Pivot Length
Controls how “swingy” the detection is.
Smaller values → more frequent, smaller waves
Larger values → fewer, larger structural waves
ABC Bottom Proximity (%)
Allowed percentage distance between the ABC low and the Wave-2 price.
Example: 5% means any ABC low within ±5% of Wave-2 is considered valid.
6. Alerts (how to use them)
The script exposes two alertcondition() events:
Wave-5 Top (Bullish Impulse)
Fires when a new 5-wave bullish structure completes.
Use this to watch for potential exhaustion tops or to tighten stops.
ABC Bottom near Wave-2 Low
Fires when an ABC-style correction prints a low near the Wave-2 level.
Use this to stalk potential end-of-correction entries in the direction of the original impulse.
On TradingView, add an alert to the script and choose the desired condition from the dropdown.
7. How to use it in your trading
This tool is best used as a structural context layer, not a standalone system:
Identify bullish impulsive trends when a Wave-5 structure completes.
Use the Wave-5 target line as a potential area for:
Scaling out
Watching for exhaustion / divergences / reversal patterns
Use the Wave-2/ABC level and ABC Bottom signal:
To look for end of correction entries back in the trend direction
To align with your own confluence (support/resistance, volume, RSI, etc.)
It works well on crypto, FX, indices, and stocks, especially on higher timeframes where structure is cleaner.
8. Limitations & notes
This is a mechanical approximation of Elliott 5-wave theory — it will not match every analyst’s discretionary count.
Pivots are confirmed after Pivot Length bars, so signals are not instant; they’re based on completed swings.
The indicator currently focuses on bullish impulses (upward 5-wave structures).
As always, this is not financial advice. Combine it with your own strategy, risk management, and confirmation tools.
Created & coded by: Ron999
Built for traders who want wave structure + fixed channels, without the subjective Elliott argument on every chart. files.catbox.moe

Trendshift [CHE] StrategyTrendshift Strategy — First-Shift Structural Regime Trading
Profitfactor 2,603
Summary
Trendshift Strategy implements a structural regime-shift trading model built around the earliest confirmed change in directional structure. It identifies major swing highs and lows, validates breakouts through optional ATR-based conviction, and reacts only to the first confirmed shift in each direction. After a regime reversal, the strategy constructs a premium and discount band between the breakout candle and the previous opposite swing. This band is used as contextual bias and may optionally inform stop placement and position sizing.
The strategy focuses on clear, interpretable structural events rather than continuous signal generation. By limiting entries to the first valid shift, it reduces false recycles and allows the structural state to stabilize before a new trade occurs. All signals operate on closed-bar logic, and the strategy avoids higher-timeframe calls to stabilize execution behavior.
Motivation: Why this design?
Many structure-based systems repeatedly trigger as price fluctuates around prior highs and lows. This often leads to multiple flips during volatile or choppy conditions. Trendshift Strategy addresses this problem by restricting execution to the first confirmed structural event in each direction. ATR-based filters help differentiate genuine structural breaks from noise, while the contextual band ensures that the breakout is meaningful in relation to recent volatility.
The design aims to represent a minimalistic structural trading framework focused on regime turns rather than continuous trend signaling. This reduces chart noise and clarifies where the market transitions from one regime to another.
What’s different vs. standard approaches?
Baseline reference
Typical swing-based structure indicators report every break above or below recent swing points.
Architecture differences
First-shift-only regime logic that blocks repeated signals until direction reverses
ATR-filtered validation to avoid weak or momentum-less breaks
Premium and discount bands derived from breakout structure
Optional band-driven stop placement
Optional band-dependent position-sizing factor
Regime timeout system to neutralize structure after extended inactivity
Persistent-state architecture to prevent re-triggering
Practical effect
Only the earliest actionable structure change is traded
Fewer but higher-quality signals
Premium/discount tint assists contextual evaluation
Stops and sizing can be aligned with structural context rather than arbitrary volatility measures
Improved chart interpretability due to reduced marker frequency
How it works (technical)
The algorithm evaluates symmetric swing points using a fixed bar window. When a swing forms, its value and bar index are stored as persistent state. A structural shift occurs when price closes beyond the most recent major swing on the opposite side. If ATR filtering is enabled, the breakout must exceed a volatility-scaled distance to prevent micro-breaks from firing.
Once a valid shift is confirmed, the regime is updated to bullish or bearish. The script records the breakout level, the opposite swing, and derives a band between them. This band is checked for minimum size relative to ATR to avoid unrealistic contexts.
The first shift in a new direction generates both the strategy entry and a visual marker. Additional shifts in the same direction are suppressed until a reversal occurs. If a timeout is enabled, the regime resets after a specified number of bars without structural change, optionally clearing the band.
Stop placement, if enabled, uses either the opposite or same band edge depending on configuration. Position size is computed from account percentage and may optionally scale with the price-span-to-ATR relationship.
Parameter Guide
Market Structure
Swing length (default 5): Controls swing sensitivity. Lower values increase responsiveness.
Use ATR filter (default true): Requires breakouts to show momentum relative to ATR. Reduces false shifts.
ATR length (default 14): Volatility estimation for breakout and band validation.
Break ATR multiplier (default 1.0): Required breakout strength relative to ATR.
Premium/Discount Framework
Enable framework (default true): Activates premium/discount evaluation.
Persist band on timeout (default true): Keeps structural band after timeout.
Min band ATR mult (default 0.5): Rejects narrow bands.
Regime timeout bars (default 500): Neutralizes regime after inactivity.
Invert colors (default false): Color scheme toggle.
Visuals
Show zone tint (default true): Background shade in premium or discount region.
Show shift markers (default true): Display first-shift markers.
Execution and Risk
Risk per trade percent (default 1.0): Determines position size as account percentage.
Use band for size (default false): Scales size relative to band width behavior.
Flat on opposite shift (default true): Forces reversal behavior.
Use stop at band (default false): Stop anchored to band edges.
Stop band side: Chooses which band edge is used for stop generation.
Reading & Interpretation
A green background indicates discount conditions within the structural band; red indicates premium conditions. A green triangle below price marks the first bullish structural shift after a bearish regime. A red triangle above price marks the first bearish structural shift after a bullish regime.
When stops are active, the opposite band edge typically defines the protective level. Band width relative to ATR indicates how significant a structural change is: wider bands imply stronger volatility structure, while narrow bands may be suppressed by the minimum-size filter.
Practical Workflows & Combinations
Trend following: Use first-shift entries as initial regime confirmation. Add higher-timeframe trend filters for additional context.
Swing trading: Combine with simple liquidity or fair-value-gap concepts to refine entries.
Bias mapping: Use higher timeframes for structural regime and lower timeframes for execution within the premium/discount context.
Exit management: When using stops, consider ATR-scaling or multi-stage profit targets. When not using stops, reversals become the primary exit.
Behavior, Constraints & Performance
The strategy uses only confirmed swings and closed-bar logic, avoiding intrabar repaint. Pivot-based swings inherently appear after the pivot window completes, which is standard behavior. No higher-timeframe calls are used, preventing HTF-related repaint issues.
Persistent variables track regime and structural levels, minimizing recomputation. The maximum bars back setting is five-thousand. The design avoids loops and arrays, keeping performance stable.
Known limitations include limited signal density during consolidations, delayed swing confirmation, and sensitivity to extreme gaps that stretch band logic. ATR filtering mitigates some of these effects but does not eliminate them entirely.
Sensible Defaults & Quick Tuning
Fewer but stronger entries: Increase swing length or ATR breakout multiplier.
More responsive entries: Reduce swing length to capture earlier shifts.
More active band behavior: Lower the minimum band ATR threshold.
Stricter stop logic: Use the opposite band edge for stop placement.
Volatile markets: Increase ATR length slightly to stabilize behavior.
What this indicator is—and isn’t
Trendshift Strategy is a structural-regime trading engine that evaluates major directional shifts. It is not a complete trading system and does not include take-profit logic or prediction features. It does not attempt to forecast future price movement and should be used alongside broader market structure, volatility context, and disciplined risk management.
Disclaimer
The content provided, including all code and materials, is strictly for educational and informational purposes only. It is not intended as, and should not be interpreted as, financial advice, a recommendation to buy or sell any financial instrument, or an offer of any financial product or service. All strategies, tools, and examples discussed are provided for illustrative purposes to demonstrate coding techniques and the functionality of Pine Script within a trading context.
Any results from strategies or tools provided are hypothetical, and past performance is not indicative of future results. Trading and investing involve high risk, including the potential loss of principal, and may not be suitable for all individuals. Before making any trading decisions, please consult with a qualified financial professional to understand the risks involved.
By using this script, you acknowledge and agree that any trading decisions are made solely at your discretion and risk.
Do not use this indicator on Heikin-Ashi, Renko, Kagi, Point-and-Figure, or Range charts, as these chart types can produce unrealistic results for signal markers and alerts.
Best regards and happy trading
Chervolino

Elite S&D [By:CienF]Elite Supply & Demand
Description
Elite Supply & Demand is not just another zone indicator; it is a complete institutional trading system designed to identify high-probability imbalances in the market. Unlike standard indicators that flood the chart with weak zones, this script applies rigorous Price Action rules to filter, score, and validate only the most significant areas of interest.
The core philosophy of this tool is "Anormality". Institutional activity leaves a footprint in the form of explosive volatility relative to the recent context. This indicator detects these footprints, measures their intensity, and validates them against market structure.
Key Features
🔥 Dynamic Quality Scoring (The "Elite" Feature) The indicator doesn't just draw boxes; it rates them. It calculates a Volumetric Ratio comparing the explosive move against the historical average at the moment of creation.
Contextual Intelligence: It continues to track the initial move. If the momentum continues after a small pause, the score updates in real-time.
Visual Grades:
🔥 Fire: High Anormality (Institutional Imbalance).
⚡ Lightning: Moderate Anormality (Decent strength).
No Icon: Standard move.
🏗️ Advanced Structure Validation Includes a unique "Eventual Break" filter.
Latent Zones: You can choose to hide zones that haven't broken structure yet.
Auto-Validation: The zone remains invisible/transparent until price breaks a recent High/Low or Fractal Pivot. Once the break occurs, the zone "activates" on your chart.
🧠 Smart Mitigation Logic
No Zombie Zones: Once a zone is mitigated (touched), it is strictly processed. It can either turn gray (History Mode) or be removed instantly.
Priority Handling: Mitigated zones are never re-colored or re-validated, keeping your chart clean and accurate.
🚀 Performance Optimization
Date Lookback: Includes a "Days Back" filter to prevent the script from calculating thousands of historical candles, ensuring smooth performance even on lower timeframes (1m, 5m).
🔔 Integrated Alerts
Creation: Get notified immediately when a potential zone forms.
Validation: Get notified specifically when a latent zone breaks structure and becomes active.
How It Works ( The Logic)
Phase 1: The Base (Indecision): Identifies candles with small bodies (≤ 50% of range) representing equilibrium/accumulation.
Phase 2: The Explosion (Imbalance): Looks for a strong breakout candle (≥ 60% body) that moves away from the base.
Phase 3: The Follow-up: Verifies that the move continues. It allows for "Smart Pauses" (single indecision candles) within the trend but invalidates the zone if a reversal occurs immediately.
Phase 4: Structure Check: Verifies if the move broke the Recent Range (High/Low) or Fractal Pivots.
Settings & Configuration
1. Base & Exit Rules
Max % Body: Threshold to define an indecision candle (Default: 50%).
Explosive Min: Minimum strength required for the exit candle.
2. Structure Validation
Structure Type: Choose between Recent Range (more fluid) or Fractal Pivots (stricter).
Filter Eventual Break: Highly Recommended. If checked, zones appear only after they prove their strength by breaking structure.
3. Scoring (Quality)
High Quality Ratio: The multiplier required to earn the 🔥 icon (e.g., 2.0x larger than average).
Allow Pause: Allows the algorithm to capture larger moves even if there is a single small candle in the middle of the explosive leg.
4. Performance
Days Back: Limits how far back the indicator draws. Reduce this number on low timeframes to speed up loading.
Usage Recommendations
For Trend Trading: Look for "Follow-up" zones. If you see a 🔥 zone forming in the direction of the higher timeframe trend, it is a high-probability entry.
For Reversals: Use the "Filter Eventual Break" feature. Wait for the indicator to reveal a zone that has broken a major structure point.
Stop Loss Placement: The indicator draws the zone covering the entire "Base" (wicks included). A safe stop is typically just beyond the distal line (33% recommended) of the box.
🔔 How to Set Up Alerts
Since this indicator uses the dynamic alert() function to send detailed messages (Entry Price, Stop Zone, Type), you must configure it correctly:
Add the indicator to your chart and adjust the settings to your preference.
Click the "Create Alert" button (Clock Icon) on the right toolbar or press Alt + A.
Condition: Select "Elite S&D " from the dropdown menu.
Trigger (CRITICAL): You must select "Any alert() function call".
Note: Do not select "Crossing" or other standard conditions, or the alerts will not trigger.
Expiration: Select "Open-ended" (if you have a Premium plan) or set a future date.
Alert Actions: Choose where you want to receive the alert (Notify on App, Show Popup, Send Email, etc.).
Message: You can leave this default. The script automatically generates a detailed message with the Ticker, Timeframe, Zone Type, and Coordinates.
Click Create.
Disclaimer: This tool is designed to assist in technical analysis and does not constitute financial advice. Always use proper risk management.

🔥 SMC Reversal Engine v3.5 – Clean FVG + DashboardSMC Reversal Engine v3.5 – Clean FVG + Dashboard
The SMC Reversal Engine is a precision-built Smart Money Concepts tool designed to help traders understand market structure the single most important foundation in reading price action. It reveals how institutions move liquidity, where structure shifts occur, and how Fair Value Gaps (FVGs) align with these changes to signal potential reversals or continuations.
Understanding How It Works
At its core, the script detects CHoCH (Change of Character) and BOS (Break of Structure)—the two key turning points in institutional order flow. A CHoCH shows that the market has reversed intent (for example, from bearish to bullish), while a BOS confirms a continuation of the current trend. Together, they form the backbone of structure-based trading.
To refine this logic, the engine uses fractal pivots clusters of candles that confirm swing highs and lows. Fractals filter out noise, identifying points where price truly changes direction. The script lets you set this sensitivity manually or automatically adapts it depending on the timeframe. Lower fractal sensitivity captures smaller intraday swings for scalpers, while higher sensitivity locks onto major swing structures for swing and position traders.
The dashboard gives you a real-time reading of the trend, the last high and low, and what the market is likely to do next—for example, “Expect HL” or “Wait for LH.” It even tracks the accuracy of these structure predictions over time, giving an educational feedback loop to help you learn price behavior.
Fair Value Gaps and Tap Entries
Fair Value Gaps (FVGs) mark moments when price moves too quickly, leaving inefficiencies that institutions often revisit. When price taps into an FVG, it often acts as a high-probability entry zone for reversals or continuations. The script automatically detects, extends, and deletes old FVGs, keeping only relevant zones visible for a clean chart.
Traders can enable markTapEntry to visually confirm when an FVG gets filled. This is a simple but powerful trigger that often aligns with CHoCH or BOS moments.
Recommended Settings for Different Traders
For Scalpers, use a lower HTF structure such as 1 minute or 5 minutes. Keep Auto Fractals on for faster reaction, and limit FVG zones to 2–3. This gives you a clean, real-time reflection of order flow.
For Intraday Traders, 15-minute to 1-hour structure gives the perfect balance between reactivity and stability. Fractal sensitivity around 3–5 captures the most actionable levels without excessive noise.
For Swing Traders, use 4-hour, 1-day, or even 3-day structure. The chart becomes smoother, showing higher-order CHoCH and BOS that define true institutional transitions. Combine this with EMA confirmation for higher conviction.
For Position or Macro Traders, select Weekly or Monthly structure. The dynamic label system expands automatically to keep more historical BOS/CHoCH points visible, allowing you to see long-term shifts clearly.
Educational Value
This indicator is built to teach traders how to see structure the way professionals and smart money do. You’ll learn to recognize how markets transition from one phase to another from accumulation to manipulation to expansion. Each CHoCH or BOS helps you decode where liquidity is being taken and where new intent begins.
The included SMC Quick Guide explains each structural cue right on your chart. Within days of using it, you’ll start noticing patterns that reveal how price really moves, instead of guessing based on indicators.
Settings and How to Use Them
Everything in the SMC Reversal Engine is designed to adapt to your trading style and help you read structure like a professional.
When you open the Inputs Panel, you’ll see sections like Fractal Settings, FVG Settings, Buy/Sell Confirmation, and Educational Tools.
Under Fractal Settings, you can choose the higher timeframe (HTF) that defines structure—from minutes to weeks. The Auto Fractal Sensitivity option automatically adjusts how tight or wide swing points are detected. Lower sensitivity captures short-term fluctuations (great for scalpers), while higher values filter noise and isolate major swing highs and lows (perfect for swing traders).
The Fair Value Gap (FVG) options manage imbalance zones—the footprints of institutional orders. You can show or hide these zones, extend them into the future, and control how long they remain before auto-deletion. The Mark Entry When FVG is Tapped option places a small label when price revisits the gap—a potential entry signal that aligns with smart money logic.
EMA Confirmation adds a layer of confluence. The script can automatically scale EMA lengths based on timeframe, or you can input your preferred values (for example, 9/21 for intraday, 50/200 for swing). Require EMA Crossover Confirmation helps filter false moves, keeping you trading only with aligned momentum.
The Educational section gives traders visual reinforcement. When enabled, you’ll see tags like HH (Higher High), HL (Higher Low), LH (Lower High), and LL (Lower Low). These show structure shifts in real time, helping you learn visually what market structure really means. The Cheat Sheet panel summarizes each term, always visible in the corner for quick reference.
Early Top Warnings use wick size and RSI divergence to signal when price may be overextended—a useful heads-up before potential CHoCH formations.
Finally, the Narrative and Accuracy System translates structure into simple English—messages like Trend Bullish → Wait for HL or BOS Bearish → Expect LL. Over time, you can monitor how accurate these expectations have been, training your pattern recognition and confidence.
Pro Tips for Getting the Most Out of the SMC Reversal Engine
1. Start on Higher Timeframes First: Begin on the 4H or Daily chart where structure is cleaner and signals have more weight. Then scale down for entries once you grasp directional intent.
2. Use FVGs for Context, Not Just Entries: Observe how price behaves around unfilled FVGs—they often act as magnets or barriers, offering insight into where liquidity lies.
3. Combine With HTF Bias: Always trade in the direction of your higher timeframe trend. A bullish weekly BOS means lower timeframes should ideally align bullishly for optimal setups.
4. Clean Charts = Clear Mind: Use Minimal Mode when focusing on price action, then toggle the educational tools back on to review structure for learning.
5. Don’t Chase Every CHoCH or BOS: Focus on significant breaks that align with broader context and liquidity sweeps, not minor fluctuations.
6. Accuracy Rate Is a Feedback Tool: Use the accuracy stat as a reflection of consistency—not a trade trigger.
7. Build Narrative Awareness: Read the on-chart narrative messages to reinforce structured thinking and stay disciplined.
8. Practice Replay Mode: Step through past structures to visually connect CHoCH, BOS, and FVG behavior. It’s one of the best ways to train pattern recognition.
Summary
* Detects CHoCH and BOS automatically with fractal precision
* Identifies and manages Fair Value Gaps (FVGs) in real time
* Displays a smart dashboard with accuracy tracking
* Adapts label visibility dynamically by timeframe
* Perfect for both learning and trading with institutional clarity
This tool isn’t about predicting the market—it’s about understanding it. Once you can read structure, everything else in trading becomes secondary.

Asymmetric Market Momentum Channel█ OVERVIEW
"Asymmetric Market Momentum Channel" is a dynamic channel indicator that adjusts its width based on the actual strength and asymmetry of market momentum. Thanks to the asymmetric band expansion triggered by strong candles, it significantly reduces false breakouts while remaining highly sensitive to genuine moves.
█ CONCEPTS
Traditional volatility channels react too slowly or too uniformly. This indicator introduces asymmetry:
- After a strong bullish candle with a large body and long upper wick, the upper band is pushed much farther than the lower one.
- After a strong bearish candle, the lower band expands more.
As a result, the channel "remembers" the direction of the last real momentum.
- With wide bands (default base_scale 200+), it excels in contrarian (reversal) strategies – price tends to return to the midline, producing clean reversal signals.
- With narrow bands (base_scale set to 100–150), it behaves like a sensitive breakout channel – breakouts from a tight channel deliver very high-quality trend-continuation signals.
█ FEATURES
Fully adjustable asymmetric momentum channel:
- length – SMA period for midline and average range (default 30)
- base_scale – base channel width in % of average candle range (default 200%)
- strength – asymmetry intensity (higher = stronger expansion after powerful candles)
- smooth_len – EMA smoothing of the expansion (default 10)
Visualization:
- Upper band – red, lower band – green
- Midline SMA – gray
- Gradient background fill (enabled by default) – red above midline, green below; intensity controlled by Background Intensity (85 = strong, 95 = very subtle)
Signal modes:
- Contrarian (Reversal) – reversal signals on price returning inside the channel after exceeding it + confirming candle color
- Trend Continuation (Breakout) – classic breakout signals (recommended to lower base_scale to 100–150 for faster triggers)
- Both – displays both types simultaneously
Visual signals:
- Small green triangles below the bar → bullish signal
- Small red triangles above the bar → bearish signal
Alerts: Bullish Signal, Bearish Signal, Any Signal, Breakout Up, Breakout Down
█ HOW TO USE
Add the indicator to your TradingView chart and adjust the settings:
Key parameter:
- base_scale – defines the indicator’s character:
→ 200–300% → wide channel → Contrarian (reversal) mode
→ 100–150% → narrow channel → Trend Continuation (breakout) mode
- strength (default 1.0)
- length (30) – higher values = smoother, more trend-following behavior
smooth_len (10) – lower values = faster reaction to new momentum
Interpretation:
- Wide channel (base_scale ≥ 200) + Contrarian mode → mean-reversion trading
- Narrow channel (base_scale 100–150) + Breakout mode → aggressive trend-following on breakouts
- Both mode works universally – simply change base_scale to completely switch the indicator’s behavior
█ APPLICATIONS
- Scalping & daytrading – narrow channel + Breakout mode on 5–15 min
- Swing trading – narrow or wide channel + Both mode on H1–D1
- Mean-reversion – wide channel + Contrarian mode
- Trend filter – longs only above midline, shorts only below
█ NOTES
- In very strong one-sided trends, contrarian signals generate many false entries – switch exclusively to Trend Continuation (Breakout) mode with a narrow channel.
- Best performance on instruments with clear volatility and volume.
- Always match base_scale to your strategy (wide = reversal, narrow = breakout).
- Combining with volume, support/resistance levels, or indicators like MACD/RSI dramatically improves signal quality.

Liquidity Void Zone Detector [PhenLabs]📊 Liquidity Void Zone Detector
Version: PineScript™v6
📌 Description
The Liquidity Void Zone Detector is a sophisticated technical indicator designed to identify and visualize areas where price moved with abnormally low volume or rapid momentum, creating "voids" in market liquidity. These zones represent areas where insufficient trading activity occurred during price movement, often acting as magnets for future price action as the market seeks to fill these gaps.
Built on PineScript v6, this indicator employs a dual-detection methodology that analyzes both volume depletion patterns and price movement intensity relative to ATR. The revolutionary 3D visualization system uses three-layer polyline rendering with adaptive transparency and vertical offsets, creating genuine depth perception where low liquidity zones visually recede and high liquidity zones protrude forward. This makes critical market structure immediately apparent without cluttering your chart.
🚀 Points of Innovation
Dual detection algorithm combining volume threshold analysis and ATR-normalized price movement sensitivity for comprehensive void identification
Three-layer 3D visualization system with progressive transparency gradients (85%, 78%, 70%) and calculated vertical offsets for authentic depth perception
Intelligent state machine logic that tracks consecutive void bars and only renders zones meeting minimum qualification requirements
Dynamic strength scoring system (0-100 scale) that combines inverted volume ratios with movement intensity for accurate void characterization
Adaptive ATR-based spacing calculation that automatically adjusts 3D layering depth to match instrument volatility
Efficient memory management system supporting up to 100 simultaneous void visualizations with automatic array-based cleanup
🔧 Core Components
Volume Analysis Engine: Calculates rolling volume averages and compares current bar volume against dynamic thresholds to detect abnormally thin trading conditions
Price Movement Analyzer: Normalizes bar range against ATR to identify rapid price movements that indicate liquidity exhaustion regardless of instrument or timeframe
Void Tracking State Machine: Maintains persistent tracking of void start bars, price boundaries, consecutive bar counts, and cumulative strength across multiple bars
3D Polyline Renderer: Generates three-layer rectangular polylines with precise timestamp-to-bar index conversion and progressive offset calculations
Strength Calculation System: Combines volume component (inverted ratio capped at 100) with movement component (ATR intensity × 30) for comprehensive void scoring
🔥 Key Features
Automatic Void Detection: Continuously scans price action for low volume conditions or rapid movements, triggering void tracking when thresholds are exceeded
Real-Time Visualization: Creates 3D rectangular zones spanning from void initiation to termination, with color-coded depth indicating liquidity type
Adjustable Sensitivity: Configure volume threshold multiplier (0.1-2.0x), price movement sensitivity (0.5-5.0x), and minimum qualifying bars (1-10) for customized detection
Dual Color Coding: Separate visual treatment for low liquidity voids (receding red) and high liquidity zones (protruding green) based on 50-point strength threshold
Optional Compact Labels: Toggle LV (Low Volume) or HV (High Volume) circular labels at void centers for quick identification without visual clutter
Lookback Period Control: Adjust analysis window from 5 to 100 bars to match your trading timeframe and market volatility characteristics
Memory-Efficient Design: Automatically manages polyline and label arrays, deleting oldest elements when user-defined maximum is reached
Data Window Integration: Plots void detection binary, current strength score, and average volume for detailed analysis in TradingView's data window
🎨 Visualization
Three-Layer Depth System: Each void is rendered as three stacked polylines with progressive transparency (85%, 78%, 70%) and calculated vertical offsets creating authentic 3D appearance
Directional Depth Perception: Low liquidity zones recede with back layer most transparent; high liquidity zones protrude with front layer most transparent for instant visual differentiation
Adaptive Offset Spacing: Vertical separation between layers calculated as ATR(14) × 0.001, ensuring consistent 3D effect across different instruments and volatility regimes
Color Customization: Fully configurable base colors for both low liquidity zones (default: red with 80 transparency) and high liquidity zones (default: green with 80 transparency)
Minimal Chart Clutter: Closed polylines with matching line and fill colors create clean rectangular zones without unnecessary borders or visual noise
Background Highlight: Subtle yellow background (96% transparency) marks bars where void conditions are actively detected in real-time
Compact Labeling: Optional tiny circular labels with 60% transparent backgrounds positioned at void center points for quick reference
📖 Usage Guidelines
Detection Settings
Lookback Period: Default: 10 | Range: 5-100 | Number of bars analyzed for volume averaging and void detection. Lower values increase sensitivity to recent changes; higher values smooth detection across longer timeframes. Adjust based on your trading timeframe: short-term traders use 5-15, swing traders use 20-50, position traders use 50-100.
Volume Threshold: Default: 1.0 | Range: 0.1-2.0 (step 0.1) | Multiplier applied to average volume. Bars with volume below (average × threshold) trigger void conditions. Lower values detect only extreme volume depletion; higher values capture more moderate low-volume situations. Start with 1.0 and decrease to 0.5-0.7 for stricter detection.
Price Movement Sensitivity: Default: 1.5 | Range: 0.5-5.0 (step 0.1) | Multiplier for ATR-normalized price movement detection. Values above this threshold indicate rapid price changes suggesting liquidity voids. Increase to 2.0-3.0 for volatile instruments; decrease to 0.8-1.2 for ranging or low-volatility conditions.
Minimum Void Bars: Default: 10 | Range: 1-10 | Minimum consecutive bars exhibiting void conditions required before visualization is created. Filters out brief anomalies and ensures only sustained voids are displayed. Use 1-3 for scalping, 5-10 for intraday trading, 10+ for swing trading to match your time horizon.
Visual Settings
Low Liquidity Color: Default: Red (80% transparent) | Base color for zones where volume depletion or rapid movement indicates thin liquidity. These zones recede visually (back layer most transparent). Choose colors that contrast with your chart theme for optimal visibility.
High Liquidity Color: Default: Green (80% transparent) | Base color for zones with relatively higher liquidity compared to void threshold. These zones protrude visually (front layer most transparent). Ensure clear differentiation from low liquidity color.
Show Void Labels: Default: True | Toggle display of compact LV/HV labels at void centers. Disable for cleaner charts when trading; enable for analysis and review to quickly identify void types across your chart.
Max Visible Voids: Default: 50 | Range: 10-100 | Maximum number of void visualizations kept on chart. Each void uses 3 polylines, so setting of 50 maintains 150 total polylines. Higher values preserve more history but may impact performance on lower-end systems.
✅ Best Use Cases
Gap Fill Trading: Identify unfilled liquidity voids that price frequently returns to, providing high-probability retest and reversal opportunities when price approaches these zones
Breakout Validation: Distinguish genuine breakouts through established liquidity from false breaks into void zones that lack sustainable volume support
Support/Resistance Confluence: Layer void detection over key horizontal levels to validate structural integrity—levels within high liquidity zones are stronger than those in voids
Trend Continuation: Monitor for new void formation in trend direction as potential continuation zones where price may accelerate due to reduced resistance
Range Trading: Identify void zones within consolidation ranges that price tends to traverse quickly, helping to avoid getting caught in rapid moves through thin areas
Entry Timing: Wait for price to reach void boundaries rather than entering mid-void, as voids tend to be traversed quickly with limited profit-taking opportunities
⚠️ Limitations
Historical Pattern Indicator: Identifies past liquidity voids but cannot predict whether price will return to fill them or when filling might occur
No Volume on Forex: Indicator uses tick volume for forex pairs, which approximates but doesn't represent true trading volume, potentially affecting detection accuracy
Lagging Confirmation: Requires minimum consecutive bars (default 10) before void is visualized, meaning detection occurs after void formation begins
Trending Market Behavior: Strong trends driven by fundamental catalysts may create voids that remain unfilled for extended periods or permanently
Timeframe Dependency: Detection sensitivity varies significantly across timeframes; settings optimized for one timeframe may not perform well on others
No Directional Bias: Indicator identifies liquidity characteristics but provides no predictive signal for price direction after void detection
Performance Considerations: Higher max visible void settings combined with small minimum void bars can generate numerous visualizations impacting chart rendering speed
💡 What Makes This Unique
Industry-First 3D Visualization: Unlike flat volume or liquidity indicators, the three-layer rendering with directional depth perception provides instant visual hierarchy of liquidity quality
Dual-Mode Detection: Combines both volume-based and movement-based detection methodologies, capturing voids that single-approach indicators miss
Intelligent Qualification System: State machine logic prevents premature visualization by requiring sustained void conditions, reducing false signals and chart clutter
ATR-Normalized Analysis: All detection thresholds adapt to instrument volatility, ensuring consistent performance across stocks, forex, crypto, and futures without constant recalibration
Transparency-Based Depth: Uses progressive transparency gradients rather than colors or patterns to create depth, maintaining visual clarity while conveying information hierarchy
Comprehensive Strength Metrics: 0-100 void strength calculation considers both the degree of volume depletion and the magnitude of price movement for nuanced zone characterization
🔬 How It Works
Phase 1: Real-Time Detection
On each bar close, the indicator calculates average volume over the lookback period and compares current bar volume against the volume threshold multiplier
Simultaneously measures current bar's high-low range and normalizes it against ATR, comparing the result to price movement sensitivity parameter
If either volume falls below threshold OR movement exceeds sensitivity threshold, the bar is flagged as exhibiting void characteristics
Phase 2: Void Tracking & Qualification
When void conditions first appear, state machine initializes tracking variables: start bar index, initial top/bottom prices, consecutive bar counter, and cumulative strength accumulator
Each subsequent bar with void conditions extends the tracking, updating price boundaries to envelope all bars and accumulating strength scores
When void conditions cease, system checks if consecutive bar count meets minimum threshold; if yes, proceeds to visualization; if no, discards the tracking and resets
Phase 3: 3D Visualization Construction
Calculates average void strength by dividing cumulative strength by number of bars, then determines if void is low liquidity (>50 strength) or high liquidity (≤50 strength)
Generates three polyline layers spanning from start bar to end bar and from top price to bottom price, each with calculated vertical offset based on ATR
Applies progressive transparency (85%, 78%, 70%) with layer ordering creating recession effect for low liquidity zones and protrusion effect for high liquidity zones
Creates optional center label and pushes all visual elements into arrays for memory management
Phase 4: Memory Management & Display
Continuously monitors polyline array size (each void creates 3 polylines); when total exceeds max visible voids × 3, deletes oldest polylines via array.shift()
Similarly manages label array, removing oldest labels when count exceeds maximum to prevent memory accumulation over extended chart history
Plots diagnostic data to TradingView’s data window (void detection binary, current strength, average volume) for detailed analysis without cluttering main chart
💡 Note:
This indicator is designed to enhance your market structure analysis by revealing liquidity characteristics that aren’t visible through standard price and volume displays. For best results, combine void detection with your existing support/resistance analysis, trend identification, and risk management framework. Liquidity voids are descriptive of past market behavior and should inform positioning decisions rather than serve as standalone entry/exit signals. Experiment with detection parameters across different timeframes to find settings that align with your trading style and instrument characteristics.

nOI + Funding + CVD • strategynOI + Funding + CVD Strategy
Overview
This strategy is designed for cryptocurrency trading on platforms like TradingView, focusing on perpetual futures markets. It combines three key indicators—Normalized Open Interest (nOI), Funding Rate, and Cumulative Volume Delta (CVD)—to generate buy and sell signals for long and short positions. The strategy aims to capitalize on market imbalances, such as overextended open interest, funding rate extremes, and volume deltas, which often signal potential reversals or continuations in trending markets.
The script supports pyramiding (up to 10 positions), uses percentage-based position sizing (default 10% of equity per trade), and allows customization of trade directions (longs and shorts can be enabled/disabled independently). It includes multiple signal systems for entries, various exit mechanisms (including stop-loss, take-profit, time-based exits, and conditional closes based on indicators), a Martingale add-on system for averaging positions during drawdowns, and handling of opposite signals (ignore, close, or reverse).
This strategy is not financial advice; backtest thoroughly and use at your own risk. It requires data sources for Open Interest (OI) and Funding Rates, which are fetched via TradingView's security functions (e.g., from Binance for funding premiums).
Key Indicators
1. Normalized Open Interest (nOI)
Group: Open Interest
Purpose: Measures the relative level of open interest over a lookback window to identify overbought (high OI) or oversold (low OI) conditions, which can indicate potential exhaustion in trends.
Calculation:
Fetches OI data (close) from the symbol's standard ticker (e.g., "{symbol}_OI").
Normalizes OI within a user-defined window (default: 500 bars) using min-max scaling: (OI - min_OI) / (max_OI - min_OI) * 100.
Upper threshold (default: 70%): Signals potential short opportunities when crossed from above.
Lower threshold (default: 30%): Signals potential long opportunities when crossed from below.
Visualization: Plotted as a line (teal above upper, red below lower, gray in between). Horizontal lines at upper, mid (50%), lower, and a separator at 102%.
Notes: Handles non-crypto symbols by adjusting timeframe to daily if intraday. Errors if no OI data available.
2. Funding Rate
Group: Funding Rate
Purpose: Tracks the average funding rate (premium index) to detect market sentiment extremes. Positive funding suggests bull bias (longs pay shorts), negative suggests bear bias.
Calculation:
Fetches premium index data from Binance (e.g., "binance:{base}usdt_premium").
Supports lower timeframe aggregation (default: enabled, using 1-min TF) for smoother data.
Averages open and close premiums, clamps values, and scales/shifts for plotting (base: 150, scale: 1000x).
Upper threshold (default: 1.0%): Overheat for shorts.
Lower threshold (default: 1.0%): Overcool for longs.
Ultra level (default: 1.8%): Extreme for additional short signals.
Smoothing: Uses inverse weighted moving average (IWMA) or lower-TF aggregation to reduce noise.
Visualization: Shifted plot (green positive, red negative) with filled areas. Horizontal lines for overheat, overcool, base (0%), and ultra.
Notes: Custom ticker option for non-standard symbols.
3. Cumulative Volume Delta (CVD)
Group: CVD (Cumulative Volume Delta)
Purpose: Measures net buying/selling pressure via volume delta, normalized to identify divergences or confirmations with price.
Calculation:
Delta: +volume if close > open, -volume if close < open.
Cumulative: Rolling cumsum over a window (default: 500 bars), smoothed with EMA (default: 20).
Normalized: Scaled by absolute max in window (-1 to 1 range).
Scaled/shifted for plotting (base: 300 or 0 if anchored, scale: 120x).
Upper threshold (default: 1.0%): Over for shorts.
Lower threshold (default: 1.0%): Under for longs.
Visualization: Shifted plot (aqua positive, purple negative) with filled areas. Horizontal lines for over, under, and separator (default: 252).
Filter Options (for Signal A):
Enable filter (default: false).
Require sign match (Long ≥0, Short ≤0).
Require extreme zones.
Require momentum (rising/falling over N bars, default: 3).
Signal Logics for Entries
Entries are triggered by buy/sell signals from multiple systems (A, B, C, D), filtered by direction toggles and entry conditions.
Signal System A: OI + Funding (with optional CVD filter)
Enabled: Default true.
Sell (Short): nOI > upper threshold, falling over N bars (default: 3), delta ≥ threshold (default: 3%), funding > overheat, and CVD filter OK.
Buy (Long): nOI < lower threshold, rising over N bars (default: 3), delta ≥ threshold (default: 3%), funding < overcool, and CVD filter OK.
Signal System B: Short - Funding Crossunder + Filters
Enabled: Default true.
Sell (Short): Funding crosses under overheat level, optional: CVD > over, nOI < upper.
Signal System C: Short - Ultra Funding
Enabled: Default false.
Sell (Short): Funding crosses ultra level (up or down, both default true).
Signal System D: Long - Funding Crossover + Filters
Enabled: Default true.
Buy (Long): Funding crosses over overcool level, optional: CVD < under, nOI > lower.
Combined: Sell if A/B/C active; Buy if A/D active.
Entry Filters
Cooldown: Optional pause between entries (default: false, 3 bars).
Max Entries: Limit pyramiding (default: true, 6 max).
Entries only if both filters pass and direction allowed.
Opposite Signal Handling
Mode: Ignore (default), Reverse (close and enter opposite), or Close (exit only).
Processed before regular entries.
Position Management
Martingale (3 Steps):
Enabled per step (default: all true).
Triggers add-ons at loss levels (defaults: 5%, 8%, 11%) by adding % to position (default: 100% each).
Resets on position close.
Break Even:
Enabled (default: true).
Activates at profit threshold (default: 5%), sets SL better by offset (default: 0.1%).
Exit Systems
Multiple exits checked in sequence.
Exit 1: SL/TP
Enabled: Separate for long/short (default: true).
SL: % from avg price (defaults: 1% long/short).
TP: % from avg price (defaults: 2% long/short).
Exit 2: Funding
Enabled: Separate for long (up) / short (down) (default: true).
Long Exit: Funding > upper exit threshold (default: 0.8%).
Short Exit: Funding < lower exit threshold (default: 0.8%).
Exit 3: nOI
Enabled: Separate for long (up) / short (down) (default: true).
Long Exit: nOI > upper exit (default: 85%).
Short Exit: nOI < lower exit (default: 15%).
Exit 4: Global SL
Enabled: Default true.
Exit: If position loss ≥ % (default: 7%).
Exit 5: Break Even (integrated in position block)
Exit 6: Time Limit
Enabled: Separate for long/short (default: true).
Exit: After N bars in trade (defaults: 30 each).
Timer updates on add-ons if enabled (default: true).
Visual Elements
Buy/Sell Labels: Small labels ("BUY"/"SELL") on bars with signals, limited to last 30.
All indicators plotted on a separate pane (overlay=false).
Usage Notes
Backtesting: Adjust parameters based on asset/timeframe. Test on historical data.
Data Requirements: Works best on crypto perps with OI and funding data.
Risk Management: Incorporates SL/TP and global SL; monitor drawdowns with Martingale.
Customization: All thresholds, enables, and scales are inputs for fine-tuning.
Version: Pine Script v6.
For questions or improvements, contact the author. Happy trading!
