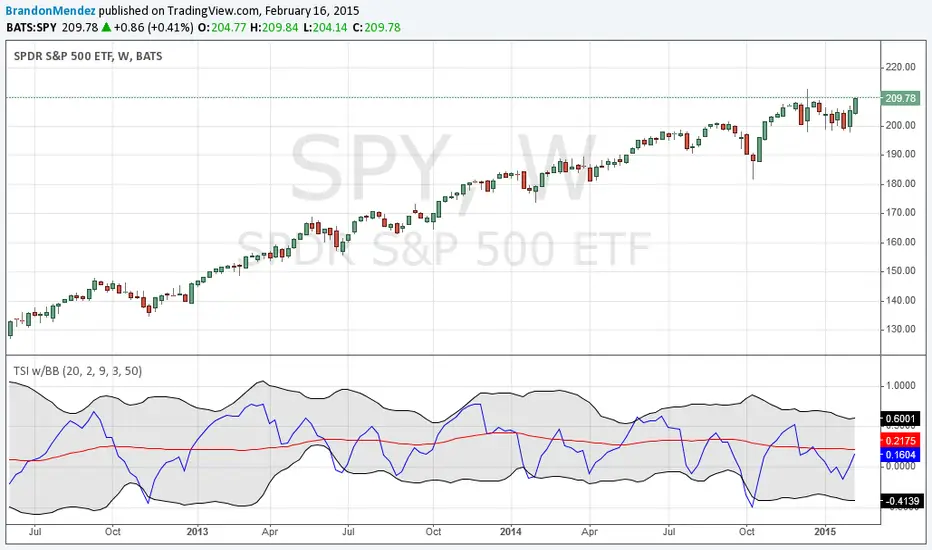
TSI w/BBA simple modification of the normal TSI indicator. It adds Bollinger Bands that are based on the TSI values, instead of the price history.
I find this indicator useful on the weekly interval.
Cerca negli script per "tsi"
TSI Long/Short for BTC 2HThe TSI Long/Short for BTC 2H strategy is an advanced trend-following system designed specifically for trading Bitcoin (BTC) on a 2-hour timeframe. It leverages the True Strength Index (TSI) to identify momentum shifts and executes both long and short trades in response to dynamic market conditions.
Unlike traditional moving average-based strategies, this script uses a double-smoothed momentum calculation, enhancing signal accuracy and reducing noise. It incorporates automated position sizing, customizable leverage, and real-time performance tracking, ensuring a structured and adaptable trading approach.
🔹 What Makes This Strategy Unique?
Unlike simple crossover strategies or generic trend-following approaches, this system utilizes a customized True Strength Index (TSI) methodology that dynamically adjusts to market conditions.
🔸 True Strength Index (TSI) Filtering – The script refines the TSI by applying double exponential smoothing, filtering out weak signals and capturing high-confidence momentum shifts.
🔸 Adaptive Entry & Exit Logic – Instead of fixed thresholds, it compares the TSI value against a dynamically determined high/low range from the past 100 bars to confirm trade signals.
🔸 Leverage & Risk Optimization – Position sizing is dynamically adjusted based on account equity and leverage settings, ensuring controlled risk exposure.
🔸 Performance Monitoring System – A built-in performance tracking table allows traders to evaluate monthly and yearly results directly on the chart.
📊 Core Strategy Components
1️⃣ Momentum-Based Trade Execution
The strategy generates long and short trade signals based on the following conditions:
✅ Long Entry Condition – A buy signal is triggered when the TSI crosses above its 100-bar highest value (previously set), confirming bullish momentum.
✅ Short Entry Condition – A sell signal is generated when the TSI crosses below its 100-bar lowest value (previously set), indicating bearish pressure.
Each trade execution is fully automated, reducing emotional decision-making and improving trading discipline.
2️⃣ Position Sizing & Leverage Control
Risk management is a key focus of this strategy:
🔹 Dynamic Position Sizing – The script calculates position size based on:
Account Equity – Ensuring trade sizes adjust dynamically with capital fluctuations.
Leverage Multiplier – Allows traders to customize risk exposure via an adjustable leverage setting.
🔹 No Fixed Stop-Loss – The strategy relies on reversals to exit trades, meaning each position is closed when the opposite signal appears.
This design ensures maximum capital efficiency while adapting to market conditions in real time.
3️⃣ Performance Visualization & Tracking
Understanding historical performance is crucial for refining strategies. The script includes:
📌 Real-Time Trade Markers – Buy and sell signals are visually displayed on the chart for easy reference.
📌 Performance Metrics Table – Tracks monthly and yearly returns in percentage form, helping traders assess profitability over time.
📌 Trade History Visualization – Completed trades are displayed with color-coded boxes (green for long trades, red for short trades), visually representing profit/loss dynamics.
📢 Why Use This Strategy?
✔ Advanced Momentum Detection – Uses a double-smoothed TSI for more accurate trend signals.
✔ Fully Automated Trading – Removes emotional bias and enforces discipline.
✔ Customizable Risk Management – Adjust leverage and position sizing to suit your risk profile.
✔ Comprehensive Performance Tracking – Integrated reporting system provides clear insights into past trades.
This strategy is ideal for Bitcoin traders looking for a structured, high-probability system that adapts to both bullish and bearish trends on the 2-hour timeframe.
📌 How to Use: Simply add the script to your 2H BTC chart, configure your leverage settings, and let the system handle trade execution and tracking! 🚀

TSI + DivergencesTrue Strength Indicator (TSI) + Divergences + Alerts + Lookback periods.
This version of the True Strength Indicator adds the following 3 additional features to the stock TSI by Tradingview:
- Optional divergence lines drawn directly onto the oscillator.
- Configurable alerts to notify you when divergences occur.
- Configurable lookback periods to fine tune the divergences drawn in order to suit different trading styles and timeframes.
This indicator adds additional features onto the stock TSI by Tradingview, whose core calculations remain unchanged. Namely the configurable option to automatically, quickly and clearly draw divergence lines onto the oscillator for you as they occur, with minimal delay. It also has the addition of unique alerts, so you can be notified when divergences occur without spending all day watching the charts. Furthermore, this version of the TSI comes with configurable lookback periods, which can be configured in order to adjust the sensitivity of the divergences, in order to suit shorter or higher timeframe trading approaches.
The True Strength Indicator
Tradingview describes the True Strength Indicator as follows:
“The True Strength Index (TSI) is a momentum oscillator that ranges between limits of -100 and +100 and has a base value of 0. Momentum is positive when the oscillator is positive (pointing to a bullish market bias) and vice versa. It was developed by William Blau and consists of 2 lines: the index line and an exponential moving average of the TSI, called the signal line. Traders may look for any of the following 5 types of conditions: overbought, oversold, centerline crossover, divergence and signal line crossover. The indicator is often used in combination with other signals..”
What are divergences?
Divergence is when the price of an asset is moving in the opposite direction of a technical indicator, such as an oscillator, or is moving contrary to other data. Divergence warns that the current price trend may be weakening, and in some cases may lead to the price changing direction.
There are 4 main types of divergence, which are split into 2 categories;
regular divergences and hidden divergences. Regular divergences indicate possible trend reversals, and hidden divergences indicate possible trend continuation.
Regular bullish divergence: An indication of a potential trend reversal, from the current downtrend, to an uptrend.
Regular bearish divergence: An indication of a potential trend reversal, from the current uptrend, to a downtrend.
Hidden bullish divergence: An indication of a potential uptrend continuation.
Hidden bearish divergence: An indication of a potential downtrend continuation.
Setting alerts.
With this indicator you can set alerts to notify you when any/all of the above types of divergences occur, on any chart timeframe you choose.
Configurable lookback values.
You can adjust the default lookback values to suit your prefered trading style and timeframe. If you like to trade a shorter time frame, lowering the default lookback values will make the divergences drawn more sensitive to short term price action.
How do traders use divergences in their trading?
A divergence is considered a leading indicator in technical analysis, meaning it has the ability to indicate a potential price move in the short term future.
Hidden bullish and hidden bearish divergences, which indicate a potential continuation of the current trend are sometimes considered a good place for traders to begin, since trend continuation occurs more frequently than reversals, or trend changes.
When trading regular bullish divergences and regular bearish divergences, which are indications of a trend reversal, the probability of it doing so may increase when these occur at a strong support or resistance level. A common mistake new traders make is to get into a regular divergence trade too early, assuming it will immediately reverse, but these can continue to form for some time before the trend eventually changes, by using forms of support or resistance as an added confluence, such as when price reaches a moving average, the success rate when trading these patterns may increase.
Typically, traders will manually draw lines across the swing highs and swing lows of both the price chart and the oscillator to see whether they appear to present a divergence, this indicator will draw them for you, quickly and clearly, and can notify you when they occur.
Disclaimer : This script includes code from the stock TSI by Tradingview as well as the RSI divergence indicator.

TSI in Dynamic Zones with Divergence and Pivot PointsTrue Strength Index , or TSI is considered a "leading indicator" - in contrast to a "lagging indicator" just as Moving Averages it does not show a confirmation what already happened, but it shows what can happen in the future. For example: The chart is climbing while the TSI oscillator is slowly declining, gets weaker and weaker, maybe even prints bearish divergences? That means that a reversal might be occurring soon. Leading indicators are best paired with Stop and Resistance Lines, General Trendlines , Fib Retracements etc. Your chart is approaching a very important Resistance Trendline but the TSI shows a very positive signal? That means there is a high probability that the Resistance is going to be pushed through and becomes Support in the future.
What are those circles?
-These are Divergences. Red for Regular-Bearish. Orange for Hidden-Bearish. Green for Regular-Bullish. Aqua for Hidden-Bullish.
What are those triangles?
- These are Pivots . They show when the TSI oscillator might reverse, this is important to know because many times the price action follows this move.
What are these blue or orange areas?
- Those are dynamic zones. For the analysis of the TSI its important to know if the indicator is in a state of oversold or overbought to filter out ranging price movement. Normally those zones are static, in this version of the TSI oscillator dynamic zones were added to show a dynamic calculation whether the TSI oscillator is oversold, overbought or ranging.
Please keep in mind that this indicator is a tool and not a strategy, do not blindly trade signals, do your own research first! Use this indicator in conjunction with other indicators to get multiple confirmations.

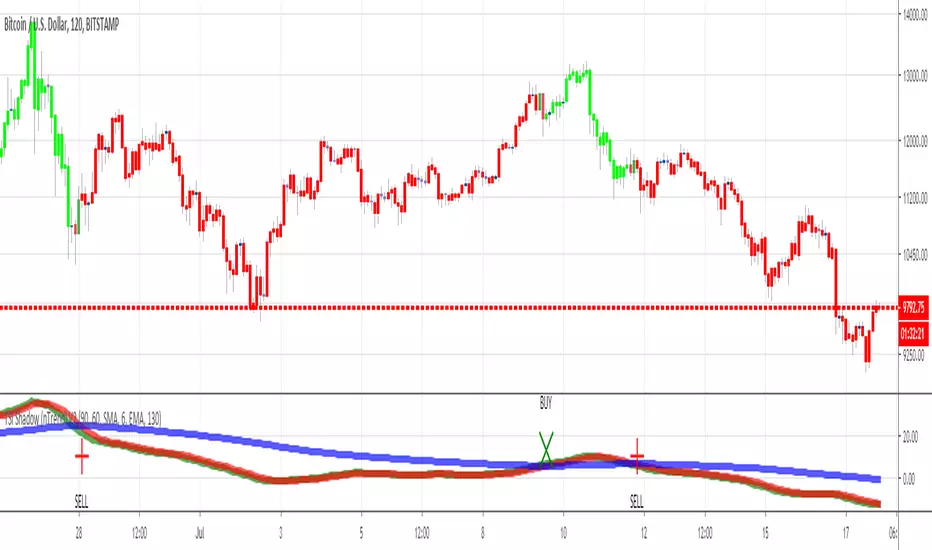
TSI Shadow (with custom candle coloring)Hello traders
This indicator is based on my TSI shadow previously published
This custom version will also color the candles based on the TSI shadow trend
Bullish condition = TSI > MA2 and MA1> MA2
Bearish condition = TSI < MA1 and MA1 < MA2
I made alerts available for this indicator so you can set them on your account
Enjoy
Dave
TSI CCI HullThis is TSI and CCI combined. The CCI is customized and is using HullMA, but the TSI is default TSI
For use with the HMAv420 indicator, to form trading strategy based on the 3 indicators.
Best as all 3 indicators used on 3 timeframes at once, ie 1m 5m 1H

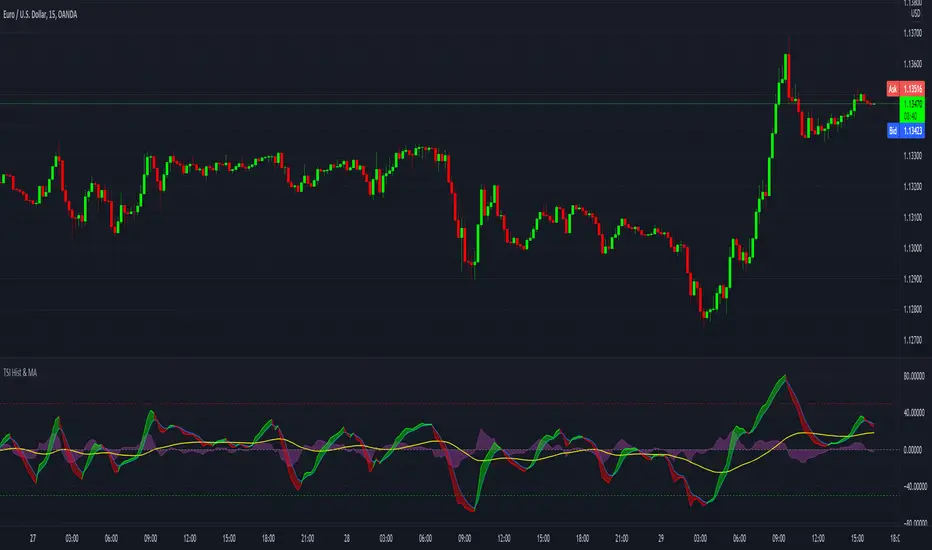
TSI with histogram and MA - SamXThis is an enhanced TSI. The others I've found on here have generally lacked sufficient settings context and/or alert definitions, so I made this version to address those gaps. In addition to that, I also added a way to plot a user-customizable moving average line of the TSI to better help identify trending conditions across TSI swings.
TSI Strength Meter vs USD with divergenceThis indicator consists of two lines. One is a gray line (USD) and the asset indicator is green or red.
The basis of this indicator is the true strength indicator (TSI) with parameters 5,15. Both line sets are based on a TSI (5,15).
The lookback period is for new highs / new lows. Default value is 200 periods.
GREEN/RED LINE
The first that is green and red is whatever you choose to display ( BTC in this case).
The green and red lines indicate going up or going down.
GRAY LINE
The gray line is the US Dollar . So everything is relative to that by default.
ZERO LINE CROSSES
These are momentum shifts. If you see a crossover of both around the zero line, its a good indication there is a change in momentum and a reversal of trend.
NEW HIGHS NEW LOWS
There are 4 new colors added to this indicator. For the asset you are viewing, a lime color means new highs within the lookback period. A new low is indicated by a yellow line color.
The new lows for the USD are white for new lows within the lookback period and blue line for the new highs.
DIVERGENCE
You can also spot divergences easily. For example, if a lime color is seen on the indicator line, that means "new high" but if it occurs below the last "new high" it means the asset is going up to new highs but the indicator is showing us that the readings are below the previous new highs, indicating a negative divergence.
The same goes for the yellow colored lines. higher yellows mean positive divergence.
And with the US Dollar , blue lines dropping means a negative divergence in the US Dollar , while white lines moving up means a positive dollar divergence.
INTERPRETATION
Examples:
If you see a green and sometimes red line of the asset indicator and a gray line that drops below the zero line; it may mean the asset is rising and the trend is up.
If you see a green and red line below the zero line and with a gray line above the zero line , it indicates there is a negative trend. If you suddenly see blue lines on the USD, this means its hitting new lows. If these blue lines then start to slowly move downwards; then we have a positive divergence. If that were to be followed by the green line crossing the zero line, its a pretty good be that the trend is changing and its a very good buying oportunity.

TSI HMA CCIHi!
This strategy has TSI and CCI indicators with the CCI being based on a HMA instead of the Price.
There is a number of conditions that must combine to create buy or sell signals, but it is basically a couple of MA crossovers.
The strategy opens new orders on each candle if the conditions are met, Either direction, so it is hedging.
It wont open new orders if there is a floating loss, and so is constantly attempting to hold a floating profit (drawup instead of drawdown)
But It has a StopLoss (set by user) for closing of losing orders, and it closes all orders in basket style when account is in profit to users set amount target profit.
Low commission set to simulate swap but Forex pairs generally dont have commission like the crypto exchanges do. So if you use this on cryptos, remember to increase the commission to your brokers amount.
Crypto users will likely find that because this opens so many orders the commission could erase its profits.
So i recommend this for Forex only, and perhaps, only NZDUSD 4H chart. other pairs, change settings for.
The strategy has settings for testing on target time spans, so you could test it on just Jan-Feb 2020 for example, if you want, or from Jan 2020 to present day.
Have Fun! Open Script for copy/paste/edit/publish your own version :)


True Strength Index (TSI)User request. A tuned version of the built-in True Strength Index (TSI) indicator with the following options included:
TSI - Signal Histogram
TSI/Signal Crossovers
TSI/Signal Ribbon
Bands breakouts highlighting
Zero line crossovers background
Altered True Strength Indicator (TSI) Reupload-
Altered TSI provides a slightly more volatile signal that demonstrates extremities in price action with greater success than standard TSI. In addition, I added bull/bear cross indicators (green/red) to make it easier to notice the crosses to save time when the market is moving fast (I couldn't find a regular TSI script with this addition). Finally, the signal also has overextension parameters (red and green lines)
I think this is best used on Intraday time frames as the signals respond to volatility very well and using Heikin Ashi candles, trend is more visual. In this particular example, I am showing SPY on the 3m time chart (my favorite short time frame) and the signal alone provided many opportunities for trades when using simple divergences and countering overextension direction when short term (blue) signal crosses either
In the first example (purple lines), SPY ramps but it was a dull signal given the signal strength flatlining- we would be looking for a short entry. When the signal fires, it provides a clean $1.50 move down in spy.
In the second example (orange), the blue signal provides a nice V shape (rebound signal) in which we are looking for a long entry. 390.50 is a strong SPY support in confluence with 2nd std dev VWAP extension, but disregarding that bull signal fires resulting in a 2 dollar move upwards. Exit is provided when blue line crosses green overextension.
In the third example (white), we are searching for a short entry at 392.5 resistance in confluence with divergently higher highs. Bear cross signal when fired and a significant cross is visible provides a $2.50 move to the downside with a potential exit provided when blue line crosses red overextension line in confluence with previous LOD area.
In the fourth example (green), we watch as the blue line provides a V pattern, we are searching for a long entry. If you didn't take a riskier long at 2nd std dev VWAP overextension with V recovery on blue line at red overextension for a ride to vwap, then you are looking for a secondary entry long as you wouldn't take the trade at resistance (vwap). Bullishly divergent lows provide this entry and the signal does not bear cross at all (but looking for significant crosses is more important even if the signal were to make a minor bear cross). Bullishly divergent double bottom provides a long entry to end of day with a nice clean signal for a $5.00 move until eod or when signal crosses overextension range.
Ideally, close to the money options or SPY/SPXS/SPXL are best used in the intraday time frame.
Again, this is not a standalone indicator but it's best used in conjunction with other indicators/trading strategies
Any questions feel free to comment

GMS: TSI Indicator (ROC)This is based on the original TSI Indicator that's already built in.
The PC is originally taken as the change between the current price - the previous price. I substituted that with Rate of Change. Using a 1 period ROC it's quite similar to the TSI Indicator and increasing the length results in a smoother TSI.
I hope it helps,
Andre
Combo Backtest 123 Reversal & Ergodic TSI This is combo strategies for get a cumulative signal.
First strategy
This System was created from the Book "How I Tripled My Money In The
Futures Market" by Ulf Jensen, Page 183. This is reverse type of strategies.
The strategy buys at market, if close price is higher than the previous close
during 2 days and the meaning of 9-days Stochastic Slow Oscillator is lower than 50.
The strategy sells at market, if close price is lower than the previous close price
during 2 days and the meaning of 9-days Stochastic Fast Oscillator is higher than 50.
Second strategy
r - Length of first EMA smoothing of 1 day momentum 4
s - Length of second EMA smoothing of 1 day smoothing 8
u- Length of third EMA smoothing of 1 day momentum 6
Length of EMA signal line 3
Source of Ergotic TSI Close
This is one of the techniques described by William Blau in his book "Momentum,
Direction and Divergence" (1995). If you like to learn more, we advise you to
read this book. His book focuses on three key aspects of trading: momentum,
direction and divergence. Blau, who was an electrical engineer before becoming
a trader, thoroughly examines the relationship between price and momentum in
step-by-step examples. From this grounding, he then looks at the deficiencies
in other oscillators and introduces some innovative techniques, including a
fresh twist on Stochastics. On directional issues, he analyzes the intricacies
of ADX and offers a unique approach to help define trending and non-trending periods.
WARNING:
- For purpose educate only
- This script to change bars colors.

Combo Strategy 123 Reversal & Ergodic TSI This is combo strategies for get a cumulative signal.
First strategy
This System was created from the Book "How I Tripled My Money In The
Futures Market" by Ulf Jensen, Page 183. This is reverse type of strategies.
The strategy buys at market, if close price is higher than the previous close
during 2 days and the meaning of 9-days Stochastic Slow Oscillator is lower than 50.
The strategy sells at market, if close price is lower than the previous close price
during 2 days and the meaning of 9-days Stochastic Fast Oscillator is higher than 50.
Second strategy
r - Length of first EMA smoothing of 1 day momentum 4
s - Length of second EMA smoothing of 1 day smoothing 8
u- Length of third EMA smoothing of 1 day momentum 6
Length of EMA signal line 3
Source of Ergotic TSI Close
This is one of the techniques described by William Blau in his book "Momentum,
Direction and Divergence" (1995). If you like to learn more, we advise you to
read this book. His book focuses on three key aspects of trading: momentum,
direction and divergence. Blau, who was an electrical engineer before becoming
a trader, thoroughly examines the relationship between price and momentum in
step-by-step examples. From this grounding, he then looks at the deficiencies
in other oscillators and introduces some innovative techniques, including a
fresh twist on Stochastics. On directional issues, he analyzes the intricacies
of ADX and offers a unique approach to help define trending and non-trending periods.
WARNING:
- For purpose educate only
- This script to change bars colors.

Mirror TSI-MACD by Trader JayI was playing around with the TSI-MACD and surprisingly it works quite well as a mirror.
There are 2 ways this can be used
1. Enter long when Blue line crosses up the Red
2. Exit long when Green line crosses the blue
or
1. Enter long when Blue line crosses up the Red
2. Exit long when Blue line crosses back down below the Red

Ergotic TSI Strategy Backtest r - Length of first EMA smoothing of 1 day momentum 4
s - Length of second EMA smoothing of 1 day smoothing 8
u- Length of third EMA smoothing of 1 day momentum 6
Length of EMA signal line 3
Source of Ergotic TSI Close
This is one of the techniques described by William Blau in his book "Momentum,
Direction and Divergence" (1995). If you like to learn more, we advise you to
read this book. His book focuses on three key aspects of trading: momentum,
direction and divergence. Blau, who was an electrical engineer before becoming
a trader, thoroughly examines the relationship between price and momentum in
step-by-step examples. From this grounding, he then looks at the deficiencies
in other oscillators and introduces some innovative techniques, including a
fresh twist on Stochastics. On directional issues, he analyzes the intricacies
of ADX and offers a unique approach to help define trending and non-trending periods.
You can use in the xPrice any series: Open, High, Low, Close, HL2, HLC3, OHLC4 and ect...
You can change long to short in the Input Settings
Please, use it only for learning or paper trading. Do not for real trading.

TSI w SuperTrend decision - Strategy [presentTrading]This strategy aims to improve upon the performance of Traidngview's newly published "Trend Strength Index" indicator by incorporating the SuperTrend for better trade execution and risk management. Enjoy :)
█ Introduction and How it is Different
The "TSI with SuperTrend Decision - Strategy" combines the Trend Strength Index (TSI) with SuperTrend indicators to determine entry and exit points. Unlike traditional strategies that rely solely on one indicator, this method leverages the strengths of both TSI and SuperTrend to provide a more nuanced and adaptive trading strategy.
This dual approach allows for capturing trends more effectively, especially in volatile markets.
BTCUSD 8h LS Performance
█ Strategy, How it Works: Detailed Explanation
🔶 Trend Strength Index (TSI)
The TSI is a momentum oscillator that shows both the direction and strength of a trend. It is calculated by comparing the price movement with the bar index over a specified period. The formula for TSI is as follows:
```
TSI = (PC / |PC|)
where:
PC = Change in price over the period
```
In this strategy, TSI is calculated using the closing prices and a default period of 64 bars. The TSI values help identify overbought and oversold conditions, providing signals for potential market reversals.
🔶 SuperTrend Indicator
The SuperTrend is a trend-following indicator based on the average true range (ATR). It helps in identifying the direction of the market trend. The SuperTrend calculation involves:
```
SuperTrend = HLC3 ± (Factor * ATR)
where:
HLC3 = (High + Low + Close) / 3
Factor = User-defined multiplier
ATR = Average True Range over a period
```
The SuperTrend settings in this strategy include a length of 10 bars and a factor of 3.0.
Last Bull Cycle of BTC
🔶 Entry and Exit Conditions
The strategy uses the TSI and SuperTrend together to determine entry and exit points:
- Long Entry: When the SuperTrend indicates a downward trend (st.d < 0) and the TSI is above the oversold level (-0.241).
- Long Exit: When the SuperTrend indicates an upward trend (st.d > 0) and the TSI is below the overbought level (0.241).
- Short Entry: When the SuperTrend indicates an upward trend (st.d > 0) and the TSI is below the overbought level (0.241).
- Short Exit: When the SuperTrend indicates a downward trend (st.d < 0) and the TSI is above the oversold level (-0.241).
█ Trade Direction
The strategy allows users to select the trade direction through the `tradeDirection` input. The options are:
- Both: Enables both long and short trades.
- Long: Enables only long trades.
- Short: Enables only short trades.
█ Default Settings
- TSI Length: 64
- SuperTrend Length: 10
- SuperTrend Factor: 3.0
- Trade Direction: Both
- Take Profit (%): 30.0
- Stop Loss (%): 20.0
Impact of Default Settings
- TSI Length: A longer TSI period smooths out noise but may lag in identifying trends. A shorter period is more responsive but can generate false signals.
- SuperTrend Length: A shorter length provides quicker signals but can be prone to whipsaws. A longer length is more reliable but may delay entries and exits.
- SuperTrend Factor: A higher factor increases the distance of the SuperTrend from the price, reducing sensitivity to minor price fluctuations.
- Trade Direction: Allows flexibility in trading strategies by enabling both long and short trades based on market conditions.
- Take Profit and Stop Loss: These settings manage risk by automatically closing trades at predefined profit or loss levels. Higher percentages provide larger potential gains but also higher risk.

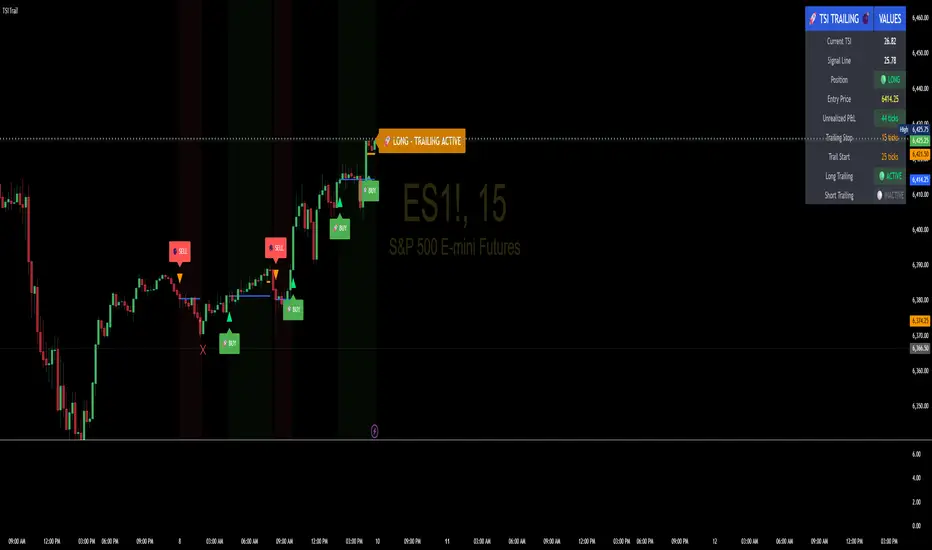
TSI Indicator with Trailing StopAuthor: ProfitGang
Type: Indicator (visual + alerts). No orders are executed.
What it does
This tool combines the True Strength Index (TSI) with a simple tick-based trailing stop visualizer.
It plots buy/sell markers from a TSI cross with momentum confirmation and, if enabled, draws a trailing stop line that “ratchets” in your favor. It also shows a compact info table (position state, entry price, trailing status, and unrealized ticks).
Signal logic (summary)
TSI is computed with double EMA smoothing (user lengths).
Signals:
Buy when TSI crosses above its signal line and momentum (TSI–Signal histogram) improves, with TSI above your Buy Threshold.
Sell when TSI crosses below its signal line and momentum weakens, with TSI below your Sell Threshold.
Confirmation: Optional “Confirm on bar close” setting evaluates signals on closed bars to reduce repaint risk.
Trailing stop (visual only)
Units are ticks (uses the symbol’s min tick).
Start Trailing After (ticks): activates the trail only once price has moved in your favor by the set amount.
Trailing Stop (ticks): distance from price once active.
For longs: stop = close - trail; it never moves down.
For shorts: stop = close + trail; it never moves up.
Exits shown on chart when the trailing line is touched or an opposite signal occurs.
Note: This is a simulation for visualization and does not place, manage, or guarantee broker orders.
Inputs you can tune
TSI Settings: Long Length, Short Length, Signal Length, Buy/Sell thresholds, Confirm on Close.
Trailing Stop: Start Trailing After (ticks), Trailing Stop (ticks), Show/Hide trailing lines.
Display: Toggle chart signals, info table, and (optionally) TSI plots on the price chart.
Alerts included
TSI Buy / TSI Sell
Long/Short Trailing Activated
Long/Short Trail Exit
Tips for use
Timeframes/markets: Works on any symbol/timeframe that reports a valid min tick. If your market has large ticks, adjust the tick inputs accordingly.
TSI view: By default, TSI lines are hidden to avoid rescaling the price chart. Enable “Show TSI plots on price chart” if you want to see the oscillator inline.
Non-repainting note: With Confirm on bar close enabled, signals are evaluated on closed bars. Intrabar previews can change until the bar closes—this is expected behavior in TradingView.
Limitations
This is an indicator for education/research. It does not execute trades, and visuals may differ from actual broker fills.
Performance varies by market conditions; thresholds and trail settings should be tested by the user.
Disclaimer
Nothing here is financial advice. Markets involve risk, including possible loss of capital. Always do your own research and test on a demo before using any tool in live trading.
— ProfitGang
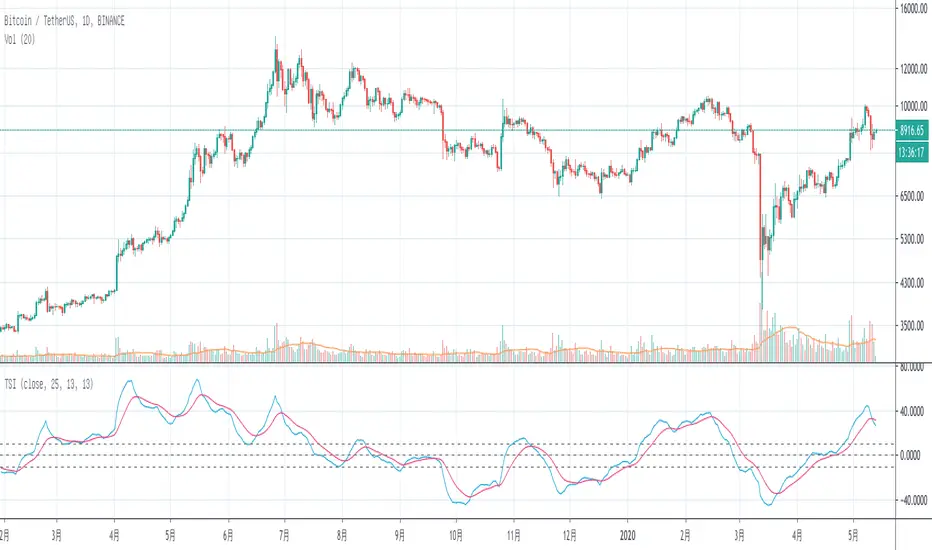
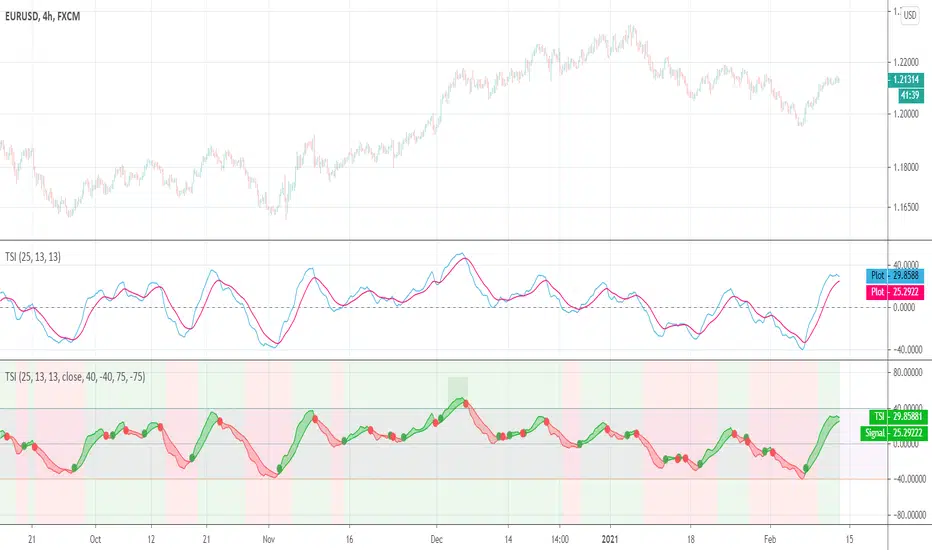
True Strength Indicator MTFHere is an example of a script showing a multi-time frame of TSI.
Chart below compares FX EURUSD Daily TSI to 1H TSI
Here is an updated version
study("True Strength Indicator MTF", shorttitle="TSI MTF")
resCustom = input(title="Timeframe", type=resolution, defval="60" )
long = input(title="Long Length", type=integer, defval=25)
short = input(title="Short Length", type=integer, defval=13)
signal = input(title="Signal Length", type=integer, defval=13)
price = close
double_smooth(src, long, short) =>
fist_smooth = ema(src, long)
ema(fist_smooth, short)
pc = change(price)
double_smoothed_pc = double_smooth(pc, long, short)
double_smoothed_abs_pc = double_smooth(abs(pc), long, short)
tsi_value = 100 * (double_smoothed_pc / double_smoothed_abs_pc)
tsi = security(tickerid, resCustom,tsi_value)
plot(tsi, color=black)
plot(ema(tsi, signal), color=red)
hline(0, title="Zero")

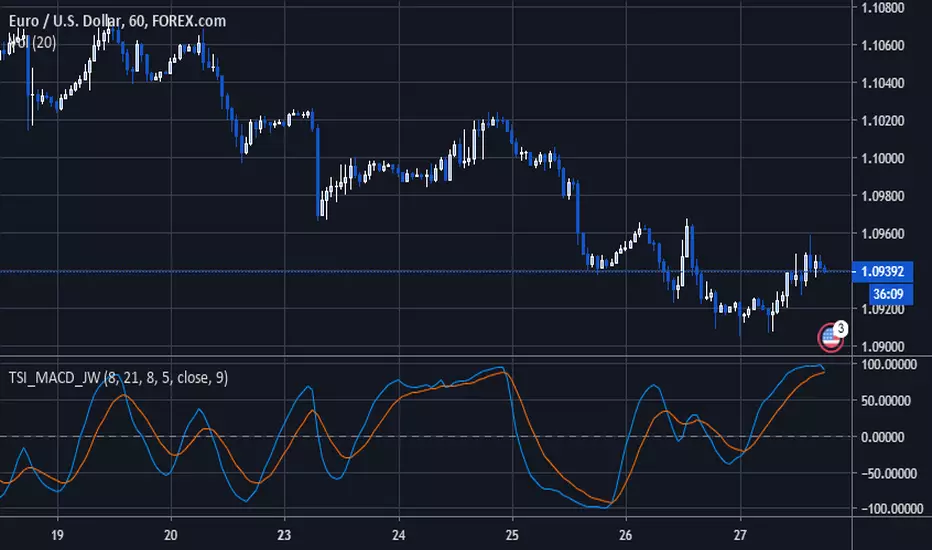
TSI MACD by Jwammo12The TSI MACD indicator is a combination of the TSI (True Strength Index) and MACD (Moving Average Convergence Divergence) technical indicators.
The TSI MACD indicator is a momentum indicator, considering that it comes from two momentum indicators.
Ultimately, the TSI MACD indicator is used to gauge the strength of a trend, as well as its accompanying momentum.
The indicator is shown to oscillate between -110 and +110, while its signal baseline is on the zero level (a level that determines the market bias).