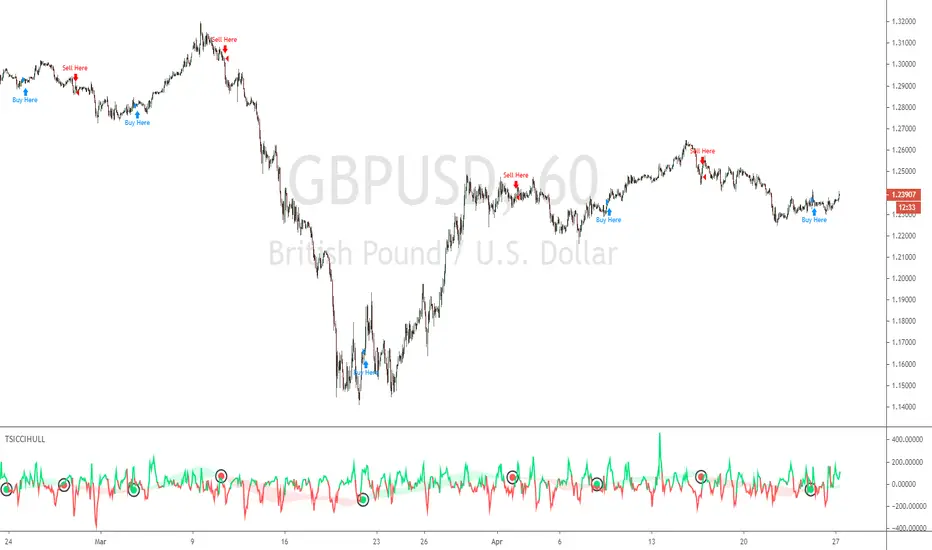
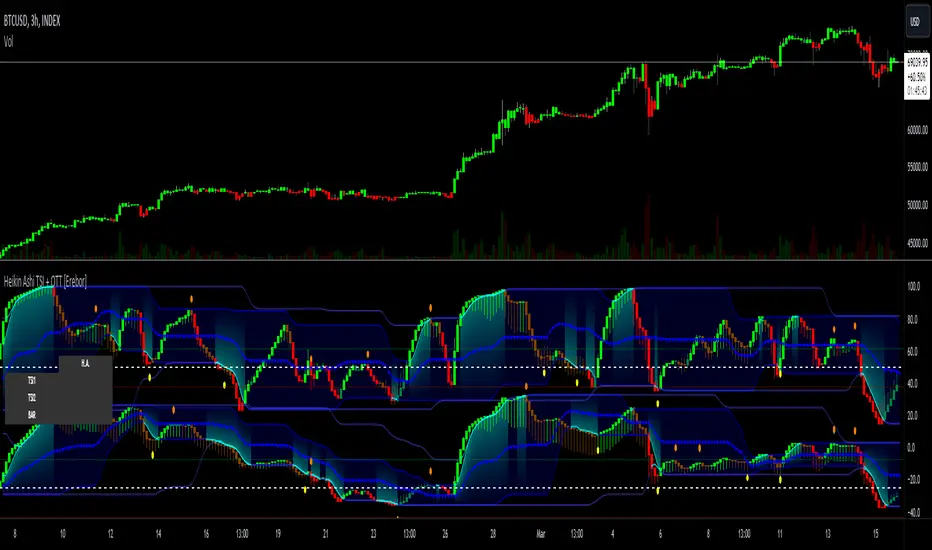
TSI CCI Hull with profit$$$This is a modified version of @SeaSide420 TSI CCI Hull with profits exit on long and short order
ORIGINAL SCRIPT:
/// /// feel free to edit/improve and comment
Cerca negli script per "tsi"
TSI CCI HullThis Strategy is Using TSI and CCI and Hull Moving Average to make swing trades on 1H chart but can be used on any pair and timeframe just change settings to suit (Hull Period mostly)
TSI ShadowHello traders
TSI Shadow based on a custom indicator that I use on FXCM for my INDEX/FOREX trading
Documentation fxcodebase.com/code/viewtopic.php?f=27&t=63453
Enjoy
Dave
TSI-DonchianHere it a TSI with MTF function , together with Donchian high and low channel
the best entry and exit are shown in arrow
TSI/HullMA/VWMA strategychange the settings to make it profitable.. default settings not apply to any instrument in-particular.. dont be afraid to try different settings to find profitable combo of settings on your chosen crypto/FX/stock etc.. to avoid repaint wait for next candle before confirm signal..
Xtrender and TSI FusionXtrender and TSI Fusion Indicator
I created this indicator for myself. I was inspired by the indicators created by Bjorgum, Duyck and QuantTherapy and decided to create multiple indicators that either work well combined with their indicators or something new that applies some of their indicator concepts. I decided to share all of the indicator I have created because I believe in learning and earing together as a community. If you guys have any questions or suggestions write them.
Overview: The Xtrender and TSI Fusion Indicator is a powerful tool designed to help traders analyze market momentum, trends, and potential reversals. By combining Xtrender with the True Strength Index (TSI), this indicator provides a comprehensive view of market dynamics, making it easier to identify trading opportunities.
Image: Timeframe is set to daily
Features:
1.Xtrender Analysis:
Short-Term Xtrender: Visualizes short-term momentum using RSI-based calculations on EMA differences. This helps in identifying immediate market trends and pullbacks.
Image above: showcases Short-Term Xtrender
Xtrender T3: A smoothed version of the Xtrender that reduces noise and highlights significant trend changes.
Image above: showcases Xtrender T3 with Xtrender T3 color
2.TSI (True Strength Index):
TSI Value: Measures momentum by comparing price changes over two time periods, offering a clear view of trend strength.
TSI Signal Line: A smoothed version of the TSI value, used to generate buy and sell signals when crossed by the TSI.
Image: showcases TSI Value with TSI Signal Line
TSI Histogram: Shows the difference between the TSI and its signal line, highlighting potential reversals and trend continuations.
Image: showcases TSI Histogram
3.Color Coding and Visual Cues:
Trend Colors: The indicator uses dynamic colors to represent bullish or bearish conditions, making it easy to interpret market sentiment.
Background Color : The background changes color based on TSI signals, further aiding in visual trend analysis.
Image: showcases Background color and Zero line
How to Use
1.Xtrender Analysis:
Short-Term Xtrender: The short-term Xtrender is plotted as columns, changing color based on its direction and value. Green or lime indicates positive momentum, while red or maroon indicates negative momentum.
Xtrender T3: The Xtrender T3 line (black) represents a smoothed version of the short-term Xtrender, providing a clearer picture of the overall trend. The color of this line changes based on the Xtrender's value, helping you spot potential trend changes.
2.TSI (True Strength Index):
TSI Value and Signal Line: The TSI value is plotted as a line, with its color changing based on its relationship to the signal line. A crossover of the TSI above the signal line suggests a potential bullish move, while a crossover below indicates a bearish trend.
TSI Histogram: The histogram represents the difference between the TSI and its signal line. Positive values indicate bullish momentum, while negative values suggest bearish momentum.
3.Background Color:
The background color changes based on the TSI signal, with a greenish hue indicating bullish conditions and a reddish hue indicating bearish conditions. This provides a quick visual reference for market sentiment.
4.Zero Line:
A horizontal gray dotted line at the zero level helps you easily identify when the Xtrender or TSI crosses into positive or negative territory, signaling potential trend shifts.
Image above: Timeframe on daily with the individual elements combined
Example of Use:
•Trend Confirmation: Use the Xtrender and Xtrender T3 to confirm the direction of the trend. If both are aligned with the same color and direction, it increases the probability of a strong trend.
•Momentum Reversals: Watch for TSI crosses and histogram shifts to identify potential reversals. For example, a TSI crossover above its signal line with a corresponding change in the histogram from negative to positive could signal a buying opportunity.
•Pullbacks: Identify pullbacks within a trend by observing temporary shifts in the short-term Xtrender or TSI histogram. Use these signals to enter trades in the direction of the overall trend.
Image above: Showcases, Trend confirmation, reversal and pullbacks on daily timeframe.
Customization:
•TSI Speed: Choose between "Fast" and "Slow" TSI settings based on your trading style. Fast settings are more responsive to price changes, while slow settings offer smoother signals.
•Color Settings: Customize the colors for bullish, bearish, and neutral TSI conditions to match your personal preferences or chart theme.
This indicator is versatile and can be used for various trading strategies, from trend following to momentum trading, making it a valuable tool in any trader's arsenal.
My Scripts/Indicators/Ideas /Systems that I share are only for educational purposes
Smart Money Index + True Strength IndexThe Smart Money Index + True Strength Index indicator is a combination of two popular technical analysis indicators: the Smart Money Index (SMI) and the True Strength Index (TSI). This combined indicator helps traders identify potential entry points for long and short positions based on signals from both indexes.
Main Components:
Smart Money Index (SMI):
The SMI measures the difference between the closing and opening price of a candle multiplied by the trading volume over a certain period of time. This allows you to assess the activity of large players ("smart money") in the market. If the SMI value is above a certain threshold (smiThreshold), it may indicate a bullish trend, and if lower, it may indicate a bearish trend.
True Strength Index (TSI):
The TSI is an oscillator that measures the strength of a trend by comparing the price change of the current bar with the previous bar. It uses two exponential moving averages (EMAS) to smooth the data. TSI values can fluctuate around zero, with values above the overbought level indicating a possible downward correction, and values below the oversold level signaling a possible upward correction.
Parameters:
SMI Length: Defines the number of candles used to calculate the average SMI value. The default value is 14.
SMI Threshold: A threshold value that is used to determine a buy or sell signal. The default value is 0.
Length of the first TSI smoothing (tsiLength1): The length of the first EMA for calculating TSI. The default value is 25.
Second TSI smoothing length (tsiLength2): The length of the second EMA for additional smoothing of TSI values. The default value is 13.
TSI Overbought level: The level at which the market is considered to be overbought. The default value is 25.
Oversold level TSI: The level at which it is considered that the market is in an oversold state. The default value is -25.
Logic of operation:
SMI calculation:
First, the difference between the closing and opening price of each candle (close - open) is calculated.
This difference is then multiplied by the trading volume.
The resulting product is averaged using a simple moving average (SMA) over a specified period (smiLength).
Calculation of TSI:
The price change relative to the previous bar is calculated (close - close ).
The first EMA with the length tsiLength1 is applied.
Next, a second EMA with a length of tsiLength2 is applied to obtain the final TSI value.
The absolute value of price changes is calculated in the same way, and two emas are also applied.
The final TSI index is calculated as the ratio of these two values multiplied by 100.
Graphical representation:
The SMI and TSI lines are plotted on the graph along with their respective thresholds.
For SMI, the line is drawn in orange, and the threshold level is dotted in gray.
For the TSI, the line is plotted in blue, the overbought and oversold levels are indicated by red and green dotted lines, respectively.
Conditions for buy/sell signals:
A buy (long) signal is generated when:
SMI is greater than the threshold (smi > smiThreshold)
TSI crosses the oversold level from bottom to top (ta.crossover(tsi, oversold)).
A sell (short) signal is generated when:
SMI is less than the threshold (smi < smiThreshold)
TSI crosses the overbought level from top to bottom (ta.crossunder(tsi, overbought)).
Signal display:
When the conditions for a long or short are met, labels labeled "LONG" or "SHORT" appear on the chart.
The label for the long is located under the candle and is colored green, and for the short it is above the candle and is colored red.
Notification generation:
The indicator also supports notifications via the TradingView platform. Notifications are sent when conditions arise for a long or short position.
This combined indicator provides the trader with the opportunity to use both SMI and TSI signals simultaneously, which can improve the accuracy of trading decisions.
Heikin Ashi TSI and OTT [Erebor]TSI (True Strength Index)
The TSI (True Strength Index) is a momentum-based trading indicator used to identify trend direction, overbought/oversold conditions, and potential trend reversals in financial markets. It was developed by William Blau and first introduced in 1991.
Here's how the TSI indicator is calculated:
• Double Smoothed Momentum (DM): This is calculated by applying double smoothing to the price momentum. First, the single smoothed momentum is calculated by subtracting the smoothed closing price from the current closing price. Then, this single smoothed momentum is smoothed again using an additional smoothing period.
• Absolute Smoothed Momentum (ASM): This is calculated by applying smoothing to the absolute value of the price momentum. Similar to DM, ASM applies a smoothing period to the absolute value of the difference between the current closing price and the smoothed closing price.
• TSI Calculation: The TSI is calculated as the ratio of DM to ASM, multiplied by 100 to express it as a percentage. Mathematically, TSI = (DM / ASM) * 100.
The TSI indicator oscillates around a centerline (typically at zero), with positive values indicating bullish momentum and negative values indicating bearish momentum. Traders often look for crossovers of the TSI above or below the centerline to identify shifts in momentum and potential trend reversals. Additionally, divergences between price and the TSI can signal weakening trends and potential reversal points.
Pros of the TSI indicator:
• Smoothed Momentum: The TSI uses double smoothing techniques, which helps to reduce noise and generate smoother signals compared to other momentum indicators.
• Versatility: The TSI can be applied to various financial instruments and timeframes, making it suitable for both short-term and long-term trading strategies.
• Trend Identification: The TSI is effective in identifying the direction and strength of market trends, helping traders to align their positions with the prevailing market sentiment.
Cons of the TSI indicator:
• Lagging Indicator: Like many momentum indicators, the TSI is a lagging indicator, meaning it may not provide timely signals for entering or exiting trades during rapidly changing market conditions.
• False Signals: Despite its smoothing techniques, the TSI can still produce false signals, especially during periods of low volatility or ranging markets.
• Subjectivity: Interpretation of the TSI signals may vary among traders, leading to subjective analysis and potential inconsistencies in trading decisions.
Overall, the TSI indicator can be a valuable tool for traders when used in conjunction with other technical analysis tools and risk management strategies. It can help traders identify potential trading opportunities and confirm trends, but it's essential to consider its limitations and incorporate additional analysis for more robust trading decisions.
Heikin Ashi Candles
Let's consider a modification to the traditional “Heikin Ashi Candles” where we introduce a new parameter: the period of calculation. The traditional HA candles are derived from the open , high low , and close prices of the underlying asset.
Now, let's introduce a new parameter, period, which will determine how many periods are considered in the calculation of the HA candles. This period parameter will affect the smoothing and responsiveness of the resulting candles.
In this modification, instead of considering just the current period, we're averaging or aggregating the prices over a specified number of periods . This will result in candles that reflect a longer-term trend or sentiment, depending on the chosen period value.
For example, if period is set to 1, it would essentially be the same as traditional Heikin Ashi candles. However, if period is set to a higher value, say 5, each candle will represent the average price movement over the last 5 periods, providing a smoother representation of the trend but potentially with delayed signals compared to lower period values.
Traders can adjust the period parameter based on their trading style, the timeframe they're analyzing, and the level of smoothing or responsiveness they prefer in their candlestick patterns.
Optimized Trend Tracker
The "Optimized Trend Tracker" is a proprietary trading indicator developed by TradingView user ANIL ÖZEKŞİ. It is designed to identify and track trends in financial markets efficiently. The indicator attempts to smooth out price fluctuations and provide clear signals for trend direction.
The Optimized Trend Tracker uses a combination of moving averages and adaptive filters to detect trends. It aims to reduce lag and noise typically associated with traditional moving averages, thereby providing more timely and accurate signals.
Some of the key features and applications of the OTT include:
• Trend Identification: The indicator helps traders identify the direction of the prevailing trend in a market. It distinguishes between uptrends, downtrends, and sideways consolidations.
• Entry and Exit Signals: The OTT generates buy and sell signals based on crossovers and direction changes of the trend. Traders can use these signals to time their entries and exits in the market.
• Trend Strength: It also provides insights into the strength of the trend by analyzing the slope and momentum of price movements. This information can help traders assess the conviction behind the trend and adjust their trading strategies accordingly.
• Filter Noise: By employing adaptive filters, the indicator aims to filter out market noise and false signals, thereby enhancing the reliability of trend identification.
• Customization: Traders can customize the parameters of the OTT to suit their specific trading preferences and market conditions. This flexibility allows for adaptation to different timeframes and asset classes.
Overall, the OTT can be a valuable tool for traders seeking to capitalize on trending market conditions while minimizing false signals and noise. However, like any trading indicator, it is essential to combine its signals with other forms of analysis and risk management strategies for optimal results. Additionally, traders should thoroughly back-test the indicator and practice using it in a demo environment before applying it to live trading.
The following types of moving average have been included: "SMA", "EMA", "SMMA (RMA)", "WMA", "VWMA", "HMA", "KAMA", "LSMA", "TRAMA", "VAR", "DEMA", "ZLEMA", "TSF", "WWMA". Thanks to the authors.
Thank you for your indicator “Optimized Trend Tracker”. © kivancozbilgic
Thank you for your programming language, indicators and strategies. © TradingView
Kind regards.
© Erebor_GIT
Fib TSIFib TSI = Fibonacci True Strength Index
The Fib TSI indicator uses Fibonacci numbers input for the True Strength Index moving averages. Then it is converted into a stochastic 0-100 scale.
The Fibonacci sequence is the series of numbers where each number is the sum of the two preceding numbers. 1, 2, 3, 5, 8, 13, 21, 34, 55, 89, 144, 233, 377, 610...
TSI uses moving averages of the underlying momentum of a financial instrument.
Stochastic is calculated by a formula of high and low over a length of time on a scale of 0-100.
How to use Fib TSI:
100 = overbought
0 = oversold
Rising = bullish
Falling = bearish
crossover 50 = bullish
crossunder 50 = bearish
The default input settings are:
2 = Stoch D smoothing
3 = TSI signal
TSI uses 2 moving averages compared with each other.
5 = TSI fastest
TSI uses 2 moving averages compared with each other.
Default value is 3/5.
color = white
8 = TSI fast
TSI uses 2 moving averages compared with each other.
Default value is 5/8.
color = blue
13 = TSI mid
TSI uses 2 moving averages compared with each other.
Default value is 8/13.
color = orange
21 = TSI slow
TSI uses 2 moving averages compared with each other.
Default value is 13/21.
color = purple
34 = TSI slowest
TSI uses 2 moving averages compared with each other.
Default value is 21/34.
color = yellow
55 = Stoch K length
All total / 5 = All TSI
color rising above 50 = bright green
color falling above 50 = mint green
color falling below 50 = bright red
color rising below 50 = pink
Up bullish reversal = green arrow up
bullish trend = green dots
Down bearish reversal = red arrow down
bearish trend = red dots
Horizontal lines:
100
75
50
25
0
2 different visual options example snapshot:
Trend Stability Index (TSI)Overview
The Trend Stability Index (TSI) is a technical analysis tool designed to evaluate the stability of a market trend by analyzing both price movements and trading volume. By combining these two crucial elements, the TSI provides traders with insights into the strength and reliability of ongoing trends, assisting in making informed trading decisions.
Key Features
• Dual Analysis: Integrates price changes and volume fluctuations to assess trend stability.
• Customizable Periods: Allows users to set evaluation periods for both trend and volume based on their trading preferences.
• Visual Indicators: Displays the Trend Stability Index as a line chart, highlights neutral zones, and uses background colors to indicate trend stability or instability.
Configuration Settings
1. Trend Length (trendLength)
• Description: Determines the number of periods over which the price stability is evaluated.
• Default Value: 15
• Usage: A longer trend length smooths out short-term volatility, providing a clearer picture of the overarching trend.
2. Volume Length (volumeLength)
• Description: Sets the number of periods over which trading volume changes are assessed.
• Default Value: 15
• Usage: Adjusting the volume length helps in capturing significant volume movements that may influence trend strength.
Calculation Methodology
The Trend Stability Index is calculated through a series of steps that analyze both price and volume changes:
1. Price Change Rate (priceChange)
• Calculation: Utilizes the Rate of Change (ROC) function on the closing prices over the specified trendLength.
• Purpose: Measures the percentage change in price over the trend evaluation period, indicating the direction and momentum of the price movement.
2. Volume Change Rate (volumeChange)
• Calculation: Applies the Rate of Change (ROC) function to the trading volume over the specified volumeLength.
• Purpose: Assesses the percentage change in trading volume, providing insight into the conviction behind price movements.
3. Trend Stability (trendStability)
• Calculation: Multiplies priceChange by volumeChange.
• Purpose: Combines price and volume changes to gauge the overall stability of the trend. A higher positive value suggests a strong and stable trend, while negative values may indicate trend weakness or reversal.
4. Trend Stability Index (TSI)
• Calculation: Applies a Simple Moving Average (SMA) to the trendStability over the trendLength period.
• Purpose: Smooths the trend stability data to create a more consistent and interpretable index.
Trend/Ranging Determination
• Stable Trend (isStable)
• Condition: When the TSI value is greater than 0.
• Interpretation: Indicates that the current trend is stable and likely to continue in its direction.
• Unstable Trend / Range-bound Market
• Condition: When the TSI value is less than or equal to 0.
• Interpretation: Suggests that the trend may be weakening, reversing, or that the market is moving sideways without a clear direction.
Visualization
The TSI indicator employs several visual elements to convey information effectively:
1. TSI Line
• Representation: Plotted as a blue line.
• Purpose: Displays the Trend Stability Index values over time, allowing traders to observe trend stability dynamics.
2. Neutral Horizontal Line
• Representation: A gray horizontal line at the 0 level.
• Purpose: Serves as a reference point to distinguish between stable and unstable trends.
3. Background Color
• Stable Trend: Green background with 80% transparency when isStable is true.
• Unstable Trend: Red background with 80% transparency when isStable is false.
• Purpose: Provides an immediate visual cue about the current trend’s stability, enhancing the interpretability of the indicator.
Usage Guidelines
• Identifying Trend Strength: Utilize the TSI to confirm the strength of existing trends. A consistently positive TSI suggests strong trend momentum, while a negative TSI may signal caution or a potential reversal.
• Volume Confirmation: The integration of volume changes helps in validating price movements. Significant price changes accompanied by corresponding volume shifts can reinforce the reliability of the trend.
• Entry and Exit Signals: Traders can use crossovers of the TSI with the neutral line (0 level) as potential entry or exit points. For instance, a crossover from below to above 0 may indicate a bullish trend initiation, while a crossover from above to below 0 could suggest bearish momentum.
• Combining with Other Indicators: To enhance trading strategies, consider using the TSI in conjunction with other technical indicators such as Moving Averages, RSI, or MACD for comprehensive market analysis.
Example Scenario
Imagine analyzing a stock with the following observations using the TSI:
• The TSI has been consistently above 0 for the past 30 periods, accompanied by increasing trading volume. This scenario indicates a strong and stable uptrend, suggesting that buying opportunities may be favorable.
• Conversely, if the TSI drops below 0 while the price remains relatively flat and volume decreases, it may imply that the current trend is losing momentum, and the market could be entering a consolidation phase or preparing for a trend reversal.
Conclusion
The Trend Stability Index is a valuable tool for traders seeking to assess the reliability and strength of market trends by integrating price and volume dynamics. Its customizable settings and clear visual indicators make it adaptable to various trading styles and market conditions. By incorporating the TSI into your trading analysis, you can enhance your ability to identify and act upon stable and profitable trends.
Multi SMI Ergodic OscillatorThe Multi SMI Ergodic Oscillator (Multi SMIEO) indicator can be used to identify potential buy and sell signals based on the relationship between the TSI and EMA lines.
The script is creating an indicator that plots multiple (3) sets of Time Series Indicator (TSI-Indicator) and Exponential Moving Average (EMA-Signal) lines as a single indicator.
The TSI is a momentum oscillator that helps identify overbought and oversold conditions. It is calculated using the close prices of an asset, a short-term moving average, and a long-term moving average. The script uses three different pairs of input values for the short-term and long-term periods, which can be adjusted by the user.
The EMA is a type of moving average that gives more weight to recent prices. It is calculated by applying a weighting factor to the most recent price, and then adding that weighted value to the previous EMA value. The script uses three different input values for the length of the EMA, which can also be adjusted by the user.
After calculating the TSI and EMA for each set, the script plots them on the same graph, with different colors and widths to differentiate them. The three sets of TSI and EMA lines are plotted to allow the user to compare the results of different periods. The script also plots a horizontal line at zero, which is used as a reference point for the oscillations of the indicator lines.
One way to use this indicator is to look for crossovers between the TSI and the EMA lines. A bullish crossover occurs when the TSI crosses above the EMA. This suggests that the buying pressure is increasing and a potential buy signal is generated. A bearish crossover occurs when the TSI crosses below the EMA. This suggests that the selling pressure is increasing and a potential sell signal is generated.
Some other ways that the indicator can be used include:
1. Identifying trends: The TSI and EMA lines can be used to identify the direction of the trend. An uptrend is present when the TSI and EMA lines are both trending upwards, while a downtrend is present when the TSI and EMA lines are both trending downwards.
2. Overbought and oversold conditions: The TSI can be used to identify overbought and oversold conditions. When the TSI is above the upper limit of the range, the asset is considered overbought and may be due for a price correction. Conversely, when the TSI is below the lower limit of the range, the asset is considered oversold and may be due for a price rebound.
3. Confirming price action: The Multi SMIEO indicator can be used to confirm price action. If a bullish divergence is present, it confirms a potential bullish reversal. If a bearish divergence is present, it confirms a potential bearish reversal.
4. Multiple time frame analysis: By using different periods for the TSI and EMA lines, the indicator can be used to analyze the asset on multiple time frames. It can be useful to compare the results of different periods to get a better understanding of the asset's price movements.
5. Risk management: This indicator can be used as an element of risk management strategy, it can help traders to identify overbought and oversold conditions to set stop loss or take profit levels.
The Multi SMI Ergodic Oscillator (Multi SMIEO) is a versatile indicator that can be used in a number of ways to analyze the price movements of an asset. It can be used to identify potential buy and sell signals, trends, overbought and oversold conditions, and to confirm price action. By using different periods for the TSI and EMA lines, the indicator can also be used to analyze the asset on multiple time frames. However, it is important to remember that indicators are based on historical data, and past performance does not guarantee future results.
It is important to use the indicator as part of a comprehensive trading strategy that includes risk management and other analysis techniques, such as fundamental and technical analysis. It is also important to keep in mind that indicators are not a standalone solution for trading, they should be used in conjunction with other market analysis and research techniques to generate better results.
Lastly, it is important to keep in mind that trading in financial markets comes with a certain level of risk and it is crucial to always have a proper risk management plan in place. Never invest more than you can afford to lose.
MomentumIndicatorsLibrary "MomentumIndicators"
This is a library of 'Momentum Indicators', also denominated as oscillators.
The purpose of this library is to organize momentum indicators in just one place, making it easy to access.
In addition, it aims to allow customized versions, not being restricted to just the price value.
An example of this use case is the popular Stochastic RSI.
# Indicators:
1. Relative Strength Index (RSI):
Measures the relative strength of recent price gains to recent price losses of an asset.
2. Rate of Change (ROC):
Measures the percentage change in price of an asset over a specified time period.
3. Stochastic Oscillator (Stoch):
Compares the current price of an asset to its price range over a specified time period.
4. True Strength Index (TSI):
Measures the price change, calculating the ratio of the price change (positive or negative) in relation to the
absolute price change.
The values of both are smoothed twice to reduce noise, and the final result is normalized
in a range between 100 and -100.
5. Stochastic Momentum Index (SMI):
Combination of the True Strength Index with a signal line to help identify turning points in the market.
6. Williams Percent Range (Williams %R):
Compares the current price of an asset to its highest high and lowest low over a specified time period.
7. Commodity Channel Index (CCI):
Measures the relationship between an asset's current price and its moving average.
8. Ultimate Oscillator (UO):
Combines three different time periods to help identify possible reversal points.
9. Moving Average Convergence/Divergence (MACD):
Shows the difference between short-term and long-term exponential moving averages.
10. Fisher Transform (FT):
Normalize prices into a Gaussian normal distribution.
11. Inverse Fisher Transform (IFT):
Transform the values of the Fisher Transform into a smaller and more easily interpretable scale is through the
application of an inverse transformation to the hyperbolic tangent function.
This transformation takes the values of the FT, which range from -infinity to +infinity, to a scale limited
between -1 and +1, allowing them to be more easily visualized and compared.
12. Premier Stochastic Oscillator (PSO):
Normalizes the standard stochastic oscillator by applying a five-period double exponential smoothing average of
the %K value, resulting in a symmetric scale of 1 to -1
# Indicators of indicators:
## Stochastic:
1. Stochastic of RSI (Relative Strengh Index)
2. Stochastic of ROC (Rate of Change)
3. Stochastic of UO (Ultimate Oscillator)
4. Stochastic of TSI (True Strengh Index)
5. Stochastic of Williams R%
6. Stochastic of CCI (Commodity Channel Index).
7. Stochastic of MACD (Moving Average Convergence/Divergence)
8. Stochastic of FT (Fisher Transform)
9. Stochastic of Volume
10. Stochastic of MFI (Money Flow Index)
11. Stochastic of On OBV (Balance Volume)
12. Stochastic of PVI (Positive Volume Index)
13. Stochastic of NVI (Negative Volume Index)
14. Stochastic of PVT (Price-Volume Trend)
15. Stochastic of VO (Volume Oscillator)
16. Stochastic of VROC (Volume Rate of Change)
## Inverse Fisher Transform:
1.Inverse Fisher Transform on RSI (Relative Strengh Index)
2.Inverse Fisher Transform on ROC (Rate of Change)
3.Inverse Fisher Transform on UO (Ultimate Oscillator)
4.Inverse Fisher Transform on Stochastic
5.Inverse Fisher Transform on TSI (True Strength Index)
6.Inverse Fisher Transform on CCI (Commodity Channel Index)
7.Inverse Fisher Transform on Fisher Transform (FT)
8.Inverse Fisher Transform on MACD (Moving Average Convergence/Divergence)
9.Inverse Fisher Transfor on Williams R% (Williams Percent Range)
10.Inverse Fisher Transfor on CMF (Chaikin Money Flow)
11.Inverse Fisher Transform on VO (Volume Oscillator)
12.Inverse Fisher Transform on VROC (Volume Rate of Change)
## Stochastic Momentum Index:
1.Stochastic Momentum Index of RSI (Relative Strength Index)
2.Stochastic Momentum Index of ROC (Rate of Change)
3.Stochastic Momentum Index of VROC (Volume Rate of Change)
4.Stochastic Momentum Index of Williams R% (Williams Percent Range)
5.Stochastic Momentum Index of FT (Fisher Transform)
6.Stochastic Momentum Index of CCI (Commodity Channel Index)
7.Stochastic Momentum Index of UO (Ultimate Oscillator)
8.Stochastic Momentum Index of MACD (Moving Average Convergence/Divergence)
9.Stochastic Momentum Index of Volume
10.Stochastic Momentum Index of MFI (Money Flow Index)
11.Stochastic Momentum Index of CMF (Chaikin Money Flow)
12.Stochastic Momentum Index of On Balance Volume (OBV)
13.Stochastic Momentum Index of Price-Volume Trend (PVT)
14.Stochastic Momentum Index of Volume Oscillator (VO)
15.Stochastic Momentum Index of Positive Volume Index (PVI)
16.Stochastic Momentum Index of Negative Volume Index (NVI)
## Relative Strength Index:
1. RSI for Volume
2. RSI for Moving Average
rsi(source, length)
RSI (Relative Strengh Index). Measures the relative strength of recent price gains to recent price losses of an asset.
Parameters:
source : (float) Source of series (close, high, low, etc.)
length : (int) Period of loopback
Returns: (float) Series of RSI
roc(source, length)
ROC (Rate of Change). Measures the percentage change in price of an asset over a specified time period.
Parameters:
source : (float) Source of series (close, high, low, etc.)
length : (int) Period of loopback
Returns: (float) Series of ROC
stoch(kLength, kSmoothing, dSmoothing, maTypeK, maTypeD, almaOffsetKD, almaSigmaKD, lsmaOffSetKD)
Stochastic Oscillator. Compares the current price of an asset to its price range over a specified time period.
Parameters:
kLength
kSmoothing : (int) Period for smoothig stochastic
dSmoothing : (int) Period for signal (moving average of stochastic)
maTypeK : (int) Type of Moving Average for Stochastic Oscillator
maTypeD : (int) Type of Moving Average for Stochastic Oscillator Signal
almaOffsetKD : (float) Offset for Arnaud Legoux Moving Average for Oscillator and Signal
almaSigmaKD : (float) Sigma for Arnaud Legoux Moving Average for Oscillator and Signal
lsmaOffSetKD : (int) Offset for Least Squares Moving Average for Oscillator and Signal
Returns: A tuple of Stochastic Oscillator and Moving Average of Stochastic Oscillator
stoch(source, kLength, kSmoothing, dSmoothing, maTypeK, maTypeD, almaOffsetKD, almaSigmaKD, lsmaOffSetKD)
Stochastic Oscillator. Customized source. Compares the current price of an asset to its price range over a specified time period.
Parameters:
source : (float) Source of series (close, high, low, etc.)
kLength : (int) Period of loopback to calculate the stochastic
kSmoothing : (int) Period for smoothig stochastic
dSmoothing : (int) Period for signal (moving average of stochastic)
maTypeK : (int) Type of Moving Average for Stochastic Oscillator
maTypeD : (int) Type of Moving Average for Stochastic Oscillator Signal
almaOffsetKD : (float) Offset for Arnaud Legoux Moving Average for Stoch and Signal
almaSigmaKD : (float) Sigma for Arnaud Legoux Moving Average for Stoch and Signal
lsmaOffSetKD : (int) Offset for Least Squares Moving Average for Stoch and Signal
Returns: A tuple of Stochastic Oscillator and Moving Average of Stochastic Oscillator
tsi(source, shortLength, longLength, maType, almaOffset, almaSigma, lsmaOffSet)
TSI (True Strengh Index). Measures the price change, calculating the ratio of the price change (positive or negative) in relation to the absolute price change.
The values of both are smoothed twice to reduce noise, and the final result is normalized in a range between 100 and -100.
Parameters:
source : (float) Source of series (close, high, low, etc.)
shortLength : (int) Short length
longLength : (int) Long length
maType : (int) Type of Moving Average for TSI
almaOffset : (float) Offset for Arnaud Legoux Moving Average
almaSigma : (float) Sigma for Arnaud Legoux Moving Average
lsmaOffSet : (int) Offset for Least Squares Moving Average
Returns: (float) TSI
smi(sourceTSI, shortLengthTSI, longLengthTSI, maTypeTSI, almaOffsetTSI, almaSigmaTSI, lsmaOffSetTSI, maTypeSignal, smoothingLengthSignal, almaOffsetSignal, almaSigmaSignal, lsmaOffSetSignal)
SMI (Stochastic Momentum Index). A TSI (True Strengh Index) plus a signal line.
Parameters:
sourceTSI : (float) Source of series for TSI (close, high, low, etc.)
shortLengthTSI : (int) Short length for TSI
longLengthTSI : (int) Long length for TSI
maTypeTSI : (int) Type of Moving Average for Signal of TSI
almaOffsetTSI : (float) Offset for Arnaud Legoux Moving Average
almaSigmaTSI : (float) Sigma for Arnaud Legoux Moving Average
lsmaOffSetTSI : (int) Offset for Least Squares Moving Average
maTypeSignal
smoothingLengthSignal
almaOffsetSignal
almaSigmaSignal
lsmaOffSetSignal
Returns: A tuple with TSI, signal of TSI and histogram of difference
wpr(source, length)
Williams R% (Williams Percent Range). Compares the current price of an asset to its highest high and lowest low over a specified time period.
Parameters:
source : (float) Source of series (close, high, low, etc.)
length : (int) Period of loopback
Returns: (float) Series of Williams R%
cci(source, length, maType, almaOffset, almaSigma, lsmaOffSet)
CCI (Commodity Channel Index). Measures the relationship between an asset's current price and its moving average.
Parameters:
source : (float) Source of series (close, high, low, etc.)
length : (int) Period of loopback
maType : (int) Type of Moving Average
almaOffset : (float) Offset for Arnaud Legoux Moving Average
almaSigma : (float) Sigma for Arnaud Legoux Moving Average
lsmaOffSet : (int) Offset for Least Squares Moving Average
Returns: (float) Series of CCI
ultimateOscillator(fastLength, middleLength, slowLength)
UO (Ultimate Oscilator). Combines three different time periods to help identify possible reversal points.
Parameters:
fastLength : (int) Fast period of loopback
middleLength : (int) Middle period of loopback
slowLength : (int) Slow period of loopback
Returns: (float) Series of Ultimate Oscilator
ultimateOscillator(source, fastLength, middleLength, slowLength)
UO (Ultimate Oscilator). Customized source. Combines three different time periods to help identify possible reversal points.
Parameters:
source : (float) Source of series (close, high, low, etc.)
fastLength : (int) Fast period of loopback
middleLength : (int) Middle period of loopback
slowLength : (int) Slow period of loopback
Returns: (float) Series of Ultimate Oscilator
macd(source, fastLength, slowLength, signalLength, maTypeFast, maTypeSlow, maTypeMACD, almaOffset, almaSigma, lsmaOffSet)
MACD (Moving Average Convergence/Divergence). Shows the difference between short-term and long-term exponential moving averages.
Parameters:
source : (float) Source of series (close, high, low, etc.)
fastLength : (int) Period for fast moving average
slowLength : (int) Period for slow moving average
signalLength : (int) Signal length
maTypeFast : (int) Type of fast moving average
maTypeSlow : (int) Type of slow moving average
maTypeMACD : (int) Type of MACD moving average
almaOffset : (float) Offset for Arnaud Legoux Moving Average
almaSigma : (float) Sigma for Arnaud Legoux Moving Average
lsmaOffSet : (int) Offset for Least Squares Moving Average
Returns: A tuple with MACD, Signal, and Histgram
fisher(length)
Fisher Transform. Normalize prices into a Gaussian normal distribution.
Parameters:
length
Returns: A tuple with Fisher Transform and signal
fisher(source, length)
Fisher Transform. Customized source. Normalize prices into a Gaussian normal distribution.
Parameters:
source : (float) Source of series (close, high, low, etc.)
length
Returns: A tuple with Fisher Transform and signal
inverseFisher(source, length, subtrahend, denominator)
Inverse Fisher Transform.
Transform the values of the Fisher Transform into a smaller and more easily interpretable scale is
through the application of an inverse transformation to the hyperbolic tangent function.
This transformation takes the values of the FT, which range from -infinity to +infinity,
to a scale limited between -1 and +1, allowing them to be more easily visualized and compared.
Parameters:
source : (float) Source of series (close, high, low, etc.)
length : (int) Period for loopback
subtrahend : (int) Denominator. Useful in unbounded indicators. For example, in CCI.
denominator
Returns: (float) Series of Inverse Fisher Transform
premierStoch(length, smoothlen)
Premier Stochastic Oscillator (PSO).
Normalizes the standard stochastic oscillator by applying a five-period double exponential smoothing
average of the %K value, resulting in a symmetric scale of 1 to -1.
Parameters:
length : (int) Period for loopback
smoothlen : (int) Period for smoothing
Returns: (float) Series of PSO
premierStoch(source, smoothlen, subtrahend, denominator)
Premier Stochastic Oscillator (PSO) of custom source.
Normalizes the source by applying a five-period double exponential smoothing average.
Parameters:
source : (float) Source of series (close, high, low, etc.)
smoothlen : (int) Period for smoothing
subtrahend : (int) Denominator. Useful in unbounded indicators. For example, in CCI.
denominator
Returns: (float) Series of PSO
stochRsi(sourceRSI, lengthRSI, kLength, kSmoothing, dSmoothing, maTypeK, maTypeD, almaOffsetKD, almaSigmaKD, lsmaOffSetKD)
Parameters:
sourceRSI
lengthRSI
kLength
kSmoothing
dSmoothing
maTypeK
maTypeD
almaOffsetKD
almaSigmaKD
lsmaOffSetKD
stochRoc(sourceROC, lengthROC, kLength, kSmoothing, dSmoothing, maTypeK, maTypeD, almaOffsetKD, almaSigmaKD, lsmaOffSetKD)
Parameters:
sourceROC
lengthROC
kLength
kSmoothing
dSmoothing
maTypeK
maTypeD
almaOffsetKD
almaSigmaKD
lsmaOffSetKD
stochUO(fastLength, middleLength, slowLength, kLength, kSmoothing, dSmoothing, maTypeK, maTypeD, almaOffsetKD, almaSigmaKD, lsmaOffSetKD)
Parameters:
fastLength
middleLength
slowLength
kLength
kSmoothing
dSmoothing
maTypeK
maTypeD
almaOffsetKD
almaSigmaKD
lsmaOffSetKD
stochTSI(source, shortLength, longLength, maType, almaOffset, almaSigma, lsmaOffSet, kLength, kSmoothing, dSmoothing, maTypeK, maTypeD, almaOffsetKD, almaSigmaKD, lsmaOffSetKD)
Parameters:
source
shortLength
longLength
maType
almaOffset
almaSigma
lsmaOffSet
kLength
kSmoothing
dSmoothing
maTypeK
maTypeD
almaOffsetKD
almaSigmaKD
lsmaOffSetKD
stochWPR(source, length, kLength, kSmoothing, dSmoothing, maTypeK, maTypeD, almaOffsetKD, almaSigmaKD, lsmaOffSetKD)
Parameters:
source
length
kLength
kSmoothing
dSmoothing
maTypeK
maTypeD
almaOffsetKD
almaSigmaKD
lsmaOffSetKD
stochCCI(source, length, maType, almaOffset, almaSigma, lsmaOffSet, kLength, kSmoothing, dSmoothing, maTypeK, maTypeD, almaOffsetKD, almaSigmaKD, lsmaOffSetKD)
Parameters:
source
length
maType
almaOffset
almaSigma
lsmaOffSet
kLength
kSmoothing
dSmoothing
maTypeK
maTypeD
almaOffsetKD
almaSigmaKD
lsmaOffSetKD
stochMACD(source, fastLength, slowLength, signalLength, maTypeFast, maTypeSlow, maTypeMACD, almaOffset, almaSigma, lsmaOffSet, kLength, kSmoothing, dSmoothing, maTypeK, maTypeD, almaOffsetKD, almaSigmaKD, lsmaOffSetKD)
Parameters:
source
fastLength
slowLength
signalLength
maTypeFast
maTypeSlow
maTypeMACD
almaOffset
almaSigma
lsmaOffSet
kLength
kSmoothing
dSmoothing
maTypeK
maTypeD
almaOffsetKD
almaSigmaKD
lsmaOffSetKD
stochFT(length, kLength, kSmoothing, dSmoothing, maTypeK, maTypeD, almaOffsetKD, almaSigmaKD, lsmaOffSetKD)
Parameters:
length
kLength
kSmoothing
dSmoothing
maTypeK
maTypeD
almaOffsetKD
almaSigmaKD
lsmaOffSetKD
stochVolume(kLength, kSmoothing, dSmoothing, maTypeK, maTypeD, almaOffsetKD, almaSigmaKD, lsmaOffSetKD)
Parameters:
kLength
kSmoothing
dSmoothing
maTypeK
maTypeD
almaOffsetKD
almaSigmaKD
lsmaOffSetKD
stochMFI(source, length, kLength, kSmoothing, dSmoothing, maTypeK, maTypeD, almaOffsetKD, almaSigmaKD, lsmaOffSetKD)
Parameters:
source
length
kLength
kSmoothing
dSmoothing
maTypeK
maTypeD
almaOffsetKD
almaSigmaKD
lsmaOffSetKD
stochOBV(source, kLength, kSmoothing, dSmoothing, maTypeK, maTypeD, almaOffsetKD, almaSigmaKD, lsmaOffSetKD)
Parameters:
source
kLength
kSmoothing
dSmoothing
maTypeK
maTypeD
almaOffsetKD
almaSigmaKD
lsmaOffSetKD
stochPVI(source, kLength, kSmoothing, dSmoothing, maTypeK, maTypeD, almaOffsetKD, almaSigmaKD, lsmaOffSetKD)
Parameters:
source
kLength
kSmoothing
dSmoothing
maTypeK
maTypeD
almaOffsetKD
almaSigmaKD
lsmaOffSetKD
stochNVI(source, kLength, kSmoothing, dSmoothing, maTypeK, maTypeD, almaOffsetKD, almaSigmaKD, lsmaOffSetKD)
Parameters:
source
kLength
kSmoothing
dSmoothing
maTypeK
maTypeD
almaOffsetKD
almaSigmaKD
lsmaOffSetKD
stochPVT(source, kLength, kSmoothing, dSmoothing, maTypeK, maTypeD, almaOffsetKD, almaSigmaKD, lsmaOffSetKD)
Parameters:
source
kLength
kSmoothing
dSmoothing
maTypeK
maTypeD
almaOffsetKD
almaSigmaKD
lsmaOffSetKD
stochVO(shortLen, longLen, maType, almaOffset, almaSigma, lsmaOffSet, kLength, kSmoothing, dSmoothing, maTypeK, maTypeD, almaOffsetKD, almaSigmaKD, lsmaOffSetKD)
Parameters:
shortLen
longLen
maType
almaOffset
almaSigma
lsmaOffSet
kLength
kSmoothing
dSmoothing
maTypeK
maTypeD
almaOffsetKD
almaSigmaKD
lsmaOffSetKD
stochVROC(length, kLength, kSmoothing, dSmoothing, maTypeK, maTypeD, almaOffsetKD, almaSigmaKD, lsmaOffSetKD)
Parameters:
length
kLength
kSmoothing
dSmoothing
maTypeK
maTypeD
almaOffsetKD
almaSigmaKD
lsmaOffSetKD
iftRSI(sourceRSI, lengthRSI, lengthIFT)
Parameters:
sourceRSI
lengthRSI
lengthIFT
iftROC(sourceROC, lengthROC, lengthIFT)
Parameters:
sourceROC
lengthROC
lengthIFT
iftUO(fastLength, middleLength, slowLength, lengthIFT)
Parameters:
fastLength
middleLength
slowLength
lengthIFT
iftStoch(kLength, kSmoothing, dSmoothing, maTypeK, maTypeD, almaOffsetKD, almaSigmaKD, lsmaOffSetKD, lengthIFT)
Parameters:
kLength
kSmoothing
dSmoothing
maTypeK
maTypeD
almaOffsetKD
almaSigmaKD
lsmaOffSetKD
lengthIFT
iftTSI(source, shortLength, longLength, maType, almaOffset, almaSigma, lsmaOffSet, lengthIFT)
Parameters:
source
shortLength
longLength
maType
almaOffset
almaSigma
lsmaOffSet
lengthIFT
iftCCI(source, length, maType, almaOffset, almaSigma, lsmaOffSet, lengthIFT)
Parameters:
source
length
maType
almaOffset
almaSigma
lsmaOffSet
lengthIFT
iftFisher(length, lengthIFT)
Parameters:
length
lengthIFT
iftMACD(source, fastLength, slowLength, signalLength, maTypeFast, maTypeSlow, maTypeMACD, almaOffset, almaSigma, lsmaOffSet, lengthIFT)
Parameters:
source
fastLength
slowLength
signalLength
maTypeFast
maTypeSlow
maTypeMACD
almaOffset
almaSigma
lsmaOffSet
lengthIFT
iftWPR(source, length, lengthIFT)
Parameters:
source
length
lengthIFT
iftMFI(source, length, lengthIFT)
Parameters:
source
length
lengthIFT
iftCMF(length, lengthIFT)
Parameters:
length
lengthIFT
iftVO(shortLen, longLen, maType, almaOffset, almaSigma, lsmaOffSet, lengthIFT)
Parameters:
shortLen
longLen
maType
almaOffset
almaSigma
lsmaOffSet
lengthIFT
iftVROC(length, lengthIFT)
Parameters:
length
lengthIFT
smiRSI(source, length, shortLengthTSI, longLengthTSI, maTypeTSI, almaOffsetTSI, almaSigmaTSI, lsmaOffSetTSI, maTypeSignal, smoothingLengthSignal, almaOffsetSignal, almaSigmaSignal, lsmaOffSetSignal)
Parameters:
source
length
shortLengthTSI
longLengthTSI
maTypeTSI
almaOffsetTSI
almaSigmaTSI
lsmaOffSetTSI
maTypeSignal
smoothingLengthSignal
almaOffsetSignal
almaSigmaSignal
lsmaOffSetSignal
smiROC(source, length, shortLengthTSI, longLengthTSI, maTypeTSI, almaOffsetTSI, almaSigmaTSI, lsmaOffSetTSI, maTypeSignal, smoothingLengthSignal, almaOffsetSignal, almaSigmaSignal, lsmaOffSetSignal)
Parameters:
source
length
shortLengthTSI
longLengthTSI
maTypeTSI
almaOffsetTSI
almaSigmaTSI
lsmaOffSetTSI
maTypeSignal
smoothingLengthSignal
almaOffsetSignal
almaSigmaSignal
lsmaOffSetSignal
smiVROC(length, shortLengthTSI, longLengthTSI, maTypeTSI, almaOffsetTSI, almaSigmaTSI, lsmaOffSetTSI, maTypeSignal, smoothingLengthSignal, almaOffsetSignal, almaSigmaSignal, lsmaOffSetSignal)
Parameters:
length
shortLengthTSI
longLengthTSI
maTypeTSI
almaOffsetTSI
almaSigmaTSI
lsmaOffSetTSI
maTypeSignal
smoothingLengthSignal
almaOffsetSignal
almaSigmaSignal
lsmaOffSetSignal
smiWPR(source, length, shortLengthTSI, longLengthTSI, maTypeTSI, almaOffsetTSI, almaSigmaTSI, lsmaOffSetTSI, maTypeSignal, smoothingLengthSignal, almaOffsetSignal, almaSigmaSignal, lsmaOffSetSignal)
Parameters:
source
length
shortLengthTSI
longLengthTSI
maTypeTSI
almaOffsetTSI
almaSigmaTSI
lsmaOffSetTSI
maTypeSignal
smoothingLengthSignal
almaOffsetSignal
almaSigmaSignal
lsmaOffSetSignal
smiFT(length, shortLengthTSI, longLengthTSI, maTypeTSI, almaOffsetTSI, almaSigmaTSI, lsmaOffSetTSI, maTypeSignal, smoothingLengthSignal, almaOffsetSignal, almaSigmaSignal, lsmaOffSetSignal)
Parameters:
length
shortLengthTSI
longLengthTSI
maTypeTSI
almaOffsetTSI
almaSigmaTSI
lsmaOffSetTSI
maTypeSignal
smoothingLengthSignal
almaOffsetSignal
almaSigmaSignal
lsmaOffSetSignal
smiFT(source, length, shortLengthTSI, longLengthTSI, maTypeTSI, almaOffsetTSI, almaSigmaTSI, lsmaOffSetTSI, maTypeSignal, smoothingLengthSignal, almaOffsetSignal, almaSigmaSignal, lsmaOffSetSignal)
Parameters:
source
length
shortLengthTSI
longLengthTSI
maTypeTSI
almaOffsetTSI
almaSigmaTSI
lsmaOffSetTSI
maTypeSignal
smoothingLengthSignal
almaOffsetSignal
almaSigmaSignal
lsmaOffSetSignal
smiCCI(source, length, maTypeCCI, almaOffsetCCI, almaSigmaCCI, lsmaOffSetCCI, shortLengthTSI, longLengthTSI, maTypeTSI, almaOffsetTSI, almaSigmaTSI, lsmaOffSetTSI, maTypeSignal, smoothingLengthSignal, almaOffsetSignal, almaSigmaSignal, lsmaOffSetSignal)
Parameters:
source
length
maTypeCCI
almaOffsetCCI
almaSigmaCCI
lsmaOffSetCCI
shortLengthTSI
longLengthTSI
maTypeTSI
almaOffsetTSI
almaSigmaTSI
lsmaOffSetTSI
maTypeSignal
smoothingLengthSignal
almaOffsetSignal
almaSigmaSignal
lsmaOffSetSignal
smiUO(fastLength, middleLength, slowLength, shortLengthTSI, longLengthTSI, maTypeTSI, almaOffsetTSI, almaSigmaTSI, lsmaOffSetTSI, maTypeSignal, smoothingLengthSignal, almaOffsetSignal, almaSigmaSignal, lsmaOffSetSignal)
Parameters:
fastLength
middleLength
slowLength
shortLengthTSI
longLengthTSI
maTypeTSI
almaOffsetTSI
almaSigmaTSI
lsmaOffSetTSI
maTypeSignal
smoothingLengthSignal
almaOffsetSignal
almaSigmaSignal
lsmaOffSetSignal
smiMACD(source, fastLength, slowLength, signalLength, maTypeFast, maTypeSlow, maTypeMACD, almaOffset, almaSigma, lsmaOffSet, shortLengthTSI, longLengthTSI, maTypeTSI, almaOffsetTSI, almaSigmaTSI, lsmaOffSetTSI, maTypeSignal, smoothingLengthSignal, almaOffsetSignal, almaSigmaSignal, lsmaOffSetSignal)
Parameters:
source
fastLength
slowLength
signalLength
maTypeFast
maTypeSlow
maTypeMACD
almaOffset
almaSigma
lsmaOffSet
shortLengthTSI
longLengthTSI
maTypeTSI
almaOffsetTSI
almaSigmaTSI
lsmaOffSetTSI
maTypeSignal
smoothingLengthSignal
almaOffsetSignal
almaSigmaSignal
lsmaOffSetSignal
smiVol(shortLengthTSI, longLengthTSI, maTypeTSI, almaOffsetTSI, almaSigmaTSI, lsmaOffSetTSI, maTypeSignal, smoothingLengthSignal, almaOffsetSignal, almaSigmaSignal, lsmaOffSetSignal)
Parameters:
shortLengthTSI
longLengthTSI
maTypeTSI
almaOffsetTSI
almaSigmaTSI
lsmaOffSetTSI
maTypeSignal
smoothingLengthSignal
almaOffsetSignal
almaSigmaSignal
lsmaOffSetSignal
smiMFI(source, length, shortLengthTSI, longLengthTSI, maTypeTSI, almaOffsetTSI, almaSigmaTSI, lsmaOffSetTSI, maTypeSignal, smoothingLengthSignal, almaOffsetSignal, almaSigmaSignal, lsmaOffSetSignal)
Parameters:
source
length
shortLengthTSI
longLengthTSI
maTypeTSI
almaOffsetTSI
almaSigmaTSI
lsmaOffSetTSI
maTypeSignal
smoothingLengthSignal
almaOffsetSignal
almaSigmaSignal
lsmaOffSetSignal
smiCMF(length, shortLengthTSI, longLengthTSI, maTypeTSI, almaOffsetTSI, almaSigmaTSI, lsmaOffSetTSI, maTypeSignal, smoothingLengthSignal, almaOffsetSignal, almaSigmaSignal, lsmaOffSetSignal)
Parameters:
length
shortLengthTSI
longLengthTSI
maTypeTSI
almaOffsetTSI
almaSigmaTSI
lsmaOffSetTSI
maTypeSignal
smoothingLengthSignal
almaOffsetSignal
almaSigmaSignal
lsmaOffSetSignal
smiOBV(source, shortLengthTSI, longLengthTSI, maTypeTSI, almaOffsetTSI, almaSigmaTSI, lsmaOffSetTSI, maTypeSignal, smoothingLengthSignal, almaOffsetSignal, almaSigmaSignal, lsmaOffSetSignal)
Parameters:
source
shortLengthTSI
longLengthTSI
maTypeTSI
almaOffsetTSI
almaSigmaTSI
lsmaOffSetTSI
maTypeSignal
smoothingLengthSignal
almaOffsetSignal
almaSigmaSignal
lsmaOffSetSignal
smiPVT(source, shortLengthTSI, longLengthTSI, maTypeTSI, almaOffsetTSI, almaSigmaTSI, lsmaOffSetTSI, maTypeSignal, smoothingLengthSignal, almaOffsetSignal, almaSigmaSignal, lsmaOffSetSignal)
Parameters:
source
shortLengthTSI
longLengthTSI
maTypeTSI
almaOffsetTSI
almaSigmaTSI
lsmaOffSetTSI
maTypeSignal
smoothingLengthSignal
almaOffsetSignal
almaSigmaSignal
lsmaOffSetSignal
smiVO(shortLen, longLen, maType, almaOffset, almaSigma, lsmaOffSet, shortLengthTSI, longLengthTSI, maTypeTSI, almaOffsetTSI, almaSigmaTSI, lsmaOffSetTSI, maTypeSignal, smoothingLengthSignal, almaOffsetSignal, almaSigmaSignal, lsmaOffSetSignal)
Parameters:
shortLen
longLen
maType
almaOffset
almaSigma
lsmaOffSet
shortLengthTSI
longLengthTSI
maTypeTSI
almaOffsetTSI
almaSigmaTSI
lsmaOffSetTSI
maTypeSignal
smoothingLengthSignal
almaOffsetSignal
almaSigmaSignal
lsmaOffSetSignal
smiPVI(source, shortLengthTSI, longLengthTSI, maTypeTSI, almaOffsetTSI, almaSigmaTSI, lsmaOffSetTSI, maTypeSignal, smoothingLengthSignal, almaOffsetSignal, almaSigmaSignal, lsmaOffSetSignal)
Parameters:
source
shortLengthTSI
longLengthTSI
maTypeTSI
almaOffsetTSI
almaSigmaTSI
lsmaOffSetTSI
maTypeSignal
smoothingLengthSignal
almaOffsetSignal
almaSigmaSignal
lsmaOffSetSignal
smiNVI(source, shortLengthTSI, longLengthTSI, maTypeTSI, almaOffsetTSI, almaSigmaTSI, lsmaOffSetTSI, maTypeSignal, smoothingLengthSignal, almaOffsetSignal, almaSigmaSignal, lsmaOffSetSignal)
Parameters:
source
shortLengthTSI
longLengthTSI
maTypeTSI
almaOffsetTSI
almaSigmaTSI
lsmaOffSetTSI
maTypeSignal
smoothingLengthSignal
almaOffsetSignal
almaSigmaSignal
lsmaOffSetSignal
rsiVolume(length)
Parameters:
length
rsiMA(sourceMA, lengthMA, maType, almaOffset, almaSigma, lsmaOffSet, lengthRSI)
Parameters:
sourceMA
lengthMA
maType
almaOffset
almaSigma
lsmaOffSet
lengthRSI
Any Oscillator Underlay [TTF]We are proud to release a new indicator that has been a while in the making - the Any Oscillator Underlay (AOU) !
Note: There is a lot to discuss regarding this indicator, including its intent and some of how it operates, so please be sure to read this entire description before using this indicator to help ensure you understand both the intent and some limitations with this tool.
Our intent for building this indicator was to accomplish the following:
Combine all of the oscillators that we like to use into a single indicator
Take up a bit less screen space for the underlay indicators for strategies that utilize multiple oscillators
Provide a tool for newer traders to be able to leverage multiple oscillators in a single indicator
Features:
Includes 8 separate, fully-functional indicators combined into one
Ability to easily enable/disable and configure each included indicator independently
Clearly named plots to support user customization of color and styling, as well as manual creation of alerts
Ability to customize sub-indicator title position and color
Ability to customize sub-indicator divider lines style and color
Indicators that are included in this initial release:
TSI
2x RSIs (dubbed the Twin RSI )
Stochastic RSI
Stochastic
Ultimate Oscillator
Awesome Oscillator
MACD
Outback RSI (Color-coding only)
Quick note on OB/OS:
Before we get into covering each included indicator, we first need to cover a core concept for how we're defining OB and OS levels. To help illustrate this, we will use the TSI as an example.
The TSI by default has a mid-point of 0 and a range of -100 to 100. As a result, a common practice is to place lines on the -30 and +30 levels to represent OS and OB zones, respectively. Most people tend to view these levels as distance from the edges/outer bounds or as absolute levels, but we feel a more way to frame the OB/OS concept is to instead define it as distance ("offset") from the mid-line. In keeping with the -30 and +30 levels in our example, the offset in this case would be "30".
Taking this a step further, let's say we decided we wanted an offset of 25. Since the mid-point is 0, we'd then calculate the OB level as 0 + 25 (+25), and the OS level as 0 - 25 (-25).
Now that we've covered the concept of how we approach defining OB and OS levels (based on offset/distance from the mid-line), and since we did apply some transformations, rescaling, and/or repositioning to all of the indicators noted above, we are going to discuss each component indicator to detail both how it was modified from the original to fit the stacked-indicator model, as well as the various major components that the indicator contains.
TSI:
This indicator contains the following major elements:
TSI and TSI Signal Line
Color-coded fill for the TSI/TSI Signal lines
Moving Average for the TSI
TSI Histogram
Mid-line and OB/OS lines
Default TSI fill color coding:
Green : TSI is above the signal line
Red : TSI is below the signal line
Note: The TSI traditionally has a range of -100 to +100 with a mid-point of 0 (range of 200). To fit into our stacking model, we first shrunk the range to 100 (-50 to +50 - cut it in half), then repositioned it to have a mid-point of 50. Since this is the "bottom" of our indicator-stack, no additional repositioning is necessary.
Twin RSI:
This indicator contains the following major elements:
Fast RSI (useful if you want to leverage 2x RSIs as it makes it easier to see the overlaps and crosses - can be disabled if desired)
Slow RSI (primary RSI)
Color-coded fill for the Fast/Slow RSI lines (if Fast RSI is enabled and configured)
Moving Average for the Slow RSI
Mid-line and OB/OS lines
Default Twin RSI fill color coding:
Dark Red : Fast RSI below Slow RSI and Slow RSI below Slow RSI MA
Light Red : Fast RSI below Slow RSI and Slow RSI above Slow RSI MA
Dark Green : Fast RSI above Slow RSI and Slow RSI below Slow RSI MA
Light Green : Fast RSI above Slow RSI and Slow RSI above Slow RSI MA
Note: The RSI naturally has a range of 0 to 100 with a mid-point of 50, so no rescaling or transformation is done on this indicator. The only manipulation done is to properly position it in the indicator-stack based on which other indicators are also enabled.
Stochastic and Stochastic RSI:
These indicators contain the following major elements:
Configurable lengths for the RSI (for the Stochastic RSI only), K, and D values
Configurable base price source
Mid-line and OB/OS lines
Note: The Stochastic and Stochastic RSI both have a normal range of 0 to 100 with a mid-point of 50, so no rescaling or transformations are done on either of these indicators. The only manipulation done is to properly position it in the indicator-stack based on which other indicators are also enabled.
Ultimate Oscillator (UO):
This indicator contains the following major elements:
Configurable lengths for the Fast, Middle, and Slow BP/TR components
Mid-line and OB/OS lines
Moving Average for the UO
Color-coded fill for the UO/UO MA lines (if UO MA is enabled and configured)
Default UO fill color coding:
Green : UO is above the moving average line
Red : UO is below the moving average line
Note: The UO naturally has a range of 0 to 100 with a mid-point of 50, so no rescaling or transformation is done on this indicator. The only manipulation done is to properly position it in the indicator-stack based on which other indicators are also enabled.
Awesome Oscillator (AO):
This indicator contains the following major elements:
Configurable lengths for the Fast and Slow moving averages used in the AO calculation
Configurable price source for the moving averages used in the AO calculation
Mid-line
Option to display the AO as a line or pseudo-histogram
Moving Average for the AO
Color-coded fill for the AO/AO MA lines (if AO MA is enabled and configured)
Default AO fill color coding (Note: Fill was disabled in the image above to improve clarity):
Green : AO is above the moving average line
Red : AO is below the moving average line
Note: The AO is technically has an infinite (unbound) range - -∞ to ∞ - and the effective range is bound to the underlying security price (e.g. BTC will have a wider range than SP500, and SP500 will have a wider range than EUR/USD). We employed some special techniques to rescale this indicator into our desired range of 100 (-50 to 50), and then repositioned it to have a midpoint of 50 (range of 0 to 100) to meet the constraints of our stacking model. We then do one final repositioning to place it in the correct position the indicator-stack based on which other indicators are also enabled. For more details on how we accomplished this, read our section "Binding Infinity" below.
MACD:
This indicator contains the following major elements:
Configurable lengths for the Fast and Slow moving averages used in the MACD calculation
Configurable price source for the moving averages used in the MACD calculation
Configurable length and calculation method for the MACD Signal Line calculation
Mid-line
Note: Like the AO, the MACD also technically has an infinite (unbound) range. We employed the same principles here as we did with the AO to rescale and reposition this indicator as well. For more details on how we accomplished this, read our section "Binding Infinity" below.
Outback RSI (ORSI):
This is a stripped-down version of the Outback RSI indicator (linked above) that only includes the color-coding background (suffice it to say that it was not technically feasible to attempt to rescale the other components in a way that could consistently be clearly seen on-chart). As this component is a bit of a niche/special-purpose sub-indicator, it is disabled by default, and we suggest it remain disabled unless you have some pre-defined strategy that leverages the color-coding element of the Outback RSI that you wish to use.
Binding Infinity - How We Incorporated the AO and MACD (Warning - Math Talk Ahead!)
Note: This applies only to the AO and MACD at time of original publication. If any other indicators are added in the future that also fall into the category of "binding an infinite-range oscillator", we will make that clear in the release notes when that new addition is published.
To help set the stage for this discussion, it's important to note that the broader challenge of "equalizing inputs" is nothing new. In fact, it's a key element in many of the most popular fields of data science, such as AI and Machine Learning. They need to take a diverse set of inputs with a wide variety of ranges and seemingly-random inputs (referred to as "features"), and build a mathematical or computational model in order to work. But, when the raw inputs can vary significantly from one another, there is an inherent need to do some pre-processing to those inputs so that one doesn't overwhelm another simply due to the difference in raw values between them. This is where feature scaling comes into play.
With this in mind, we implemented 2 of the most common methods of Feature Scaling - Min-Max Normalization (which we call "Normalization" in our settings), and Z-Score Normalization (which we call "Standardization" in our settings). Let's take a look at each of those methods as they have been implemented in this script.
Min-Max Normalization (Normalization)
This is one of the most common - and most basic - methods of feature scaling. The basic formula is: y = (x - min)/(max - min) - where x is the current data sample, min is the lowest value in the dataset, and max is the highest value in the dataset. In this transformation, the max would evaluate to 1, and the min would evaluate to 0, and any value in between the min and the max would evaluate somewhere between 0 and 1.
The key benefits of this method are:
It can be used to transform datasets of any range into a new dataset with a consistent and known range (0 to 1).
It has no dependency on the "shape" of the raw input dataset (i.e. does not assume the input dataset can be approximated to a normal distribution).
But there are a couple of "gotchas" with this technique...
First, it assumes the input dataset is complete, or an accurate representation of the population via random sampling. While in most situations this is a valid assumption, in trading indicators we don't really have that luxury as we're often limited in what sample data we can access (i.e. number of historical bars available).
Second, this method is highly sensitive to outliers. Since the crux of this transformation is based on the max-min to define the initial range, a single significant outlier can result in skewing the post-transformation dataset (i.e. major price movement as a reaction to a significant news event).
You can potentially mitigate those 2 "gotchas" by using a mechanism or technique to find and discard outliers (e.g. calculate the mean and standard deviation of the input dataset and discard any raw values more than 5 standard deviations from the mean), but if your most recent datapoint is an "outlier" as defined by that algorithm, processing it using the "scrubbed" dataset would result in that new datapoint being outside the intended range of 0 to 1 (e.g. if the new datapoint is greater than the "scrubbed" max, it's post-transformation value would be greater than 1). Even though this is a bit of an edge-case scenario, it is still sure to happen in live markets processing live data, so it's not an ideal solution in our opinion (which is why we chose not to attempt to discard outliers in this manner).
Z-Score Normalization (Standardization)
This method of rescaling is a bit more complex than the Min-Max Normalization method noted above, but it is also a widely used process. The basic formula is: y = (x – μ) / σ - where x is the current data sample, μ is the mean (average) of the input dataset, and σ is the standard deviation of the input dataset. While this transformation still results in a technically-infinite possible range, the output of this transformation has a 2 very significant properties - the mean (average) of the output dataset has a mean (μ) of 0 and a standard deviation (σ) of 1.
The key benefits of this method are:
As it's based on normalizing the mean and standard deviation of the input dataset instead of a linear range conversion, it is far less susceptible to outliers significantly affecting the result (and in fact has the effect of "squishing" outliers).
It can be used to accurately transform disparate sets of data into a similar range regardless of the original dataset's raw/actual range.
But there are a couple of "gotchas" with this technique as well...
First, it still technically does not do any form of range-binding, so it is still technically unbounded (range -∞ to ∞ with a mid-point of 0).
Second, it implicitly assumes that the raw input dataset to be transformed is normally distributed, which won't always be the case in financial markets.
The first "gotcha" is a bit of an annoyance, but isn't a huge issue as we can apply principles of normal distribution to conceptually limit the range by defining a fixed number of standard deviations from the mean. While this doesn't totally solve the "infinite range" problem (a strong enough sudden move can still break out of our "conceptual range" boundaries), the amount of movement needed to achieve that kind of impact will generally be pretty rare.
The bigger challenge is how to deal with the assumption of the input dataset being normally distributed. While most financial markets (and indicators) do tend towards a normal distribution, they are almost never going to match that distribution exactly. So let's dig a bit deeper into distributions are defined and how things like trending markets can affect them.
Skew (skewness): This is a measure of asymmetry of the bell curve, or put another way, how and in what way the bell curve is disfigured when comparing the 2 halves. The easiest way to visualize this is to draw an imaginary vertical line through the apex of the bell curve, then fold the curve in half along that line. If both halves are exactly the same, the skew is 0 (no skew/perfectly symmetrical) - which is what a normal distribution has (skew = 0). Most financial markets tend to have short, medium, and long-term trends, and these trends will cause the distribution curve to skew in one direction or another. Bullish markets tend to skew to the right (positive), and bearish markets to the left (negative).
Kurtosis: This is a measure of the "tail size" of the bell curve. Another way to state this could be how "flat" or "steep" the bell-shape is. If the bell is steep with a strong drop from the apex (like a steep cliff), it has low kurtosis. If the bell has a shallow, more sweeping drop from the apex (like a tall hill), is has high kurtosis. Translating this to financial markets, kurtosis is generally a metric of volatility as the bell shape is largely defined by the strength and frequency of outliers. This is effectively a measure of volatility - volatile markets tend to have a high level of kurtosis (>3), and stable/consolidating markets tend to have a low level of kurtosis (<3). A normal distribution (our reference), has a kurtosis value of 3.
So to try and bring all that back together, here's a quick recap of the Standardization rescaling method:
The Standardization method has an assumption of a normal distribution of input data by using the mean (average) and standard deviation to handle the transformation
Most financial markets do NOT have a normal distribution (as discussed above), and will have varying degrees of skew and kurtosis
Q: Why are we still favoring the Standardization method over the Normalization method, and how are we accounting for the innate skew and/or kurtosis inherent in most financial markets?
A: Well, since we're only trying to rescale oscillators that by-definition have a midpoint of 0, kurtosis isn't a major concern beyond the affect it has on the post-transformation scaling (specifically, the number of standard deviations from the mean we need to include in our "artificially-bound" range definition).
Q: So that answers the question about kurtosis, but what about skew?
A: So - for skew, the answer is in the formula - specifically the mean (average) element. The standard mean calculation assumes a complete dataset and therefore uses a standard (i.e. simple) average, but we're limited by the data history available to us. So we adapted the transformation formula to leverage a moving average that included a weighting element to it so that it favored recent datapoints more heavily than older ones. By making the average component more adaptive, we gained the effect of reducing the skew element by having the average itself be more responsive to recent movements, which significantly reduces the effect historical outliers have on the dataset as a whole. While this is certainly not a perfect solution, we've found that it serves the purpose of rescaling the MACD and AO to a far more well-defined range while still preserving the oscillator behavior and mid-line exceptionally well.
The most difficult parts to compensate for are periods where markets have low volatility for an extended period of time - to the point where the oscillators are hovering around the 0/midline (in the case of the AO), or when the oscillator and signal lines converge and remain close to each other (in the case of the MACD). It's during these periods where even our best attempt at ensuring accurate mirrored-behavior when compared to the original can still occasionally lead or lag by a candle.
Note: If this is a make-or-break situation for you or your strategy, then we recommend you do not use any of the included indicators that leverage this kind of bounding technique (the AO and MACD at time of publication) and instead use the Trandingview built-in versions!
We know this is a lot to read and digest, so please take your time and feel free to ask questions - we will do our best to answer! And as always, constructive feedback is always welcome!
True Strength Indicator + Realtime DivergencesTrue Strength Indicator (TSI) + Realtime Divergences + Alerts + Lookback periods.
This version of the True Strength Indicator adds the following 5 additional features to the stock TSI by Tradingview:
- Optional divergence lines drawn directly onto the oscillator in realtime.
- Configurable alerts to notify you when divergences occur, as well as when the TSI and lagline bands crossover one another, when the oscillator begins heading up, or heading down.
- Configurable lookback periods to fine tune the divergences drawn in order to suit different trading styles and timeframes.
- Background colouring option to indicate when the two TSI bands, the TSI line and the TSI lagline, have crossed one another, either moving upwards or downwards, or optionally when the two TSI bands have crossed upwards and an external oscillator, which can be linked via the settings, has crossed above its centerline, and the TSI bands have crossed downwards and the external oscillator has crossed below its centerline.
- Alternate timeframe feature allows you to configure the oscillator to use data from a different timeframe than the chart it is loaded on.
This indicator adds additional features onto the stock TSI by Tradingview, whose core calculations remain unchanged, although this version has different settings as default to suit a shorter time period (it uses 6, 13, 4 by default, whereas the stock TSI typically ships with higher values, e.g. 25, 13, 13). Namely the configurable option to automatically, quickly and clearly draw divergence lines onto the oscillator for you as they occur in realtime. It also has the addition of unique alerts, so you can be notified when divergences occur without spending all day watching the charts. Furthermore, this version of the TSI comes with configurable lookback periods, which can be configured in order to adjust the sensitivity of the divergences, in order to suit shorter or higher timeframe trading approaches.
The True Strength Indicator
Tradingview describes the True Strength Indicator as follows:
“The True Strength Index (TSI) is a momentum oscillator that ranges between limits of -100 and +100 and has a base value of 0. Momentum is positive when the oscillator is positive (pointing to a bullish market bias) and vice versa. It was developed by William Blau and consists of 2 lines: the index line and an exponential moving average of the TSI, called the signal line. Traders may look for any of the following 5 types of conditions: overbought, oversold, centerline crossover, divergence and signal line crossover. The indicator is often used in combination with other signals..”
What are divergences?
Divergence is when the price of an asset is moving in the opposite direction of a technical indicator, such as an oscillator, or is moving contrary to other data. Divergence warns that the current price trend may be weakening, and in some cases may lead to the price changing direction.
There are 4 main types of divergence, which are split into 2 categories;
regular divergences and hidden divergences. Regular divergences indicate possible trend reversals, and hidden divergences indicate possible trend continuation.
Regular bullish divergence: An indication of a potential trend reversal, from the current downtrend, to an uptrend.
Regular bearish divergence: An indication of a potential trend reversal, from the current uptrend, to a downtrend.
Hidden bullish divergence: An indication of a potential uptrend continuation.
Hidden bearish divergence: An indication of a potential downtrend continuation.
Setting alerts.
With this indicator you can set alerts to notify you when any/all of the above types of divergences occur, on any chart timeframe you choose.
Configurable lookback values.
You can adjust the default lookback values to suit your prefered trading style and timeframe. If you like to trade a shorter time frame, lowering the default lookback values will make the divergences drawn more sensitive to short term price action.
How do traders use divergences in their trading?
A divergence is considered a leading indicator in technical analysis , meaning it has the ability to indicate a potential price move in the short term future.
Hidden bullish and hidden bearish divergences, which indicate a potential continuation of the current trend are sometimes considered a good place for traders to begin, since trend continuation occurs more frequently than reversals, or trend changes.
When trading regular bullish divergences and regular bearish divergences, which are indications of a trend reversal, the probability of it doing so may increase when these occur at a strong support or resistance level . A common mistake new traders make is to get into a regular divergence trade too early, assuming it will immediately reverse, but these can continue to form for some time before the trend eventually changes, by using forms of support or resistance as an added confluence, such as when price reaches a moving average, the success rate when trading these patterns may increase.
Typically, traders will manually draw lines across the swing highs and swing lows of both the price chart and the oscillator to see whether they appear to present a divergence, this indicator will draw them for you, quickly and clearly, and can notify you when they occur.
Disclaimer: This script includes code from the stock TSI by Tradingview as well as the Divergence for Many Indicators v4 by LonesomeTheBlue
True Strength Index (TSI)%📌 Script Name: TSI Percentuale
This script is a custom True Strength Index (TSI) indicator that expresses momentum strength as a percentage from 0% to 100%, instead of the traditional TSI scale.
✅ What the Script Does
Calculates the standard TSI:
Uses double exponential smoothing of price changes and their absolute values.
Formula:
TSI_raw
=
100
×
DoubleSmoothed(ΔPrice)
DoubleSmoothed(|ΔPrice|)
TSI_raw=100×
DoubleSmoothed(|ΔPrice|)
DoubleSmoothed(ΔPrice)
Normalizes TSI to a percentile scale:
Over a user-defined lookback period, the script finds the lowest and highest TSI values.
It then rescales the current TSI to a value between 0% (minimum) and 100% (maximum).
50% represents neutral momentum (i.e., "flat").
Plots the result:
tsi_percent is plotted as a blue line.
Horizontal dashed/dotted lines are drawn at:
0% → strong downward momentum
50% → neutral
100% → strong upward momentum
⚙️ Inputs
Long Length: Long EMA smoothing period (default: 25)
Short Length: Short EMA smoothing period (default: 13)
Signal Length: (not used in this version, can be removed or extended)
Lookback Period: Number of bars to calculate min/max normalization (default: 100)
🧠 Why Use This Indicator
The classic TSI ranges around and can be hard to interpret.
This version makes TSI visually intuitive by converting it to percentile form, allowing easier comparison of momentum strength across time and instruments.
It’s particularly useful for defining zones like:
Above 70% = strong bullish
Below 30% = strong bearish
OBV TSI IndicatorThe OBV TSI Indicator combines two powerful technical analysis tools: the On-Balance Volume (OBV) and the True Strength Index (TSI). This hybrid approach provides insights into both volume dynamics and momentum, helping traders identify potential trend reversals, breakouts, or continuations with greater accuracy.
The OBV TSI Indicator tracks cumulative volume shifts via OBV and integrates the TSI for momentum analysis. It offers customizable moving average options for further smoothing. Visual trendlines, pivot points, and signal markers enhance clarity.
The OBV tracks volume flow by summing volumes based on price changes. Positive volume is added when prices rise, and negative volume is subtracted when prices fall. The result is smoothed to detect meaningful trends in volume. A volume spread is derived from the difference between the smoothed OBV and cumulative volume. This is then adjusted by the price deviation to generate the shadow spread, which highlights critical volume-driven price levels.
The shadow spread is added to either the high or low price, depending on its sign, producing a refined OBV output. This serves as the main source for the subsequent TSI calculation. The TSI is a momentum oscillator calculated using double-smoothed price changes. It provides an accurate measure of trend strength and direction.
Various moving average options, such as EMA, DEMA, or TEMA, are applied to the smoothed OBV for additional trend filtering. Users can select their preferred type and length to suit their trading strategy. Trendlines are plotted to visualize the overall direction. When a significant change in trend is detected, up or down arrows indicate potential buy or sell signals. The script identifies key pivot points based on the highest and lowest levels within a defined period. These pivots help pinpoint reversal zones.
The indicator offers customization options, allowing users to adjust the OBV length for smoothing, choose from various moving average types, and fine-tune the short, long, and signal periods for TSI. Additionally, users can toggle visibility for trendlines, signals, and pivots to suit their preferences.
This indicator is ideal for practical use cases such as spotting potential trend reversals by observing TSI crossovers and pivot levels, anticipating breakouts from key price levels using the shadow spread, and validating trends by aligning TSI signals with OBV and moving averages.
The OBV TSI Indicator is a versatile tool designed to enhance decision-making in trading by combining volume and momentum analysis. Its flexibility and visual aids make it suitable for traders of all experience levels. By leveraging its insights, you can confidently navigate market trends and improve your trading outcomes.
Kalman Trend Strength Index (K-TSI)The Kalman Trend Strength Index (K-TSI) is an innovative technical indicator that combines the Kalman filter with correlation analysis to measure trend strength in financial markets. This sophisticated tool aims to provide traders with a more refined method for trend analysis and market dynamics interpretation.
The use of the Kalman filter is a key feature of the K-TSI. This advanced algorithm is renowned for its ability to extract meaningful signals from noisy data. In financial markets, this translates to smoothing out price action while maintaining responsiveness to genuine market movements. By applying the Kalman filter to price data before performing correlation analysis, the K-TSI potentially offers more stable and reliable trend signals.
The synergy between the Kalman-filtered price data and correlation analysis creates an oscillator that attempts to capture market dynamics more effectively. The correlation component contributes by measuring the strength and consistency of price movements relative to time, while the Kalman filter adds robustness by reducing the impact of market noise. Basing these calculations on Kalman-filtered data may help reduce false signals and provide a clearer picture of underlying market trends.
A notable aspect of the K-TSI is its normalization process. This approach adjusts the indicator's values to a standardized range (-1 to 1), allowing for consistent interpretation across different market conditions and timeframes. This flexibility, combined with the noise-reduction properties of the Kalman filter, positions the K-TSI as a potentially useful tool for various market environments.
In practice, traders might find that the K-TSI offers several potential benefits:
Smoother trend identification, which could aid in detecting the start and end of trends more accurately.
Possibly reduced false signals, particularly in choppy or volatile markets.
Potential for improved trend strength assessment, which might lead to more confident trading decisions.
Consistent performance across different timeframes, due to the adaptive nature of the Kalman filter and the normalization process.
The K-TSI's visual representation as a color-coded histogram further enhances its utility. The changing colors and intensities provide an intuitive way to gauge both the direction and strength of trends, making it easier for traders to quickly assess market conditions.
While the K-TSI builds upon existing concepts in technical analysis, its integration of the Kalman filter with correlation analysis offers traders an interesting tool for market analysis. It represents an attempt to address common challenges in technical analysis, such as noise reduction and trend strength quantification.
As with any technical indicator, the K-TSI should be used as part of a broader trading strategy rather than in isolation. Its effectiveness will depend on how well it aligns with a trader's individual approach and market conditions. For traders looking to explore a more refined trend strength oscillator, the Kalman Trend Strength Index could be a worthwhile addition to their analytical toolkit.
HULLTSIBOTDo you like TSI indicator?
Do you like HMA indicator?
The all new, HULLTSIBOT indicator!
About:
TSI indicator was on a space mission to mine other planets and then the crew stumbled upon a bunch of HMA indicator eggs. In the darkness of the slime room they found, There was a suddenly a bunch of failing and swearing and machinegun fire muzzle flashes, then all fell silent.
from the back shadow mist stepped forward a TSI indicator, but its eyes were bloodshot and it did not look the same...
The rescue ship found the TSI indicator motionless but still with a heartbeat....
a few days went past, the TSI indicator layed in the medic bay,
A medic noticed a bulge in the abdomen, that started to move!
The alien lifeform burst through the stomach of the TSI indicator and flew at the medic, covering the face and overpowering the new victim with ease...
Quickly it spread throughout the entire rescue ships crew, with many new alien lifeforms searching every corner for a new host.
The rescue ship flew on, able to land with autopilot as programmed for in emergencies, Thus the HULLTSIBOT was introduced to the humans world...
planet earth
Bjorgum TSI-This script utilizes simple color changes of the TSI output signals to aid in interpretation of the classic TSI indicator.
-Crosses of the TSI value line and signal line are a bullish or bearish indication. TSI value line is colored green or yellow to help identify that the TSI value line is either dropping or rising, while over or under the signal line.
-This can help anticipate a cross, or significant points in the trend. TSI signal line changes color when rising or falling which can help to identify larger prevailing trends.
-Generally, a rising signal line can be an overall bullish move, while falling more bearish regardless of crosses.
*Resolution function enables multiple overlay for "Multi-timeframe analysis"*
Machine Learning Momentum Oscillator [ChartPrime]The Machine Learning Momentum Oscillator brings together the K-Nearest Neighbors (KNN) algorithm and the predictive strength of the Tactical Sector Indicator (TSI) Momentum. This unique oscillator not only uses the insights from TSI Momentum but also taps into the power of machine learning therefore being designed to give traders a more comprehensive view of market momentum.
At its core, the Machine Learning Momentum Oscillator blends TSI Momentum with the capabilities of the KNN algorithm. Introducing KNN logic allows for better handling of noise in the data set. The TSI Momentum is known for understanding how strong trends are and which direction they're headed, and now, with the added layer of machine learning, we're able to offer a deeper perspective on market trends. This is a fairly classical when it comes to visuals and trading.
Green bars show the trader when the asset is in an uptrend. On the flip side, red bars mean things are heading down, signaling a bearish movement driven by selling pressure. These color cues make it easier to catch the sentiment and direction of the market in a glance.
Yellow boxes are also displayed by the oscillator. These boxes highlight potential turning points or peaks. When the market comes close to these points, they can provide a heads-up about the possibility of changes in momentum or even a trend reversal, helping a trader make informed choices quickly. These can be looked at as possible reversal areas simply put.
Settings:
Users can adjust the number of neighbours in the KNN algorithm and choose the periods they prefer for analysis. This way, the tool becomes a part of a trader's strategy, adapting to different market conditions as they see fit. Users can also adjust the smoothing used by the oscillator via the smoothing input.