Bjorgum TSI-This script utilizes simple color changes of the TSI output signals to aid in interpretation of the classic TSI indicator.
-Crosses of the TSI value line and signal line are a bullish or bearish indication. TSI value line is colored green or yellow to help identify that the TSI value line is either dropping or rising, while over or under the signal line.
-This can help anticipate a cross, or significant points in the trend. TSI signal line changes color when rising or falling which can help to identify larger prevailing trends.
-Generally, a rising signal line can be an overall bullish move, while falling more bearish regardless of crosses.
*Resolution function enables multiple overlay for "Multi-timeframe analysis"*
Cerca negli script per "tsi"
Machine Learning Momentum Oscillator [ChartPrime]The Machine Learning Momentum Oscillator brings together the K-Nearest Neighbors (KNN) algorithm and the predictive strength of the Tactical Sector Indicator (TSI) Momentum. This unique oscillator not only uses the insights from TSI Momentum but also taps into the power of machine learning therefore being designed to give traders a more comprehensive view of market momentum.
At its core, the Machine Learning Momentum Oscillator blends TSI Momentum with the capabilities of the KNN algorithm. Introducing KNN logic allows for better handling of noise in the data set. The TSI Momentum is known for understanding how strong trends are and which direction they're headed, and now, with the added layer of machine learning, we're able to offer a deeper perspective on market trends. This is a fairly classical when it comes to visuals and trading.
Green bars show the trader when the asset is in an uptrend. On the flip side, red bars mean things are heading down, signaling a bearish movement driven by selling pressure. These color cues make it easier to catch the sentiment and direction of the market in a glance.
Yellow boxes are also displayed by the oscillator. These boxes highlight potential turning points or peaks. When the market comes close to these points, they can provide a heads-up about the possibility of changes in momentum or even a trend reversal, helping a trader make informed choices quickly. These can be looked at as possible reversal areas simply put.
Settings:
Users can adjust the number of neighbours in the KNN algorithm and choose the periods they prefer for analysis. This way, the tool becomes a part of a trader's strategy, adapting to different market conditions as they see fit. Users can also adjust the smoothing used by the oscillator via the smoothing input.

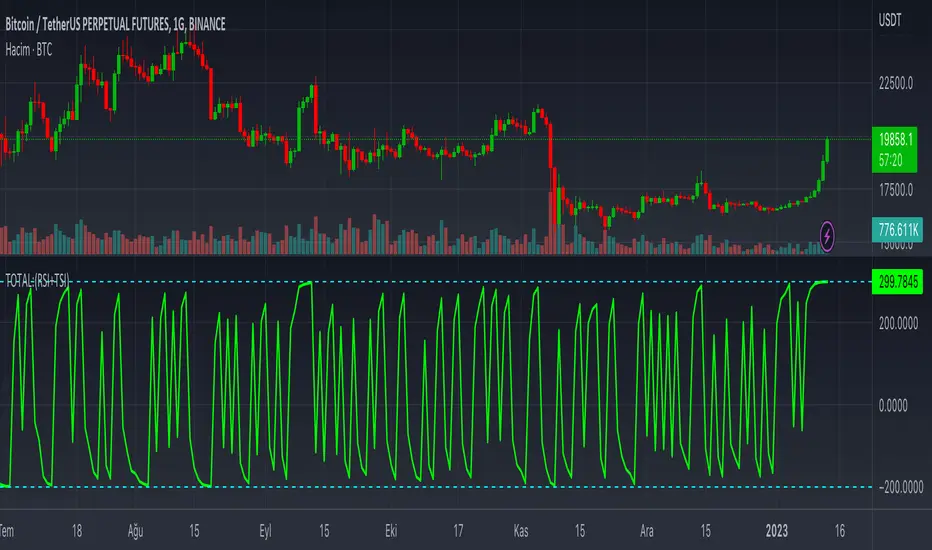
TOTAL:(RSI+TSI)TOTAL:(RSI+TSI)
This indicator collects instant data of RSI and TSI oscillators. RSI moves between (0) and (100) values as a moving line, while TSI moves between (-100) and (+100) values as two moving lines.
The top value of the sum of these values is graphically;
It takes the total value (+300) from RSI (+100), TSI (+100) and (+100).
The lowest value of the sum of these values is graphically;
It takes the value (-200) from the RSI (0), (-100) and (-100) from the TSI.
In case this indicator approaches (+300) graphically; It can be seen that price candlesticks mostly move upwards. This may not always give accurate results. Past incompatibilities can affect this situation.
In case this indicator approaches (-200) graphically; It can be seen that price candlesticks mostly move downwards. This may not always give accurate results. Past incompatibilities can affect this situation.
The graphical movements and numerical values created by this indicator do not give precise results for price candles.
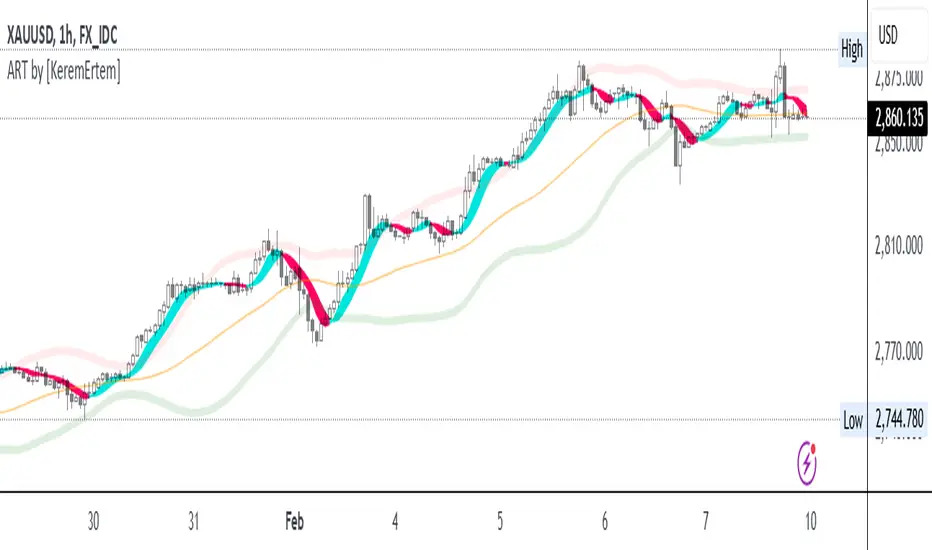
ADX, RSI, & TSI utilized as ART [by KeremErtem]The "ADX, RSI, & TSI utilized as ART" script is an advanced technical analysis tool designed by Kerem Ertem to help traders identify trend direction, strength, and potential reversals. It integrates the Average Directional Index (ADX), Relative Strength Index (RSI), and True Strength Index (TSI) into a cohesive, user-friendly indicator known as ART (Adaptive Relative Trend) .
What it does:
Trend Detection: Utilizes ADX to identify the strength and direction of trends.
Momentum Analysis: Uses RSI to gauge the speed and change of price movements.
Signal Smoothing: Incorporates TSI to reduce noise and provide clearer signals.
How it works:
Input Settings: Customize the source (hlc3), signal period (l1), and lookback range (l2) to tailor the indicator to your trading strategy.
Angle Calculation (ACI): The script calculates the angle of price movements using a custom function, which combines the lowest and highest prices with moving averages to create a smoother representation of trend angles.
Weighted Average: The ACI function is applied to the source price to derive a weighted average, which serves as the foundation for further calculations.
RSI Integration: The script calculates the RSI based on the weighted average price and further refines it using the ACI function to enhance signal accuracy.
ADX Calculation: ADX values are computed and adjusted using the ACI function to provide a clearer indication of trend strength and direction.
ART Indicator: The combined results of the RSI and ADX calculations form the ART indicator, which is plotted alongside trend lines and bands for comprehensive trend analysis.
Bands and Trend Lines: The script plots upper, lower, and center bands based on standard deviation and moving averages, providing visual cues for potential support and resistance levels.
How to use it:
Customization: Adjust the signal period, lookback range, RSI length, and ADX settings to fit your trading preferences.
Interpretation: Green ART signal lines indicate bullish trends, while red lines indicate bearish trends. The trend line color changes from cyan to magenta based on the trend direction.
Bands: Use the upper and lower bands as potential entry and exit points, with the center line acting as a trend confirmation.
This script offers a comprehensive approach to trend and momentum analysis, making it a valuable tool for traders seeking to enhance their trading strategies with advanced technical indicators.
SMI Ergodic Indicator/Oscillator▮ Introduction
The Stochastic Momentum Index Ergodic Indicator (SMII) is a technical analysis tool designed to predict trend reversals in the price of an asset.
It functions as a momentum oscillator, measuring the ratio of the smoothed price change to the smoothed absolute price change over a given number of previous periods.
The Ergodic SMI is based on the True Strength Index (TSI) and integrates a signal line, which is an exponential moving average (EMA) of the SMI indicator itself.
It provides a clearer picture of market trends than the traditional stochastic oscillator by incorporating the concept of "ergodicity", which helps remove market noise.
On ther other hand, the Stochastic Momentum Index Ergodic Oscillator (SMIO) is a histogram that measures the difference between TSI and it's signal line.
By default, in TradingView both SMII and SMIO are provided independently.
Here in this script these two indicators are combined, providing a more comprehensive view of price direction and market strength.
▮ Motivation: why another indicator?
The intrinsic value of this indicator lies in the fact that it allows fine adjustments in both calculation parameters, data source and visualization, features that are not present in the standard indicators or similar.
Also, trend lines breakouts and divergences detector were added.
▮ What to look for
When using the indicator, there are a few things to look out for.
First, look at the SMI signal line.
When the line crosses above -40, it is considered a buy signal, while the crossing below +40 is considered a sell signal.
Also, pay attention to divergences between the SMI and the price.
If price is rising but the SMI is showing negative divergence, it could indicate that momentum is waning and a reversal could be in the offing.
Likewise, if price is falling but the SMI is showing positive divergence, this could indicate that momentum is building and a reversal could also be in the offing.
Divergences can be considered in both indicator and/or histogram.
Examples:
▮ Notes
The indicator presented here offers both the "SMII" and the "SMIO", that is, the "Stochastic Momentum Index Ergodic Indicator" together with the "Stochastic Momentum Index Ergodic Oscillator" (histogram), as per the documentation described in reference links.
So it is important to highlight the differences in relation to my other indicator, Stochastic Momentum Index (SMI) Refurbished .
This last one is purely based on the **SMI**, which is implemented using smoothed ratio between the relative range and the high/low range.
Although they may seem the same in some situations, the calculation is actually different. The TSI tends to be more responsive at the expense of being noisier, while the SMI tends to be smoother. Which of these two indicators is best depends on the situation, the context, and the analyst's personal preference.
Please refer to reference links to more info.
▮ References
SMI documentation
SMII documentation
SMIO documentation

Stochastic Momentum Index (SMI) Refurbished▮Introduction
Stochastic Momentum Index (SMI) Indicator is a technical indicator used in technical analysis of stocks and other financial instruments.
It was developed by William Blau in 1993 and is considered to be a momentum indicator that can help identify trend reversal points.
Basically, it's a combination of the True Strength Index with a signal line to help identify turning points in the market.
SMI uses the stochastic formula to compare the current closing price of an asset with the maximum and minimum price range over a specific period.
He then compares this ratio to a short-term moving average to create an indicator that oscillates between -100 and +100.
When the SMI is above 0, it is considered positive, indicating that the current price is above the short-term moving average.
When it is below 0, it is considered negative, indicating that the current price is below the short-term moving average.
Traders use the SMI to identify potential trend reversal points.
When the indicator reaches an extreme level above +40 or below -40, a trend reversal is possible.
Furthermore, traders also watch for divergences between the SMI and the asset price to identify potential trading opportunities.
It is important to remember that the SMI is a technical indicator and as such should be used in conjunction with other technical analysis tools to get a complete picture of the market situation.
▮ Improvements
The following features were added:
1. 7 color themes, for TSI, Signal and Histogram.
2. Possibility to customize moving average type for TSI/Signal.
3. Dynamic Zones.
4. Crossing Alerts.
5. Alert points on specific ranges.
5. Coloring of bars according to TSI/Signal/Histogram.
▮ Themes
Examples:
▮ About Dynamic Zones
'Most indicators use a fixed zone for buy and sell signals.
Here's a concept based on zones that are responsive to the past levels of the indicator.'
The concept of Dynamic Zones was described by Leo Zamansky ( Ph .D.) and David Stendahl, in the magazine of Stocks & Commodities V15:7 (306-310).
Basically, a statistical calculation is made to define the extreme levels, delimiting a possible overbought/oversold region.
Given user-defined probabilities, the percentile is calculated using the method of Nearest Rank.
It is calculated by taking the difference between the data point and the number of data points below it, then dividing by the total number of data points in the set.
The result is expressed as a percentage.
This provides a measure of how a particular value compares to other values in a data set, identifying outliers or values that are significantly higher or lower than the rest of the data.
▮ What to look for
1. Divergences/weakening of a trend/reversal:
2. Supports, resistances, pullbacks:
3. Overbought/Oversold Points:
▮ Thanks and Credits
- TradingView and PineCoders: for SMI and Moving Averages
- allanster: for Dynamic Zones

Divergence for Many Panel (D4MP+)Divergence for Many Panel (D4MP+)
This Divergence for Many Panel indicator is built upon the realtme divergence drawing code originally authored by LonesomeTheBlue, now in the form of a panel indicator.
The available oscillators, hand picked for their ability to identify high quality divergences currently include:
- Ultimate Oscillator (UO)
- True Strength Index (TSI)
- Money Flow Index (MFI)
- Relative Strength Index (RSI)
- Stochastic RSI
- Time Segmented Volume (TSV)
- Cumulative Delta Volume (CDV)
Note : this list of available oscillators may be added to or altered at a later date.
The indicator includes the following features:
- Ability to select any of the above oscillators
- Optional divergence lines drawn directly onto the oscillator in realtime .
- Configurable alerts to notify you when divergences occur.
- Configurable pivot lookback periods to fine tune the divergences drawn in order to suit different trading styles and timeframes, including the ability to enable automatic adjustment of pivot period per chart timeframe.
- Background colouring option to indicate when the selected oscillator has crossed above or below its centerline.
- Alternate timeframe feature allows you to configure the oscillator to use data from a different timeframe than the chart it is loaded on.
- Oscillator name label, so you can clearly see which oscillator is selected, in the case you have multiple loaded onto a chart.
- Optional adjustable range bands.
- Automatic adjustment of line colours, centerlines and range band levels on a per oscillator basis by default.
- Ability to customise the colours of each of the oscillators.
What is the Ultimate Oscillator ( UO )?
“The Ultimate Oscillator indicator (UO) indicator is a technical analysis tool used to measure momentum across three varying timeframes. The problem with many momentum oscillators is that after a rapid advance or decline in price, they can form false divergence trading signals. For example, after a rapid rise in price, a bearish divergence signal may present itself, however price continues to rise. The ultimate Oscillator attempts to correct this by using multiple timeframes in its calculation as opposed to just one timeframe which is what is used in most other momentum oscillators.”
What is the True Strength Index ( TSI )?
"The true strength index (TSI) is a technical momentum oscillator used to identify trends and reversals. The indicator may be useful for determining overbought and oversold conditions, indicating potential trend direction changes via centerline or signal line crossovers, and warning of trend weakness through divergence."
What is the Money Flow Index ( MFI )?
“The Money Flow Index ( MFI ) is a technical oscillator that uses price and volume data for identifying overbought or oversold signals in an asset. It can also be used to spot divergences which warn of a trend change in price. The oscillator moves between 0 and 100. Unlike conventional oscillators such as the Relative Strength Index ( RSI ), the Money Flow Index incorporates both price and volume data, as opposed to just price. For this reason, some analysts call MFI the volume-weighted RSI .”
What is the Relative Strength Index ( RSI )?
"The relative strength index (RSI) is a momentum indicator used in technical analysis. RSI measures the speed and magnitude of a security's recent price changes to evaluate overvalued or undervalued conditions in the price of that security. The RSI can do more than point to overbought and oversold securities. It can also indicate securities that may be primed for a trend reversal or corrective pullback in price. It can signal when to buy and sell. Traditionally, an RSI reading of 70 or above indicates an overbought situation. A reading of 30 or below indicates an oversold condition. It is also commonly used to identify divergences."
What is the Stochastic RSI (StochRSI)?
"The Stochastic RSI (StochRSI) is an indicator used in technical analysis that ranges between zero and one (or zero and 100 on some charting platforms) and is created by applying the Stochastic oscillator formula to a set of relative strength index (RSI) values rather than to standard price data. Using RSI values within the Stochastic formula gives traders an idea of whether the current RSI value is overbought or oversold. The StochRSI oscillator was developed to take advantage of both momentum indicators in order to create a more sensitive indicator that is attuned to a specific security's historical performance rather than a generalized analysis of price change."
What Is Time Segmented Volume?
"Time segmented volume (TSV) is a technical analysis indicator developed by Worden Brothers Inc. that segments a stock's price and volume according to specific time intervals. The price and volume data is then compared to uncover periods of accumulation (buying) and distribution (selling)."
What is Cumulative Volume Delta ( CDV )?
"The CDV analyses the net buying at market price and net selling at market price. This means, that volume delta is measuring whether it is the buyers or sellers that are more aggressive in taking the current market price. It measures the degree of intent by buyers and sellers, which can be used to indicate who is more dominant. The CDV can be used to help identify possible trends and also divergences"
What are divergences?
Divergence is when the price of an asset is moving in the opposite direction of a technical indicator, such as an oscillator, or is moving contrary to other data. Divergence warns that the current price trend may be weakening, and in some cases may lead to the price changing direction.
There are 4 main types of divergence, which are split into 2 categories;
regular divergences and hidden divergences. Regular divergences indicate possible trend reversals, and hidden divergences indicate possible trend continuation.
Regular bullish divergence: An indication of a potential trend reversal, from the current downtrend, to an uptrend.
Regular bearish divergence: An indication of a potential trend reversal, from the current uptrend, to a downtrend.
Hidden bullish divergence: An indication of a potential uptrend continuation.
Hidden bearish divergence: An indication of a potential downtrend continuation.
Setting alerts.
With this indicator you can set alerts to notify you when any/all of the above types of divergences occur, on any chart timeframe you choose.
Configurable pivot periods.
You can adjust the default pivot periods to suit your prefered trading style and timeframe. If you like to trade a shorter time frame, lowering the default lookback values will make the divergences drawn more sensitive to short term price action.
How do traders use divergences in their trading?
A divergence is considered a leading indicator in technical analysis , meaning it has the ability to indicate a potential price move in the short term future.
Hidden bullish and hidden bearish divergences, which indicate a potential continuation of the current trend are sometimes considered a good place for traders to begin, since trend continuation occurs more frequently than reversals, or trend changes.
When trading regular bullish divergences and regular bearish divergences, which are indications of a trend reversal, the probability of it doing so may increase when these occur at a strong support or resistance level . A common mistake new traders make is to get into a regular divergence trade too early, assuming it will immediately reverse, but these can continue to form for some time before the trend eventually changes, by using forms of support or resistance as an added confluence, such as when price reaches a moving average, the success rate when trading these patterns may increase.
Typically, traders will manually draw lines across the swing highs and swing lows of both the price chart and the oscillator to see whether they appear to present a divergence, this indicator will draw them for you, quickly and clearly, and can notify you when they occur.
Disclaimer : This script includes code from several stock indicators by Tradingview as well as the Divergence for Many Indicators v4 by LonesomeTheBlue. With special thanks.

Ichimoku with MACD/ CMF/ TSIThis is a very powerful trend strategy designed for markets such as stocks market , stock index and crypto.
For time frames I found out that 1h seems to do the trick.
Components:
Ichimoku full pack
MACD histogram
CMF oscillator
TSI oscillator
Rules for entry
Long :
For Ichimoku:Tenkan part of cloud is bigger than kijun, Chikou is above 0 , close of a candle is above the Senkou
MACD histogram is above 0
CMF oscillator is positive and bigger than 0.1
TSI oscillator is above 0
Short:
For Ichimoku:Tenkan part of cloud is smaller than kijun, Chikou is below 0 , close of a candle is belowthe Senkou
MACD histogram is below 0
CMF oscillator is negative and below -0.1
TSI oscillator is below 0
Rules for exit
This strategy does not have any risk management inside. Instead it exits whenver it receives an opposite signal form the original one used for entry.
If you have any questions let me know !

FOTSI - Open sourceI WOULD LIKE TO SPECIFY TWO THINGS:
- The indicator was absolutely not designed by me, I do not take any credit and much less I want them, I am just making this fantastic indicator open source and accessible to all
- The script code was not recycled from other indicators, but was created from 0 following the theory behind it to the letter, thus avoiding copyright infringement
- Advices and improvements are accepted, as having very little programming experience in Pine Script I consider this work still rough and slow
WHAT IS THE FOTSI?
The FOTSI is an oscillator that measures the relative strength of the individual currencies that make up the 28 major Forex exchanges.
By identifying the currencies that are in the overbought (+50) and oversold (-50) areas, it is possible to anticipate the correction of a currency pair following a strong trend.
THE THEORY BEHIND
1) At the base of everything is the 1-period momentum (close-open) of the single currency pairs that contain a certain currency. For example, the momentum of the USD currency is composed of all the exchange rates that contain the US dollar inside it: mom_usd = - mom_eurusd - mom_gbpusd + mom_usdchf + mom_usdjpy - mom_audusd + mom_usdcad - mom_nzdusd. Where the base currency is in second position, the momentum is subtracted instead of adding it.
2) The IST formula is applied to the momentum of the individual currencies obtained. In this way we get an oscillator that oscillates between 0 and its overbought and oversold areas. The area between +25 and -25 is an area in which we can consider the movements of individual currencies to be neutral.
3) The TSI is nothing more than a double smoothing on the momentum of individual currencies. This particularity makes the indicator very reactive, minimizing the delays of the trend reversal.
HOW TO USE
1) A currency is identified that is in the overbought (+50) or oversold (-50) area. Example GBP = 50
2) The second currency is identified as the one most opposite to the first. Example USD = -25
3) The currency pair consisting of the two currencies opens. So GBP / USD
4) Considering that GBP is oversold, we anticipate its future devaluation. So in this case we are short on GBP / SUD. Otherwise if GBP had been oversold (-50) we expect its future valuation and therefore we enter long.
5) It is used on the H1, H4 and D1 timeframes
6) Closing conditions: the position on the 50-period exponential moving average is split / the position at target on the 100-period exponential moving average is closed
7) Stoploss: it is recommended not to use it, if you want to use it it is equivalent to 5 times the ATR on the reference timeframe
8) Position sizing: go very slow! Being a counter-trend strategy, it is very risky to position yourself heavily. Use common sense in everything!
9) To insert the alerts that warn you of an overbought and oversold condition, it is necessary to enter the signals called "Overbought Signal" and "Oversold Signal" for each chart used, in the specific Trading View window. like me using multiple charts in the same window.
I hope you enjoy my work. For any questions write in the comments.
Thanks <3
//--------------------------------------------------------------------------------------------------------------------------------------------------------------------------------------------------------------
TENGO A PRECISARE DUE COSE:
- L'indicatore non è stato assolutamente ideato da me, non mi assumo nessun merito e tanto meno li voglio, io sto solo rendendo questo fantastico indicatore open source ed accessibile a tutti
- Il codice dello script non è stato riciclato da altri indicatori, ma è stato creato da 0 seguendo alla lettere la teoria che sta alla sua base, evitando così di violare il copyright
- Si accettano consigli e migliorie, visto che avendo pochissima esperienza di programmazione in Pine Script considero questo lavoro ancora grezzo e lento
COS'È IL FOTSI?
Il FOTSI è un oscillatore che misura la forza relativa delle singole valute che compongono i 28 cambi major del Forex.
Individuando le valute che si trovano nelle aree di ipercomprato (+50) ed ipervenduto (-50) , è possibile anticipare la correzione di una coppia valutaria al seguito di un forte trend.
LA TEORIA ALLA BASE
1) Alla base di tutto c'è il momentum ad 1 periodo (close-open) delle singole coppie valutarie che contengono una determinata valuta. Ad esempio il momentum della valuta USD è composto da tutti i cambi che contengono il dollaro americano al suo interno: mom_usd = - mom_eurusd - mom_gbpusd + mom_usdchf + mom_usdjpy - mom_audusd + mom_usdcad - mom_nzdusd . Ove la valuta base si trova in seconda posizione si sottrae il momentum al posto che sommarlo.
2) Si applica la formula del TSI ai momentum delle singole valute ottenute. In questo modo otteniamo un oscillatore che oscilla tra lo 0 e le sue aree di ipercomprato ed ipervenduto. L'area compresa tra +25 e -25 è un area in cui possiamo considerare neutri i movimenti delle singole valute.
3) Il TSI non è altro che un doppio smoothing sul momentum delle singole valute. Questa particolarità rende l'indicatore molto reattivo, minimizzando i ritardi dell'inversione del trend.
COME SI USA
1) Si individua una valuta che si trova nell'area di ipercomprato (+50) o ipervenduto (-50) . Esempio GBP = 50
2) Si individua come seconda valuta quella più opposta alla prima. Esempio USD = -25
3) Si apre la coppia di valuta composta dalle due valute. Quindi GBP/USD
4) Considerando che GBP è in fase di ipervenduto prevediamo una sua futura svalutazione. Quindi in questo caso entriamo short su GBP/SUD. Diversamente se GBP fosse stato in fase di ipervenduto (-50) ci aspettiamo una sua futura valutazione e quindi entriamo long.
5) Si usa sui timeframe H1, H4 e D1
6) Condizioni di chiusura: si smezza la posizione sulla media mobile esponenziale a 50 periodi / si chiude la posizione a target sulla media mobile esponenziale a 100 periodi
7) Stoploss: è consigliato non usarlo, nel caso lo si voglia utilizzare esso equivale a 5 volte l'ATR sul timeframe di riferimento
8) Position sizing: andateci molto piano! Essendo una strategia contro trend è molto rischioso posizionarsi in modo pesante. Usate il buonsenso in tutto!
9) Per inserire gli allert che ti avvertono di una condizione di ipercomprato ed ipervenduto, è necessario inserire dall'apposita finestra di Trading View i segnali denominati "Segnale di ipercomprato" ed "Segnale di ipervenduto" per ogni grafico che si usa, nel caso come me che si utilizzano più grafici nella stessa finestra.
Spero che possiate apprezzare il mio lavoro. Per qualsiasi domanda scrivete nei commenti.
Grazie<3

RSI + TSI✅ All 3 indicators in one pane
✅ RSI and RSI MA with standard zones (30, 50, 70)
✅ TSI scaled to 0–100 range for alignment with RSI
✅ Color-coded TSI fill for quick trend recognition (green = bullish, red = bearish)
✅ Compatible with TradingView v6
BH Ergodic (TSI-style) [v5]The BG Ergodic script is a custom momentum and trend-confirmation tool that builds on the classic True Strength Index (TSI) and Ergodic Oscillator concepts. It smooths price momentum over multiple exponential averages to identify underlying trend direction, exhaustion, and potential reversals with reduced noise.
Unlike a standard TSI, the BG Ergodic combines:
Dual-smoothing filters for both momentum and signal lines, giving a cleaner response in choppy markets.
Dynamic color transitions that highlight bullish and bearish phases based on crossovers and slope changes.
Optional histogram plotting to visualize the spread between the Ergodic line and its signal line for early trend-shift detection.
This indicator works best on swing or trend-following timeframes (e.g., 1H–1D) and can be used to:
Confirm trend direction before entries,
Filter false breakouts, or
Spot momentum divergence near key support/resistance zones.

MomentumSignal Kit RSI-MACD-ADX-CCI-CMF-TSI-EStoch// ----------------------------------------
// Description:
// ----------------------------------------
// MomentumKit RSI/MACD-ADX-CCI-CMF-TSI-EStoch Suite is a comprehensive momentum indicator suite designed to provide robust buy and sell signals through the consensus of multiple normalized momentum indicators. This suite integrates the following indicators:
// - **Relative Strength Index (RSI)**
// - **Stochastic RSI**
// - **Moving Average Convergence Divergence (MACD)** with enhanced logic
// - **True Strength Index (TSI)**
// - **Commodity Channel Index (CCI)**
// - **Chaikin Money Flow (CMF)**
// - **Average Directional Index (ADX)**
// - **Ehlers' Stochastic**
//
// **Key Features:**
// 1. **Normalization:** Each indicator is normalized to a consistent scale, facilitating easier comparison and interpretation across different momentum metrics. This uniform scaling allows traders to seamlessly analyze multiple indicators simultaneously without the confusion of differing value ranges.
//
// 2. **Consensus-Based Signals:** By combining multiple indicators, MomentumKit generates buy and sell signals based on the agreement among various momentum measurements. This multi-indicator consensus approach enhances signal reliability and reduces the likelihood of false positives.
//
// 3. **Overlap Analysis:** The normalization process aids in identifying overlapping signals, where multiple indicators point towards a potential change in price or momentum. Such overlaps are strong indicators of significant market movements, providing traders with timely and actionable insights.
//
// 4. **Enhanced Logic for MACD:** The MACD component within MomentumKit utilizes enhanced logic to improve its responsiveness and accuracy in detecting trend changes.
//
// 5. **Debugging Features:** MomentumKit includes advanced debugging tools that display individual buy and sell signals generated by each indicator. These features are intended for users with technical and programming skills, allowing them to:
// - **Visualize Signal Generation:** See real-time buy and sell signals for each integrated indicator directly on the chart.
// - **Adjust Signal Thresholds:** Modify the criteria for what constitutes a buy or sell signal for each indicator, enabling tailored analysis based on specific trading strategies.
// - **Filter and Manipulate Signals:** Enable or disable specific indicators' contributions to the overall buy and sell signals, providing flexibility in signal generation.
// - **Monitor Indicator Behavior:** Utilize debug plots and labels to understand how each indicator reacts to market movements, aiding in strategy optimization.
//
// **Work in Progress:**
// MomentumKit is continuously evolving, with ongoing enhancements to its algorithms and user interface. Current debugging features are designed to offer deep insights for technically adept users, allowing for extensive customization and fine-tuning. Future updates aim to introduce more user-friendly interfaces and automated optimization tools to cater to a broader audience.
//
// **Usage Instructions:**
// - **Visibility Controls:** Users can toggle the visibility of individual indicators to focus on specific momentum metrics as needed.
// - **Parameter Adjustments:** Each indicator comes with customizable parameters, allowing traders to fine-tune the suite according to their trading strategies and market conditions.
// - **Debugging Features:** Enable the debugging mode to visualize individual indicator signals and adjust their contribution to the overall buy/sell signals. This requires a basic understanding of the underlying indicators and their operational thresholds.
//
// **Benefits:**
// - **Simplified Analysis:** Normalization simplifies the process of analyzing multiple indicators, making it easier to identify consistent signals across different momentum measurements.
// - **Improved Decision-Making:** Consensus-based signals backed by multiple normalized indicators provide a higher level of confidence in trading decisions.
// - **Versatility:** Suitable for various trading styles and market conditions, MomentumKit offers a versatile toolset for both novice and experienced traders.
//
// **Technical Requirements:**
// - **Programming Knowledge:** To fully leverage the debugging and signal manipulation features, users should possess a foundational understanding of Pine Script and the mechanics of momentum indicators.
// - **Customization Skills:** Ability to adjust indicator parameters and debug filters to align with specific trading strategies.
//
// **Disclaimer:**
// This indicator suite is intended for educational and analytical purposes only and does not constitute financial advice. Trading involves significant risk, and past performance is not indicative of future results. Always conduct your own analysis or consult a qualified financial advisor before making trading decisions.

Multiple Indicator 50EMA Cross AlertsHere’s a screener including Symbol, Price, TSI, and 50 ema cross in a table output.
The 50 Exponential Moving Average is a trend indicator
You can find bullish momentum when the 50 ema crossed over or a bearish momentum when the 50 ema crossed under we are looking to take advantage by trading the reversion of these trends.
True strength index (TSI) is a trend momentum indicator
Readings are bullish when the True Strength Index shows positive values
Readings are bearish when the indicator displays negative values.
When a value is above 20, we look for selling overbought opportunity and when the value is under 20, we look for buying oversold opportunity.
You can select the pair of your choice in the settings.
Make sure to create an alert and choose any alerts then an alert will trigger when a price cross under or cross over the 50 ema for every pair separately.
This allow the user to verify if there is a trade set up or not.
Disclaimer
This post and the script don’t provide any financial advice.

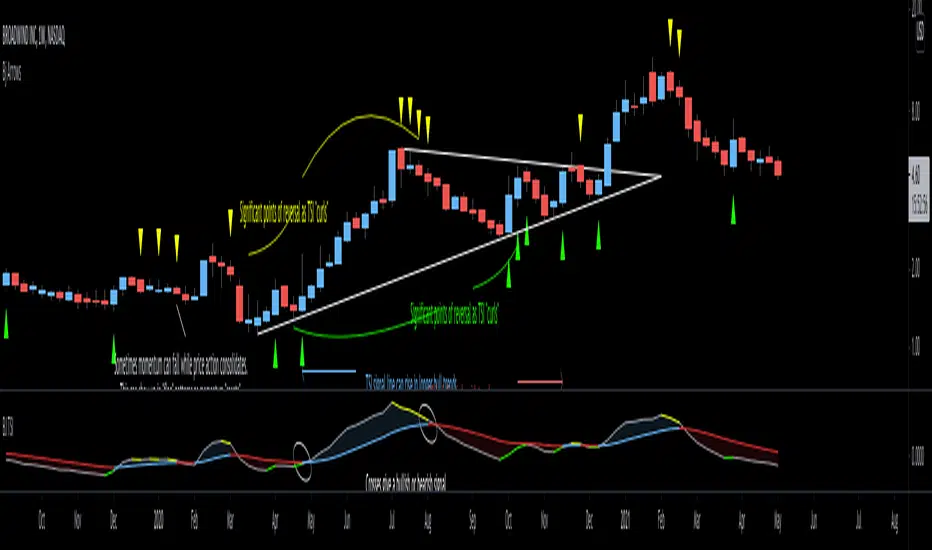
EWO Breaking Bands & XTLElliott Wave Principle, developed by Ralph Nelson Elliott , proposes that the seemingly chaotic behaviour of the different financial markets isn’t actually chaotic. In fact the markets moves in predictable, repetitive cycles or waves and can be measured and forecast using Fibonacci numbers. These waves are a result of influence on investors from outside sources primarily the current psychology of the masses at that given time. Elliott wave predicts that the prices of the a traded currency pair will evolve in waves: five impulsive waves and three corrective waves. Impulsive waves give the main direction of the market expansion and the corrective waves are in the opposite direction (corrective wave occurrences and combination corrective wave occurrences are much higher comparing to impulsive waves)
The Elliott Wave Oscillator ( EWO ) helps identifying where you are in the 5 / 3 Elliott Waves , mainly the highest/lowest values of the oscillator might indicate a potential bullish / bearish Wave 3. Mathematically expressed, EWO is the difference between a 5 period and 35 period moving average. In this study instead 35-period, Fibonacci number 34 is implemented for the slow moving average and formula becomes ewo = sma (HL2, 5) - sma (HL2, 34)
The Elliott Wave Oscillator enables traders to track Elliott Wave counts and divergences. It allows traders to observe when an existing wave ends and when a new one begins. Included with the EWO are the breakout bands that help identify strong impulses.
The Expert Trend Locator ( XTL ) was developed by Tom Joseph (in his book Applying Technical Analysis) to identify major trends, similar to Elliott Wave 3 type swings.
Blue bars are bullish and indicate a potential upwards impulse.
Red bars are bearish and indicate a potential downwards impulse.
White bars indicate no trend is detected at the moment.
Added "TSI Arrows". The arrows is intended to help the viewer identify potential turning points. The presence of arrows indicates that the TSI indicator is either "curling" up under the signal line, or "curling" down over the signal line. This can help to anticipate reversals, or moves in favor of trend direction.

Multiple Screeners with AlertsI already published few version of my custom screeners. Unfortunately, because of TradingView's security function call limit you can't use more than 40 stocks in 1 screener.
Fortunately, you can compute multiple values in your function and screen few indicators at once.
In this script I show how you can compute 5 indicators at the same time for 40 instruments. I display then in different labels.
Every label consist of list of instruments satisfying current indicator conditions and a value for it. It can be absolute value as for RSI or -1/1 representing Bullish/Bearish event.
Also you can create 1 alert with result of all screeners inside.
In this example I took 5 indicators with following conditions:
RSI - "RSI < 30" or "RSI > 70"
TSI - "TSI < -30" or "RSI >30"
ADX - "ADX > 40"
MACD - "MACD Bullish Cross" or "MACD Bearish Cross" (1 and -1 in screener)
AO - "AO Crosses 0 UP" or "AO Crosses 0 DOWN" (1 and -1 in screener)
Params
- bars_apart - this parameter define how may bars apart you labels are on your chart. If you see labels overlapping, increase this number.
- Parameters for all used indicators
- 40 symbol inputs for instruments you want to use in this screener
Alerts
You can create an alert from it easily by selecting screener name from the list and then selecting "Any alert() function call".
No additional configuration is required, message and alert on close is generated in the code.
You should better change default name for your alert. Sometimes because of big amount of inputs you might receive an error.
Disclaimer
Please remember that past performance may not be indicative of future results.
Due to various factors, including changing market conditions, the strategy may no longer perform as good as in historical backtesting.
This post and the script don’t provide any financial advice.

Linear TSITrue Strength Index (TSI) by William Blau
Here I suggest to calculate it in the linear way as it make it more smooth and acurate
buy and sell can be from -0.8 to 0.8 , can be by cross up of zero or cross down of zero
can be by slope difference as seen in color lime vs color red
one can add sma and cross or any option you think
So this nice improve to this indicator as linear line are much more smooth the regular TSI and we can get sharper signals

Moonhub IndexMoonhub Index combines several popular technical indicators to create an aggregated index that aims to give a clearer overall picture of the market. The index takes into account the current market condition (trending, ranging, or volatile) to adjust its calculations accordingly.
The indicators used in this composite index are:
Hull Moving Average (HMA)
Fisher Transform (FT)
Williams Alligator
Moving Average Convergence Divergence (MACD)
Average True Range (ATR)
On-Balance Volume (OBV)
Money Flow Index (MFI)
Accumulation/Distribution (AD)
Pivot Points
True Strength Index (TSI)
Volume-Weighted Average Price (VWAP)
The script calculates the values of each indicator and then normalizes and weighs them according to predefined weights. The composite index is formed by summing the weighted values of each indicator. The final Moon Index is plotted on the chart, along with several other related lines like the exponential moving averages (EMA) and simple moving averages (SMA) of the index.
This custom index can be used by traders to get a more comprehensive view of the market and make better-informed trading decisions based on the combined insights of multiple indicators.

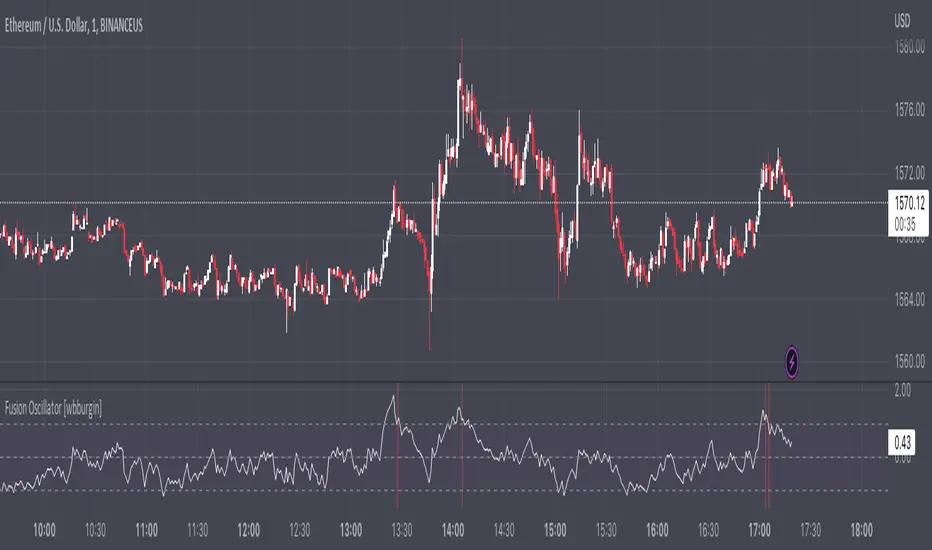
Fusion Oscillator (COMBINED RSI+MFI+MACD+CCI+TSI+RVI)The Fusion Oscillator aggregates several extremely-similar directional oscillators (RSI, MFI, MACD, CCI, TSI, RVI) into one average to visualize indicator agreement. To do this, I normalized several oscillators between to ensure equal weight.
The white line is the directional oscillator . The yellow line (turned off) is the nondirectional oscillator - namely, the ADX and ATR - this determines the buy/sell signals in conjunction with overbought/oversold levels for the directional oscillator.
The overall length is the sensitivity of the oscillator, not the lookback period. The maximum that works on the default settings is 3. Higher means less sensitive and more accurate.
I hope you all find this useful!
True Strength IndexThe True Strength Index (TSI) is a technical momentum oscillator that can help identify trends and spot reversals. This indicator was developed with about an hour of research, based on the original True Strength Index formula by William Blau. The research material used to create this indicator can be found in the script (released publicly).
Author Notes:
- The zero line is included in this script, since it's a standard feature of the True Strength Index momentum oscillator.
- I did not include support and resistance levels, as I'm still researching the best way to incorporate this, rather than using a simple horizontal line for each.
- The original True Strength Index momentum oscillator utilizes the Exponential Moving Average, but with this release, you have the option to use the Hull Moving Average (as an alternative). Feel free to experiment and adjust the settings to whatever suits your trading style.
- I plan on improving/updating this indicator, but for now, releasing this early version.
* This is being provided as is and the information provided by this script is meant for informational/entertainment purposes only.

MqsdNvr Stochastic RSI and TSIFor knowing when and where and how to start a position by the mixture of rsi and tsi on its price. Their inputs and their relations together ... .

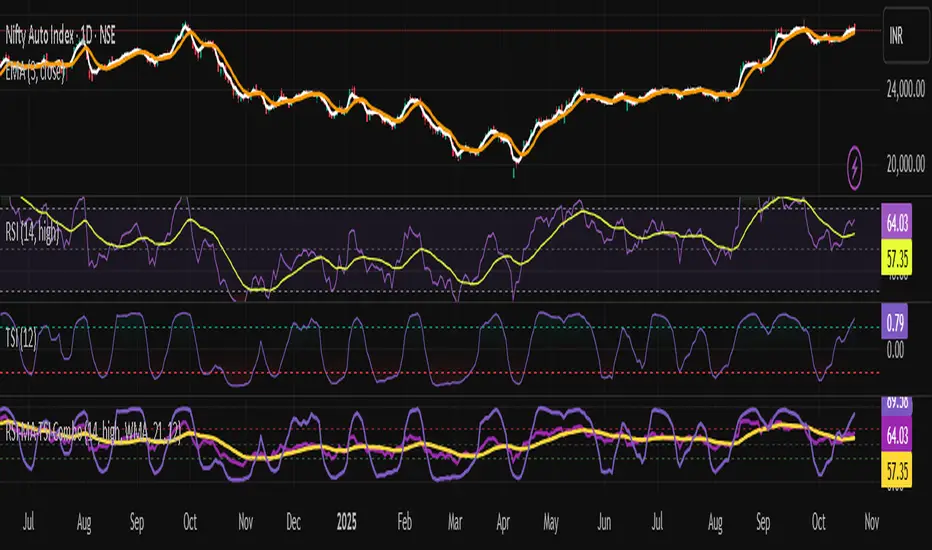
RSI + MA, LinReg, ZZ (HH HL LH LL), Div, Ichi, MACD and TSI HistRelative Strength Index with Moving Average, Linear Regression, Zig Zag (Highs and Lows), Divergence, Ichimoku Cloud, Moving Average Convergence Divergence and True Strength Index Histogram
This script is based on zdmre's RSI script, I revamped a lot of things and added a few indicators from ParkF's RSI script.
Disable Labels in the Style tab and the histogram if you don't enlarge the indicator and it seems too small.
Look to buy in the oversold area and bounce of the support of the linear regression.
Look to sell in the overbought area and bounce of the resistance of the linear regression.
Look for retracement to the moving average or horizontal lines, and divergences for potential reversal.
RSI
The Relative Strength Index (RSI) is a well versed momentum based oscillator which is used to measure the speed (velocity) as well as the change (magnitude) of directional price movements.
Moving Average
Moving Average (MA) is a good way to gauge momentum as well as to confirm trends, and define areas of support and resistance.
Linear Regression
The Linear Regression indicator visualizes the general price trend of a specific part of the chart based on the Linear Regression calculation.
Zig Zag (Highs and Lows)
The Zig Zag indicator is used to identify price trends, and in doing so plots points on the chart to mark whenever prices reverse by a larger percentage point than a predetermined variable or marker.
Divergence
The divergence indicator warns traders and technical analysts of changes in a price trend, oftentimes that it is weakening or changing direction.
Ichimoku Cloud
The Ichimoku Cloud is a package of multiple technical indicators that signal support, resistance, market trend, and market momentum.
MACD and TSI Histogram
MACD can be used to identify aspects of a security's overall trend.
The True Strength Index indicator is a momentum oscillator designed to detect, confirm or visualize the strength of a trend.

HLC True Strength Indicator (with Vix)HLC True Strength Indicator Volume Weighted with Vix Line by SpreadEagle71
This indicator is a True Strength Indicator with Close, High and Low used together, along with the TSI of the Vix.
The white line is the close. The red line is the lows and the blue is the highs. These are also volume-weighted.
How to Interpret:
1. zero line crosses. If SPY/SPX500 crosses the zero line, then its bullish. If the purple Vix line crosses up, watch out because this is bearish.
2. white/blue/red lines cross purple (Vix). If they cross upwards, this is bullish. If downward, this is bearish. Basically, SPX, ES1!, SPY or even DIA can be used. The security and the Vix should travel in opposite directions and cross the zero-line at the same time. But this is not always the case.
3. Black area infills. These are used between the close and the highs (blue) and the lows(red). Close should not be between these in order to have momentum.
4. Close (white line) leads. Close is the last price so it tends to show where the others (highs and lows) are going. If the close is sagging below a high where the blue lines are on top, this could mean that there is a reversal coming. Same holds true for a white line above a "valley" formed by the blue and red lines; it could mean a reversal to the upside soon.
5. The Black Infill areas as a squeeze or contraction/expansion area. The thinner the black infill areas, the more of a momentum "squeeze" could be present. Wide black infill areas mean increased volatility and what may come next is a reversion to the mean for volatility. See TTM Squeeze Indicator or the Squeeze Momentum Indicator (kudos LazyBear).
Lastly, just remember indicators indicate; they are not magic. :)
SpreadEagle71

Bogdan Ciocoiu - MoonshotDescription
Moonshot is an indicator that encapsulates the value delivered by the TSI, MACD, Awesome Oscillator and CCI algorithms to produce signals to enable users to enter positions in ideal market conditions. Moonshot integrates the value delivered by the above four algorithms into one script.
This indicator is particularly useful when trading continuation/reversal divergence strategies.
Uniqueness
The Moonshot's uniqueness stands from integrating the above algorithms into the same visual area and leveraging preconfigured parameters suitable for 1-3 minute scalping techniques.
In addition, Moonshot allows swapping or furthermore configuring the above four algorithms in such a way to align signals by colour-coding or shape thickness to aid the users with identifying any emerging patterns quicker.
Furthermore, Moonshot's uniqueness is also reflected in the way it has standardised the outputs of each algorithm to look and feel the same (including the scale at which the shapes are shown) and, in doing so, enables users to plug them in/out as needed.
Open-source
The indicator leverages the following open-source scripts/algorithms:
www.tradingview.com
www.tradingview.com
www.tradingview.com
www.tradingview.com
