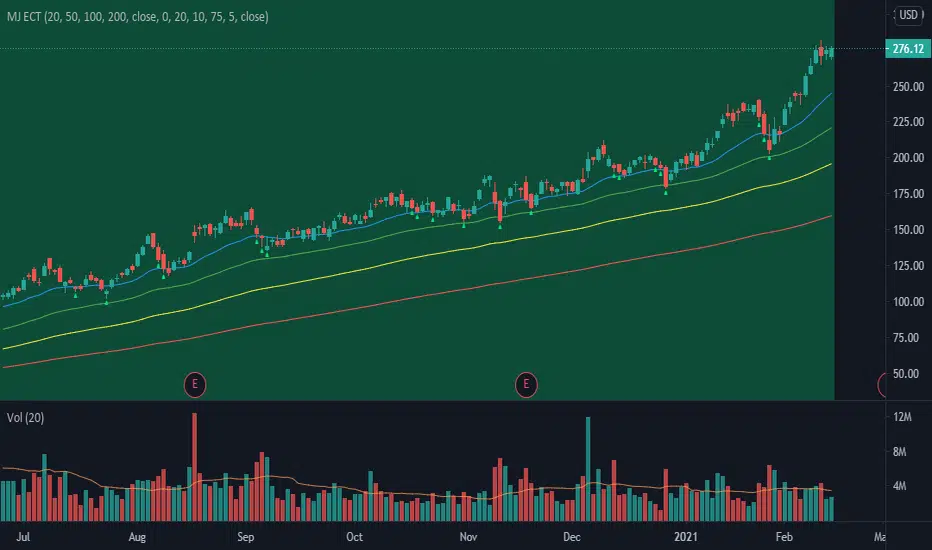
MJ ECT== One Line Introduction ==
ECT is a multi-level, trend focused technical indicator based on a three-step hierarchical approach - comprising the tide, wave, and ripple - to trend identification.
== Indicator Philosophy ==
The author believes that market trends can be understood in a three-step hierarchy, with tide at the top, wave in the middle, and ripple at the bottom, corresponding to long-, middle-, and short-term momentum in the stock price. This indicator therefore comprises three technical indicators which aims to reflect the abovementioned features of a trend. These three components are True Strength Index (TSI), Exponential Moving Averages ( EMA ), and Commodity Channel Index ( CCI ).
== Indicator Components and Breakdown ==
True Strength Index (TSI) -> Tide
A 20-period TSI is used to visualize the bullish or bearish sentiment surrounding the stock. Crossovers above the zero line are interpreted as bullish while crossovers below the zero line are interpreted as bearish . This is painted into the background where green represents bullish and red represents bearish . While the background is red ( bearish ), no bullish positions should be taken. Hence, the TSI painted background acts as a directional bias filter and going against the bias is not recommended. After understanding the directional bias, the user can delve further into the areas of value for the stock in the Wave.
Exponential Moving Averages ( EMA ) -> Wave
Four EMA are used (20, 50, 100, 200) to identify the dynamic support and resistance waves in a trending market. Stock price pullbacks into any of these EMA represent areas of value where the user can consider taking positions. The correct EMA to use depends on individual stock's behavior, with multiple bounces on a specified EMA being the priority. After understanding which wave best reflects the area of value of a stock, the user can move on to the Ripple to time their entries.
Commodity Channel Index ( CCI ) -> Ripple
A 5-period CCI is used to identify short-term oversold conditions where prices are on discount. Discount is defined by the 5-period CCI crossing below -100 as it reflects a weekly oversold condition. The indicator will display a small triangle below the candle when this condition is met.
== Ready To Deploy Field Manual ==
When background is painted red, do nothing.
When background is painted green, begin thinking of bullish opportunities.
Look for the specific EMA that has the most bounces of stock price in recent months, this is the area of value to look for buying opportunity.
For the candles that intersect the EMA you identified above, watch for the appearance of a small triangle below the candle that tells you the entry timing.
When the entry timing signal triangle appears, remember the High of that candle and buy your position when the subsequent candle breaks above this High.
If the High is not broken above in the next immediate candle, remember the newer High of the newer candle (basically follow / trail the latest High until a break above is hit).
If the background turns from green to red, stop following the High and do not enter because the market sentiment has changed to bearish .
If you are holding an existing position and the background turns red, consider exiting the position. You may consider remembering the Low of the candle and exit your position if this Low is broken below on a subsequent candle.
== Best Wishes ==
The author wishes the best success for all users of this technical indicator.
Cerca negli script per "tsi"
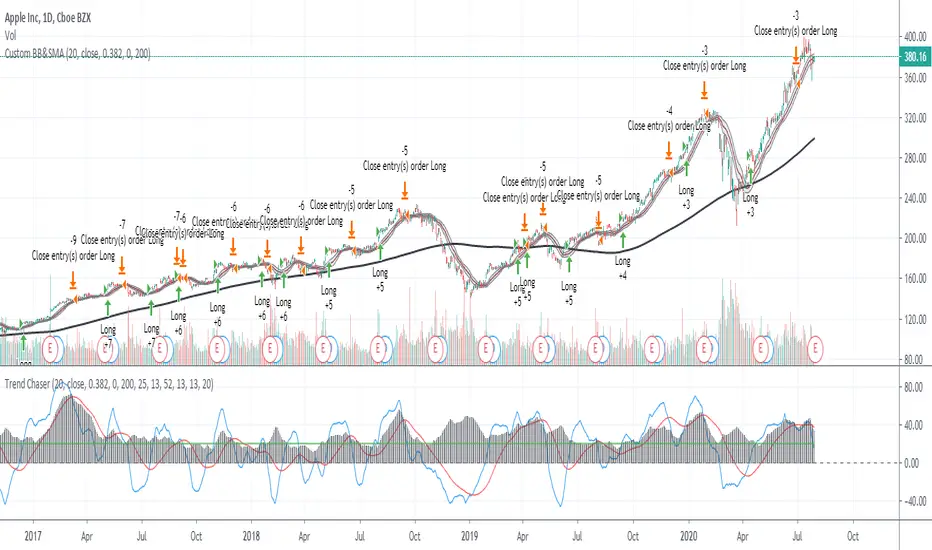
ADX_TSI_Bol Band Trend ChaserThe idea of this script is to be a low risk strategy on trending stocks (or any other trending market), aiming to achieve minimal draw down (e.g. at time of writing AAPL only had ~1.36% draw down, FB ~1.93% draw down and the SPY was 0.80% draw down and all remained profitable).
Testing proved it shouldn't be used in choppy stocks and best period was on daily charts. The back test filter goes back until 2010 so you can obtain 10 years of data.
The strategy utilizes the 200 Moving Average, a Custom Bollinger Band, a TSI with 52 period weighted moving average and ADX strength.
Although back test dates are set to 2010 - 2020, all other filters (moving average, ADX, TSI , Bollinger Band) are not locked so they can be user amended if desired. However the current settings have been tested with manual trading for quite some time to get this combination correct.
Buy signal is given when trading above the 200 moving average + 5 candles have closed above the upper custom Bollinger + the TSI is positive + ADX is above 20.
As back testing proved that this traded better only in tends then some Sell/Short conditions have been removed from the script and this only takes Long orders.
Only requires 2 additional lines of code to add shorting order and then remove the "buy" condition and this could be used for a downward trending stock instead.
Close for either long or short trades is signaled once the TSI crosses in the opposite direction indicating change in trend strength.
Further optimization could be achieved by adding a stop loss, which I may do in the future.
NOTE: This only shows the lower indicators however for visualization you can use my script "CUSTOM BOLLINGER WITH SMA", which is the upper indicators in this strategy.
This is my first attempt at coding a strategy so I'm happy to receive any feedback or hints on how this could be written better from any experienced coders!
NASDAQ:AAPL AMEX:SPY
AUTOMATIC ANALYSIS MODULE🧭 Overview
“Automatic Analysis Module” is a professional, multi-indicator system that interprets market conditions in real time using TSI, RSI, and ATR metrics.
It automatically detects trend reversals, volatility compressions, and momentum exhaustion, helping traders identify high-probability setups without manual analysis.
⚙️ Core Logic
The script continuously evaluates:
TSI (True Strength Index) → trend direction, strength, and early reversal zones.
RSI (Relative Strength Index) → momentum extremes and technical divergences.
ATR (Average True Range) → volatility expansion or compression phases.
Multi-timeframe ATR comparison → detects whether the weekly structure supports or contradicts the local move.
The system combines these signals to produce an automatic interpretation displayed directly on the chart.
📊 Interpretation Table
At every new bar close, the indicator updates a compact dashboard (bottom right corner) showing:
🔵 Main interpretation → trend, reversal, exhaustion, or trap scenario.
🟢 Micro ATR context → volatility check and flow analysis (stable / expanding / contracting).
Each condition is expressed in plain English for quick decision-making — ideal for professional traders who manage multiple charts.
📈 How to Use
1️⃣ Load the indicator on your preferred asset and timeframe (recommended: Daily or 4H).
2️⃣ Watch the blue line message for the main trend interpretation.
3️⃣ Use the green line message as a volatility gauge before entering.
4️⃣ Confirm entries with your own strategy or price structure.
Typical examples:
“Possible bullish reversal” → early accumulation signal.
“Compression phase → wait for breakout” → avoid premature trades.
“Confirmed uptrend” → trend continuation zone.
⚡ Key Features
Real-time auto-interpretation of TSI/RSI/ATR signals.
Detects both bull/bear traps and trend exhaustion zones.
Highlights volatility transitions before breakouts occur.
Works across all assets and timeframes.
No repainting — stable on historical data.
✅ Ideal For
Swing traders, position traders, and institutional analysts who want automated context recognition instead of manual indicator reading.

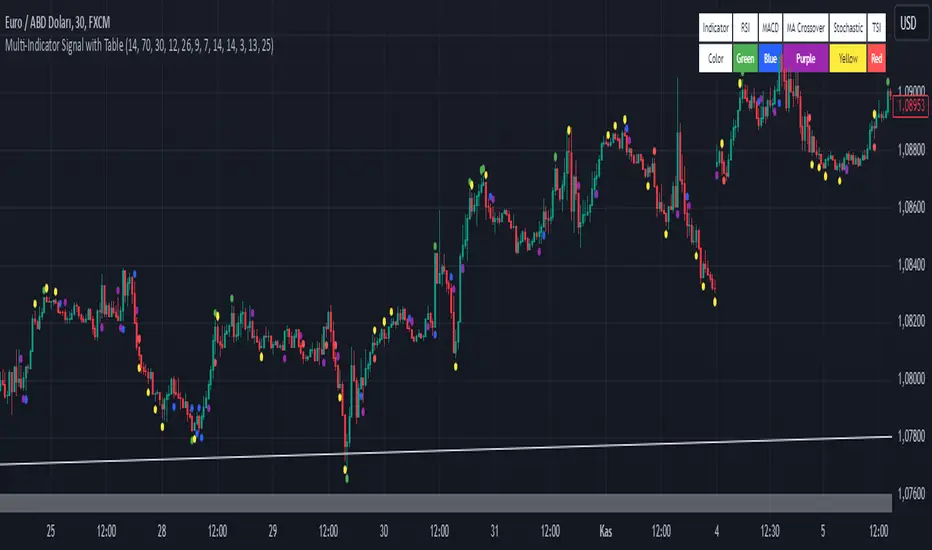
Multi-Indicator Signal with TableThis indicator is a versatile multi-indicator tool designed for traders who want to combine signals from various popular indicators into a single framework. It not only visualizes buy and sell signals but also provides a clear, easy-to-read table that summarizes the included indicators and their respective signal colors.
Key Features:
RSI (Relative Strength Index):
Buy Signal: RSI falls below the oversold level (default: 30).
Sell Signal: RSI rises above the overbought level (default: 70).
Signal Color: Green.
MACD (Moving Average Convergence Divergence):
Buy Signal: MACD line crosses above the signal line.
Sell Signal: MACD line crosses below the signal line.
Signal Color: Blue.
MA Crossover (Moving Average Crossover):
Buy Signal: Short EMA (default: 7) crosses above Long SMA (default: 14).
Sell Signal: Short EMA crosses below Long SMA.
Signal Color: Purple.
Stochastic Oscillator:
Buy Signal: Stochastic %K falls below 20 and crosses above %D.
Sell Signal: Stochastic %K rises above 80 and crosses below %D.
Signal Color: Yellow.
TSI (True Strength Index):
Buy Signal: TSI crosses above the zero line.
Sell Signal: TSI crosses below the zero line.
Signal Color: Red.
Dynamic Signal Table:
A clean, compact table displayed at the top-right corner of the chart, summarizing the indicators and their respective signal colors for quick reference.
Customization:
All indicator parameters are fully adjustable, allowing users to fine-tune settings to match their trading strategy.
Signal colors and table design ensure a visually intuitive experience.
Usage:
This tool is ideal for traders who prefer a multi-indicator approach for generating buy/sell signals.
The combination of different indicators helps to filter out noise and increase the accuracy of trade setups.
Notes:
Signals appear only after the confirmation of the current bar to avoid false triggers.
This indicator is designed for educational purposes and should be used in conjunction with proper risk management strategies.
Goethe B - Mutiple Leading Indicator PackageGoethe B is an Indicator Package that contains multiple leading and lagging indicators.
The background is that shows the local trend is calculated by either two Moving Averages or by a Kumo Cloud. By default the Kumo Cloud calculation is used.
What is the main oscillator?
- The main oscillator is TSV, or time segmented volume. It is one of the more interesting leading indicators.
What is the top bar?
-The top bar shows a trend confirmation based on the wolfpack ID indicator.
What are those circles on the second top bar?
-Those are Divergences of an internally calculated PVT oscillator. Red for Regular-Bearish, Green for Regular-Bullish.
What are those circles on the main oscillator?
-These are Divergences. Red for Regular-Bearish. Orange for Hidden-Bearish. Green for Regular-Bullish. Aqua for Hidden-Bullish.
What are those circles on the second lower bar?
-Those are Divergences of an internally calculated CCI indicator. Red for Regular-Bearish, Green for Regular-Bullish.
What is the lower bar?
-The lower bar shows a trend confirmation based on the Acceleration Oscillator, in best case it showes how far in the trend the current price action is.
What are those orange or aqua squares?
- These are TSI (true strength indicator) entry signals . They are calculated by the TSI entry signal, the TSI oscillator threshold.
Most settings of the indicator package can be modified to your liking and based on your chosen strategy might have to be modified. Please keep in mind that this indicator is a tool and not a strategy, do not blindly trade signals, do your own research first! Use this indicator in conjunction with other indicators to get multiple confirmations.

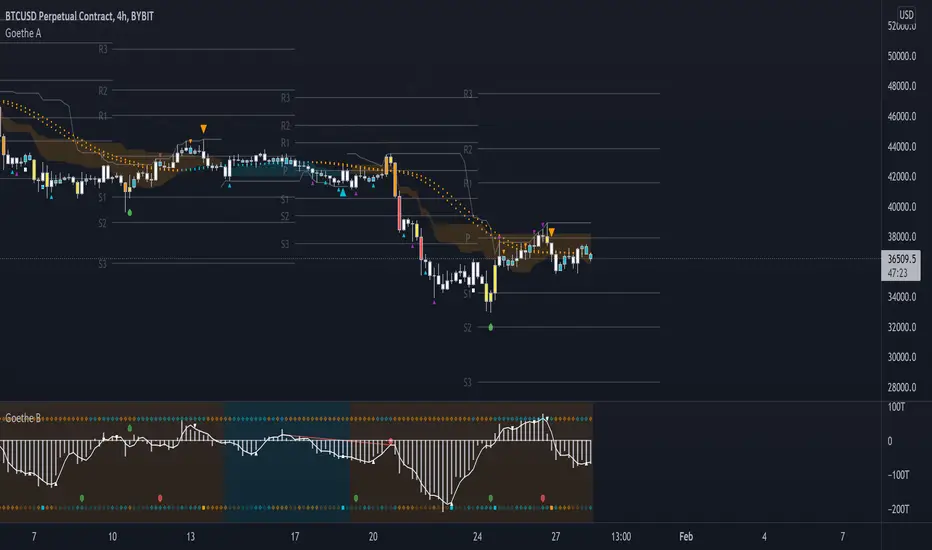
Goethe A - Multiple Leading Indicator PackageGoethe A is an Indicator Package that contains multiple leading and lagging indicators.
The background is that shows the local trend is calculated by either two Moving Averages or by a Kumo Cloud. By default the Kumo Cloud calculation is used.
What are those circles?
-These are OBV (or VPT, can be set in the options) Divergences. Red for Regular-Bearish. Orange for Hidden-Bearish. Green for Regular-Bullish. Aqua for Hidden-Bullish.
What this middle line?
-The middle line is calculated by a smoothed Heikin-Ashi indicator. I can be used as a dynamic zone of support and resistance. Many times this indicator is used as entry signal giver in trend following strategies.
What are those background lines?
-The background contains a simple Daily Pivots indicator. This indicator can be read as zones of Support and Resistance that updated based on the used timeframe.
What is this smaller thin grey line?
-This is a very simple Stoploss indicator based on Donchian Channels. The trade direction is based and calculated by the local trend (background color)
What are those small orange or aqua triangles?
- These are Pivots . They show when the OBV or wolfpack oscillators (or a double confirmation of both) might reverse, this is important to know because many times the price action follows this move.
What are those purple triangles?
- These are Pivots . They show when the PVT oscillator might reverse, this is important to know because many times the price action follows this move.
What are those big orange or aqua triangles?
- These are TSI (true strength indicator) entry signals . They are calculated by the TSI entry signal, the TSI oscillator treshold and in conjunction with the overall local trend (background color).
What are those white squares?
- These are Overbought or Oversold regions of the build-in RSI bands indicator. Every time the price crosses one of the RSI bands those squares are printed. Most of the time this happens after a move and indicates that this strong move has come to an end.
Most settings of the indicator package can be modified to your liking and based on your chosen strategy might have to be modified. Please keep in mind that this indicator is a tool and not a strategy, do not blindly trade signals, do your own research first! Use this indicator in conjunction with other indicators to get multiple confirmations.
pandas_taLibrary "pandas_ta"
Level: 3
Background
Today is the first day of 2022 and happy new year every tradingviewers! May health and wealth go along with you all the time. I use this chance to publish my 1st PINE v5 lib : pandas_ta
This is not a piece of cake like thing, which cost me a lot of time and efforts to build this lib. Beyond 300 versions of this script was iterated in draft.
Function
Library "pandas_ta"
PINE v5 Counterpart of Pandas TA - A Technical Analysis Library in Python 3 at github.com
The Original Pandas Technical Analysis (Pandas TA) is an easy to use library that leverages the Pandas package with more than 130 Indicators and Utility functions and more than 60 TA Lib Candlestick Patterns.
I realized most of indicators except Candlestick Patterns because tradingview built-in Candlestick Patterns are even more powerful!
I use this to verify pandas_ta python version indicators for myself, but I realize that maybe many may need similar lib for pine v5 as well.
Function Brief Descriptions (Pls find details in script comments)
bton --> Binary to number
wcp --> Weighted Closing Price (WCP)
counter --> Condition counter
xbt --> Between
ebsw --> Even Better SineWave (EBSW)
ao --> Awesome Oscillator (AO)
apo --> Absolute Price Oscillator (APO)
xrf --> Dynamic shifted values
bias --> Bias (BIAS)
bop --> Balance of Power (BOP)
brar --> BRAR (BRAR)
cci --> Commodity Channel Index (CCI)
cfo --> Chande Forcast Oscillator (CFO)
cg --> Center of Gravity (CG)
cmo --> Chande Momentum Oscillator (CMO)
coppock --> Coppock Curve (COPC)
cti --> Correlation Trend Indicator (CTI)
dmi --> Directional Movement Index(DMI)
er --> Efficiency Ratio (ER)
eri --> Elder Ray Index (ERI)
fisher --> Fisher Transform (FISHT)
inertia --> Inertia (INERTIA)
kdj --> KDJ (KDJ)
kst --> 'Know Sure Thing' (KST)
macd --> Moving Average Convergence Divergence (MACD)
mom --> Momentum (MOM)
pgo --> Pretty Good Oscillator (PGO)
ppo --> Percentage Price Oscillator (PPO)
psl --> Psychological Line (PSL)
pvo --> Percentage Volume Oscillator (PVO)
qqe --> Quantitative Qualitative Estimation (QQE)
roc --> Rate of Change (ROC)
rsi --> Relative Strength Index (RSI)
rsx --> Relative Strength Xtra (rsx)
rvgi --> Relative Vigor Index (RVGI)
slope --> Slope
smi --> SMI Ergodic Indicator (SMI)
sqz* --> Squeeze (SQZ) * NOTE: code sufferred from very strange error, code was commented.
sqz_pro --> Squeeze PRO(SQZPRO)
xfl --> Condition filter
stc --> Schaff Trend Cycle (STC)
stoch --> Stochastic (STOCH)
stochrsi --> Stochastic RSI (STOCH RSI)
trix --> Trix (TRIX)
tsi --> True Strength Index (TSI)
uo --> Ultimate Oscillator (UO)
willr --> William's Percent R (WILLR)
alma --> Arnaud Legoux Moving Average (ALMA)
xll --> Dynamic rolling lowest values
dema --> Double Exponential Moving Average (DEMA)
ema --> Exponential Moving Average (EMA)
fwma --> Fibonacci's Weighted Moving Average (FWMA)
hilo --> Gann HiLo Activator(HiLo)
hma --> Hull Moving Average (HMA)
hwma --> HWMA (Holt-Winter Moving Average)
ichimoku --> Ichimoku Kinkō Hyō (ichimoku)
jma --> Jurik Moving Average Average (JMA)
kama --> Kaufman's Adaptive Moving Average (KAMA)
linreg --> Linear Regression Moving Average (linreg)
mgcd --> McGinley Dynamic Indicator
rma --> wildeR's Moving Average (RMA)
sinwma --> Sine Weighted Moving Average (SWMA)
ssf --> Ehler's Super Smoother Filter (SSF) © 2013
supertrend --> Supertrend (supertrend)
xsa --> X simple moving average
swma --> Symmetric Weighted Moving Average (SWMA)
t3 --> Tim Tillson's T3 Moving Average (T3)
tema --> Triple Exponential Moving Average (TEMA)
trima --> Triangular Moving Average (TRIMA)
vidya --> Variable Index Dynamic Average (VIDYA)
vwap --> Volume Weighted Average Price (VWAP)
vwma --> Volume Weighted Moving Average (VWMA)
wma --> Weighted Moving Average (WMA)
zlma --> Zero Lag Moving Average (ZLMA)
entropy --> Entropy (ENTP)
kurtosis --> Rolling Kurtosis
skew --> Rolling Skew
xev --> Condition all
zscore --> Rolling Z Score
adx --> Average Directional Movement (ADX)
aroon --> Aroon & Aroon Oscillator (AROON)
chop --> Choppiness Index (CHOP)
xex --> Condition any
cksp --> Chande Kroll Stop (CKSP)
dpo --> Detrend Price Oscillator (DPO)
long_run --> Long Run
psar --> Parabolic Stop and Reverse (psar)
short_run --> Short Run
vhf --> Vertical Horizontal Filter (VHF)
vortex --> Vortex
accbands --> Acceleration Bands (ACCBANDS)
atr --> Average True Range (ATR)
bbands --> Bollinger Bands (BBANDS)
donchian --> Donchian Channels (DC)
kc --> Keltner Channels (KC)
massi --> Mass Index (MASSI)
natr --> Normalized Average True Range (NATR)
pdist --> Price Distance (PDIST)
rvi --> Relative Volatility Index (RVI)
thermo --> Elders Thermometer (THERMO)
ui --> Ulcer Index (UI)
ad --> Accumulation/Distribution (AD)
cmf --> Chaikin Money Flow (CMF)
efi --> Elder's Force Index (EFI)
ecm --> Ease of Movement (EOM)
kvo --> Klinger Volume Oscillator (KVO)
mfi --> Money Flow Index (MFI)
nvi --> Negative Volume Index (NVI)
obv --> On Balance Volume (OBV)
pvi --> Positive Volume Index (PVI)
dvdi --> Dual Volume Divergence Index (DVDI)
xhh --> Dynamic rolling highest values
pvt --> Price-Volume Trend (PVT)
Remarks
I also incorporated func descriptions and func test script in commented mode, you can test the functino with the embedded test script and modify them as you wish.
This is a Level 3 free and open source indicator library.
Feedbacks are appreciated.
This is not the end of pandas_ta lib publication, but it is start point with pine v5 lib function and I will add more and more funcs into this lib for my own indicators.
Function Name List:
bton()
wcp()
count()
xbt()
ebsw()
ao()
apo()
xrf()
bias()
bop()
brar()
cci()
cfo()
cg()
cmo()
coppock()
cti()
dmi()
er()
eri()
fisher()
inertia()
kdj()
kst()
macd()
mom()
pgo()
ppo()
psl()
pvo()
qqe()
roc()
rsi()
rsx()
rvgi()
slope()
smi()
sqz_pro()
xfl()
stc()
stoch()
stochrsi()
trix()
tsi()
uo()
willr()
alma()
wcx()
xll()
dema()
ema()
fwma()
hilo()
hma()
hwma()
ichimoku()
jma()
kama()
linreg()
mgcd()
rma()
sinwma()
ssf()
supertrend()
xsa()
swma()
t3()
tema()
trima()
vidya()
vwap()
vwma()
wma()
zlma()
entropy()
kurtosis()
skew()
xev()
zscore()
adx()
aroon()
chop()
xex()
cksp()
dpo()
long_run()
psar()
short_run()
vhf()
vortex()
accbands()
atr()
bbands()
donchian()
kc()
massi()
natr()
pdist()
rvi()
thermo()
ui()
ad()
cmf()
efi()
ecm()
kvo()
mfi()
nvi()
obv()
pvi()
dvdi()
xhh()
pvt()

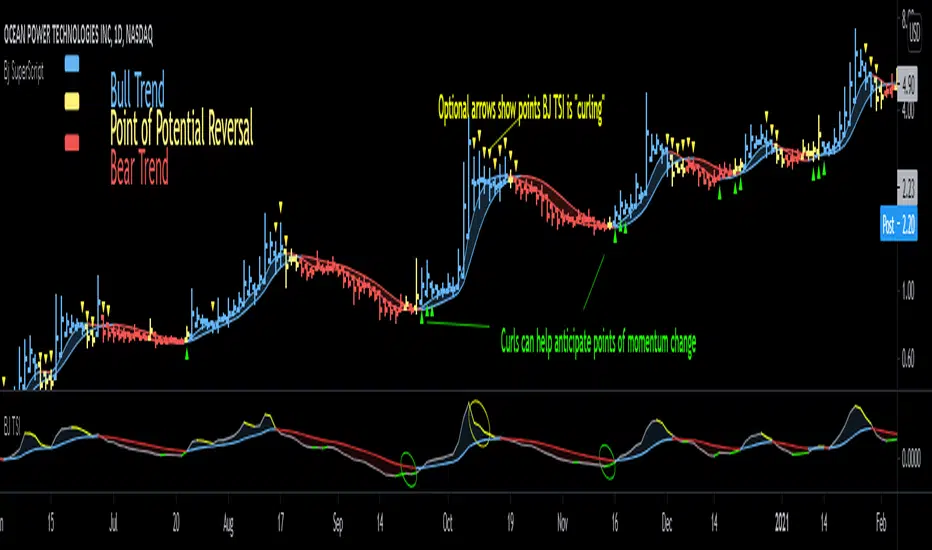
Bjorgum SuperScript
Bjorgum Reversal
Bj Reversal uses Tilson moving averages to identify trend changes
Bars change to yellow as bar close crosses the Tilson moving averages. Blue or red is confirmed as the two Tilson averages themselves cross.
Reversal is great for pinpointing trend change often giving the absolute best entry or exit
Its sensitive nature can mean more false signals on some assets
Be sure to use other indicators from the Bjorgum Collection to confirm signals, or use another strategy that fits the asset or time frame being viewed
Bjorgum HEMA Strategy
Hema uses HA smoothed EMAs to identify trend direction
Default EMA lengths are 5,9, and 21 period
Bar Color will change Malibu or Ruby on a cross of BOTH 5 and 9 EMA
The lengths are customizable to whatever lengths the user desires
Rolando Santos True Relative Movement (TRM)
This underrated momentum strategy conceptualized by Rolando Santos uses 2 indicators to give a 3 color scheme
A leading indicator (RSI) is combined with a lagging indicator (TSI) to produce bar colors based on the condition of each indicator
Both indicators in positive territory produce blue bars
Both indicators in negative bias produce yellow bars
If signals are mixed (one up one down) bars become grey
Speed Selection
The Bjorgum speed selector optimizes the strategy based on the users desires or trading style at the touch of a button
Fast setting is better for swing trades - more timely signals, more whipsaw
Slow setting is better for longer holds or more volatile assets - slower signals, smooths out whipsaw
RSI Bar Color
RSI color changes bar color based on user defined RSI values
Buy/ sell signals are typically given on a cross of the 50 level
Speed selector (fast/Slow) automatically changes lengths between Bj RSI (5 period) and a standard RSI (14 period)
Additional capabilities can be mixed and matched from strategies in the "Strategy Override" section
Add-ons include:
Tilson - The moving average system from Bjorgum Reversal can be toggled to couple with another bar color strategy by clicking this button
PSAR - Parabolic Stop and Reverse indicator can help with trend direction, volatility, and stop losses
HEMA - The 3 moving average system from the HEMA strategy can be coupled with any of the other strategies by clicking "Show HEMA"
Bj Arrows - These arrows plot at the bar level to draw attention to when the BJ TSI is "curling" (See profile for Bjorgum TSI and download today)
-Optional "Plotbar Overlay" plots bars with Heikin-Ashi Inputs when toggled
-This allows for the benefits of price smoothing without sacrificing moving average and indicator performance as real close value is still used
-This can also help on short time frames and improve results with crypto! The user must "mute" the main series candles when in use to avoid candle overlap.
-Optional price line as muting main bars will disable the TradingView default price line. The horizontal plot will track the real closing price while in HA mode!
Sebastine All in One Indicator Sebastine All in One Indicator
Introduction
Markets speak in many dialects.
Sometimes they whisper through volume, sometimes they shout via momentum, at times they breathe through volatility, and occasionally they leave footprints in OBV, PVT, RSI, or TSI.
Most traders respond by stacking indicator after indicator—until the chart resembles a tangled fishing net.
This indicator was built to untangle that net.
Instead of plotting multiple indicators simultaneously, this tool lets you focus on one dimension of market behavior at a time, while preserving structure through a Darvas-style box framework.
The box logic used here is inspired by Darvas-style structural bounding, applied to non-price data such as volume, momentum, and volatility.
🔍 What This Indicator Does
• Combines Volume, OBV, PVT, RSI, Momentum, Volatility, TSI, and Supertrend
• Displays only one selected data stream at a time, reducing noise
• Wraps the selected indicator inside a dynamic Darvas-style box
• Highlights:
o Breakouts & breakdowns
o Compression (energy build-up)
o Structural shifts
o Momentum inflections
o Mean-reversion zones
Think of it as one lens, many filters—you rotate the lens, not clutter the chart.
🧠 How to Use It (Practical Insight)
• Volume / OBV / PVT → Institutional intent & accumulation/distribution
• Momentum / RSI / TSI → Strength, exhaustion, and early reversals
• Volatility → Expansion after contraction (the market’s deep breath)
• Supertrend (as data source) → Trend structure without price bias
The Darvas-style box adds context:
• Narrow boxes = stored energy
• Box expansion = energy release
• Source touching box edges = reaction zones
• Zero-line crossings = regime shifts (where applicable)
• 🎯 Who Is This For?
• Traders who want clarity over clutter
• Discretionary traders who adapt tools to market phase
• System builders seeking structure with flexibility
• Anyone who believes less noise = more signal
📝 Points to Note (Important for Proper Interpretation)
1. Color Coding & Structure
• The upper box line (green) represents the upper structural boundary
• The lower box line (red) represents the lower structural boundary
• The white step-line represents the selected source indicator (e.g., PVT, RSI, Momentum)
2. Pane Scaling & Visibility (Very Important)
• This indicator is designed for use in the bottom pane
• Different sources have very different numerical ranges:
o RSI is bounded between 0 and 100
o PVT, OBV, and Volume can have large absolute values
• Users should manually drag and scale the indicator vertically for optimal visibility
• This is intentional and preserves the raw integrity of each data source rather than force-normalizing it
3. Histogram for Comparative Insight
• A histogram of the selected source is included for quick visual comparison
• Helps identify expansion, contraction, acceleration, and divergence, especially during compression phases inside the box
📌 Recommended Usage (Clarity Over Clutter)
Although multiple sources are available, it is strongly recommended to use one chart with one selected source at a time for best clarity and analytical depth.
For first-time users, PVT (Price Volume Trend) is an ideal starting point.
It blends price movement and volume flow into a single continuous narrative and often reveals institutional participation earlier than price alone. PVT works especially well within the Darvas-style box framework.
Once comfortable, users may switch to RSI, Momentum, Volatility, OBV, or other sources—but always one at a time. This preserves the philosophy of focused observation rather than indicator overload.
🌱 Philosophy Behind the Tool
This indicator rewards patience and observation.Give it space.
It will quietly show when the market is gathering energy—and when it is ready to move.
Markets don’t change indicators. We change how we listen.
This indicator doesn’t predict. It reveals.
Think of it not as a dashboard, but as a rotating telescope—you change lenses, not skies.

AIO Oscillator SuiteOverview
The AIO Oscillator Suite is a comprehensive, all-in-one technical analysis tool designed to declutter your chart and streamline your workflow. Instead of constantly adding, removing, and re-configuring different oscillators, this script allows you to switch between 30+ of the most popular and effective momentum, trend, and volatility indicators from a single dropdown menu.
Whether you are a trend follower, a mean-reversion trader, or a volatility analyst, this suite provides instant access to the tools you need without consuming multiple indicator slots on your chart.
Features & Included Indicators
This suite includes a vast array of oscillators, meticulously coded to match standard calculations. You can instantly toggle between:
Momentum & Trend : RSI, Stochastic, Stoch RSI, MACD, PPO, TSI, Williams %R, Momentum (ROC), Ultimate Oscillator, CMO, Connors RSI.
Volatility : ATR, Bollinger %b, Choppiness Index.
Volume-Based : Money Flow Index (MFI), Chaikin Money Flow (CMF), Chaikin Oscillator, Force Index, Ease of Movement (EOM), OBV Oscillator, ADX/DMI.
Advanced/Specialized : TRIX, KST, Aroon, Fisher Transform, Cyber Cycle, Vortex, Balance of Power (BOP), Relative Vigor Index (RVI), Detrended Price Oscillator (DPO).
How It Works
Dynamic Plotting: The script intelligently adjusts the plotting style based on your selection. It automatically renders upper/lower bands (e.g., 70/30 for RSI), midlines (0 lines for MACD), histograms, or signal lines depending on the specific requirements of the chosen indicator.
Clean Interface: To keep your chart pristine, all input parameters (lengths, sources, smoothing factors) are hidden from the status line. You only see the current value of the indicator, ensuring a distraction-free analysis environment.
Customization: Every indicator retains its full set of customizable settings. You can tweak lengths, smoothing types (RMA, SMA, EMA, WMA), and sources within the settings menu.
Level Overrides: By default, the script uses standard levels for each indicator (e.g., 70/30 for RSI, 100/-100 for CCI). However, you can enable the "Override Default Levels" option in the settings to manually define your own Upper, Lower, and Midline values for any indicator.
How to Use
Add the indicator to your chart.
Open the Settings menu.
Under the "Main Settings" group, use the dropdown menu to select your desired indicator (default is RSI).
Adjust the specific parameters for that indicator in the sections below if necessary.
(Optional) To set custom overbought/oversold levels, check the "Override Default Levels?" box and enter your preferred values.
Benefits for Traders
Efficiency: Save time by not having to search for and load different scripts for every analysis technique.
Space Saving: TradingView limits the number of indicators per chart based on your plan. This script counts as only one indicator but functions as thirty.
Comparative Analysis: Quickly cycle through different oscillators to confirm signals. For example, if you see a divergence on RSI, you can instantly check if the same divergence exists on the Stochastic or TSI without leaving the screen.
Disclaimer
This tool is for informational and educational purposes only. It does not constitute financial advice or a recommendation to trade. Technical indicators should be used as part of a comprehensive trading strategy. Past performance is not indicative of future results. Always practice proper risk management.
Open Source
The code is published as open-source to allow the community to verify calculations, learn from the logic, and customize it further if needed.

saodisengxiaoyu-lianghua-2.1- This indicator is a modular, signal-building framework designed to generate long and short signals by combining a chosen leading indicator with selectable confirmation filters. It runs on Pine Script version 5, overlays directly on price, and is built to be highly configurable so traders can tailor the signal logic to their market, timeframe, and trading style. It includes a dashboard to visualize which conditions are active and whether they validate a signal, and it outputs clear buy/sell labels and alert conditions so you can automate or monitor trades with confidence.
Core Design
- Leading Indicator: You choose one primary signal generator from a broad list (for example, Range Filter, Supertrend, MACD, RSI, Ichimoku, and many others). This serves as the anchor of the system and determines when a preliminary long or short setup exists.
- Confirmation Filters: You can enable additional filters that validate the leading signal before it becomes actionable. Each “respect…” input toggles a filter on or off. These filters include popular tools like EMA, 2/3 EMA crosses, RQK (Nadaraya Watson), ADX/DMI, Bollinger-based oscillators, MACD variations, QQE, Hull, VWAP, Choppiness Index, Damiani Volatility, and more.
- Signal Expiry: To avoid waiting indefinitely for confirmations, the indicator counts how many consecutive bars the leading condition holds. If confirmations do not align within a defined number of bars, the setup expires. This controls latency and helps reduce late or stale entries.
- Alternating Signals: An optional mode enforces alternation (long must follow short and vice versa), helping avoid repeated entries in the same direction without a meaningful reset.
- Aggregation Logic: The final long/short conditions are formed by combining the leading condition with all selected confirmation filters through logical conjunction. Only if all enabled filters validate the signal (within expiry constraints) does the indicator consider it a confirmed long or short.
- Visualization and Alerts: The script plots buy/sell labels at signal points, provides alert conditions for automation, and displays a compact dashboard summarizing the leading indicator’s status and each confirmation’s pass/fail result using checkmarks.
Leading Indicator Options
- The indicator includes a very large menu of leading tools, each with its own logic to determine uptrend or downtrend impulses. Highlights include:
- Range Filter: Uses a dynamic centerline and bands computed via conditional EMA/SMA and range sizing to define directional movement. It can operate in a default mode or an alternative “DW” mode.
- Rational Quadratic Kernel (RQK): Applies a kernel smoothing model (Nadaraya Watson) to detect uptrends and downtrends with a focus on noise reduction.
- Supertrend, Half Trend, SSL Channel: Classic trend-following tools that derive direction from ATR-based bands or moving average channels.
- Ichimoku Cloud and SuperIchi: Multi-component systems validating trend via cloud position, conversion/base line relationships, projected cloud, and lagging span.
- TSI (True Strength Index), DPO (Detrended Price Oscillator), AO (Awesome Oscillator), MACD, STC (Schaff Trend Cycle), QQE Mod: Momentum and cycle tools that parse direction from crossovers, zero-line behavior, and momentum shifts.
- Donchian Trend Ribbon, Chandelier Exit: Trend and exit tools that can validate breakouts or sustained trend strength.
- ADX/DMI: Measures trend strength and directional movement via +DI/-DI relationships and minimum ADX thresholds.
- RSI and Stochastic: Use crossovers, level exits, or threshold filters to gate entries based on overbought/oversold dynamics or relative strength trends.
- Vortex, Chaikin Money Flow, VWAP, Bull Bear Power, ROC, Wolfpack Id, Hull Suite: A diverse set of directional, momentum, and volume-based indicators to suit different markets and styles.
- Trendline Breakout and Range Detector: Price-behavior filters that confirm signals during breakouts or within defined ranges.
Confirmation Filters
- Each filter is optional. When enabled, it must validate the leading condition for a signal to pass. Examples:
- EMA Filter: Requires price to be above a specified EMA for longs and below for shorts, filtering signals that contradict broader trend or baseline levels.
- 2 EMA Cross and 3 EMA Cross: Enforce moving average cross conditions (fast above slow for long, the reverse for short) or a three-line stacking logic for more stringent trend alignment.
- RQK, Supertrend, Half Trend, Donchian, QQE, Hull, MACD (crossover vs. zero-line), AO (zero line or AC momentum variants), SSL: Each adds its characteristic validation pattern.
- RSI family (MA cross, exits OB/OS zones, threshold levels) plus RSI MA direction and RSI/RSI MA limits: Multiple ways to constrain signals via relative strength behavior and trajectories.
- Choppiness Index and Damiani Volatility: Prevent entries during ranging conditions or insufficient volatility; choppiness thresholds and volatility states gate the trade.
- VWAP, Volume modes (above MA, simple up/down, delta), Chaikin Money Flow: Volume and flow conditions that ensure signals happen in supportive liquidity or accumulation/distribution contexts.
- ADX/DMI thresholds: Demand a minimum trend strength and directional DI alignment to reduce whipsaw trades.
- Trendline Breakout and Range Detector: Confirm that the price is breaking structure or remains within active range consistent with the leading setup.
- By combining several filters you can create strict, conservative entries or looser setups depending on your goals.
Range Filter Engine
- A core building block, the Range Filter uses conditional EMA and SMA functions to compute adaptive bands around a dynamic centerline. It supports two types:
- Type 1: The centerline updates when price exceeds the band thresholds; bands define acceptable drift ranges.
- Type 2: Uses quantized steps (via floor operations) relative to the previous centerline to handle larger moves in discrete increments.
- The engine offers smoothing for range values using a secondary EMA and can switch between raw and averaged outputs. Its hi/lo bands and centerline compose a corridor that defines directional movement and potential breakout confirmation.
Signal Construction
- The script computes:
- leadinglongcond and leadingshortcond : The primary directional signals from the chosen leading indicator.
- longCond and shortCond : Final signals formed by combining the leading conditions with all enabled confirmations. Each confirmation contributes a boolean gate. If a filter is disabled, it contributes a neutral pass-through, keeping the logic intact without enforcing that condition.
- Expiry Logic: The code counts consecutive bars where the leading condition remains true. If confirmations do not line up within the user-defined “Signal Expiry Candle Count,” the setup is abandoned and the signal does not trigger.
- Alternation: An optional state ensures that long and short signals alternate. This can reduce repeated entries in the same direction without a clear reset.
- Finally, longCondition and shortCondition represent the actionable signals after expiry and alternation logic. These drive the label plotting and alert conditions.
Visualization
- Buy and Sell Labels: When longCondition or shortCondition confirm, the script plots annotated labels directly on the chart, making entries easy to see at a glance. The labels use color coding and clear text tags (“long” vs. “short”).
- Dashboard: A table summarizes the status of the leading indicator and all confirmations. Each row shows the indicator label and whether it passed (✔️) or failed (❌) on the current bar. This intensely practical UI helps you diagnose why a signal did or did not trigger, empowering faster strategy iteration and parameter tuning.
- Failed Confirmation Markers: If a setup expires (count exceeds the limit) and confirmations failed to align, the script can mark the chart with a small label and provide a tooltip listing which confirmations did not pass. It’s a helpful audit trail to understand missed trades or prevent “chasing” invalid signals.
- Data Window Values: The script outputs signal states to the data window, which can be useful for debugging or building composite conditions in multi-indicator templates.
Inputs and Parameters
- You control the indicator from a comprehensive input panel:
- Setup: Signal expiry count, whether to enforce alternating signals, and whether to display labels and the dashboard (including position and size).
- Leading Indicator: Choose the primary signal generator from the large list.
- Per-Filter Toggles: For each confirmation, a respect... toggle enables or disables it. Many include sub-options (like MACD type, Stochastic mode, RSI mode, ADX variants, thresholds for choppiness/volatility, etc.) to fine-tune behavior.
- Range Filter Settings: Choose type and behavior; select default vs. DW mode and smoothing. The underlying functions adjust band sizes using ATR, average change, standard deviation, or user-defined scales.
- Because everything is customizable, you can adapt the indicator to different assets, volatility regimes, and timeframes.
Alerts and Automation
- The script defines alert conditions tied to longCondition and shortCondition . You can set these alerts in your chart to trigger notifications or webhook calls for automated execution in external bots. The alert text is simple, and you can configure your own message template when creating alerts in the chart, including JSON payloads for algorithmic integration.
Typical Workflow
- Select a Leading Indicator aligned with your style. For trend following, Supertrend or SSL may be appropriate; for momentum, MACD or TSI; for range/trend-change detection, Range Filter, RQK, or Donchian.
- Add a few key Confirmation Filters that complement the leading signal. For example:
- Pair Supertrend with EMA Filter and RSI MA Direction to ensure trend alignment and positive momentum.
- Combine MACD Crossover with ADX/DMI and Volume Above MA to avoid signals in low-trend or low-liquidity conditions.
- Use RQK with Choppiness Index and Damiani Volatility to only act when the market is trending and volatile enough.
- Set a sensible Signal Expiry Candle Count. Shorter expiry keeps entries timely and reduces lag; longer expiry captures setups that mature slowly.
- Observe the Dashboard during live markets to see which filters pass or fail, then iterate. Tighten or loosen thresholds and filter combinations as needed.
- For automation, turn on alerts for the final conditions and use webhook payloads to notify your trading robot.
Strengths and Practical Notes
- Flexibility: The indicator is a toolkit rather than a single rigid model. It lets you test different combinations rapidly and visualize outcomes immediately.
- Clarity: Labels, dashboard, and failed-confirmation markers make it easy to audit behavior and refine settings without digging into code.
- Robustness: The expiry and alternation options add discipline, avoiding the temptation to enter late or repeatedly in one direction without a reset.
- Modular Design: The logical gates (“respect…”) make the behavior transparent: if a filter is on, it must pass; if it’s off, the signal ignores it. This keeps reasoning clean.
- Avoiding Overfitting: Because you can stack many filters, it’s tempting to over-constrain signals. Start simple (one leading indicator and one or two confirmations). Add complexity only if it demonstrably improves your edge across varied market regimes.
Limitations and Recommendations
- No single configuration is universally optimal. Markets change; tune filters for the instrument and timeframe you trade and revisit settings periodically.
- Trend filters can underperform in choppy markets; likewise, momentum filters can false-trigger in quiet periods. Consider using Choppiness Index or Damiani to gate signals by regime.
- Use expiry wisely. Too short may miss good setups that need a few bars to confirm; too long may cause late entries. Balance responsiveness and accuracy.
- Always consider risk management externally (position sizing, stops, profit targets). The indicator focuses on signal quality; combining it with robust trade management methods will improve results.
Example Configurations
- Trend-Following Setup:
- Leading: Supertrend uptrend for longs and downtrend for shorts.
- Confirmations: EMA Filter (price above 200 EMA for long, below for short), ADX/DMI (trend strength above threshold with +DI/-DI alignment), Volume Above MA.
- Expiry: 3–4 bars to keep entries timely.
- Result: Strong bias toward sustained moves while avoiding weak trends and thin liquidity.
- Mean-Reversion to Momentum Crossover:
- Leading: RSI exits from OB/OS zones (e.g., RSI leaves oversold for long and leaves overbought for short).
- Confirmations: 2 EMA Cross (fast crossing slow in the same direction), MACD zero-line behavior for added momentum validation.
- Expiry: 2–3 bars for responsive re-entry.
- Result: Captures momentum transitions after short-term extremes, with extra confirmation to reduce head-fakes.
- Range Breakout Focus:
- Leading: Range Filter Type 2 or Donchian Trend Ribbon to detect breakouts.
- Confirmations: Damiani Volatility (avoid low-volatility false breaks), Choppiness Index (prefer trend-ready states), ROC positive/negative threshold.
- Expiry: 1–3 bars to act on breakout windows.
- Result: Better alignment to breakout dynamics, gating trades by volatility and regime.
Conclusion
- This indicator is a comprehensive, configurable framework that merges a chosen leading signal with an array of corroborating filters, disciplined expiry handling, and intuitive visualization. It’s designed to help you build high-quality entry signals tailored to your approach, whether that’s trend-following, breakout trading, momentum capturing, or a hybrid. By surfacing pass/fail states in a dashboard and allowing alert-based automation, it bridges the gap between discretionary analysis and systematic execution. With sensible parameter tuning and thoughtful filter selection, it can serve as a robust backbone for signal generation across diverse instruments and timeframes.

Trend Strength Index - ZTFThis is a modification of TradingView's default Trend Strength Index indicator.
The Trend Strength Index measures the tendency of a symbol to either trend steadily or to revert to its mean. The core idea behind TSI is that the more momentum a symbol has relative to its volatility, the more likely it is to follow a trend and less likely to revert to its mean.
This indicator analyzes price momentum using the Pearson correlation coefficient, a normalized measure of the linear relationship between time series. Its output shows the correlation between the chart's closing prices and bar index values over a defined number of bars.
A value near +1 shows that prices experienced relatively steady increases across successive bars, indicating high upward trend strength
A value near -1 shows that prices experienced relatively steady decreases across successive bars, indicating high downward trend strength
A value near 0 suggests a lack of trend strength, because prices did not demonstrate a steady positive or negative relationship with the bar index
ZTF Modification: Added a green background highlight that appears when TSI reaches 0.90 or above, providing a visual alert for extremely strong bullish trend conditions.
Credit: Based on TradingView's default Trend Strength Index indicator.

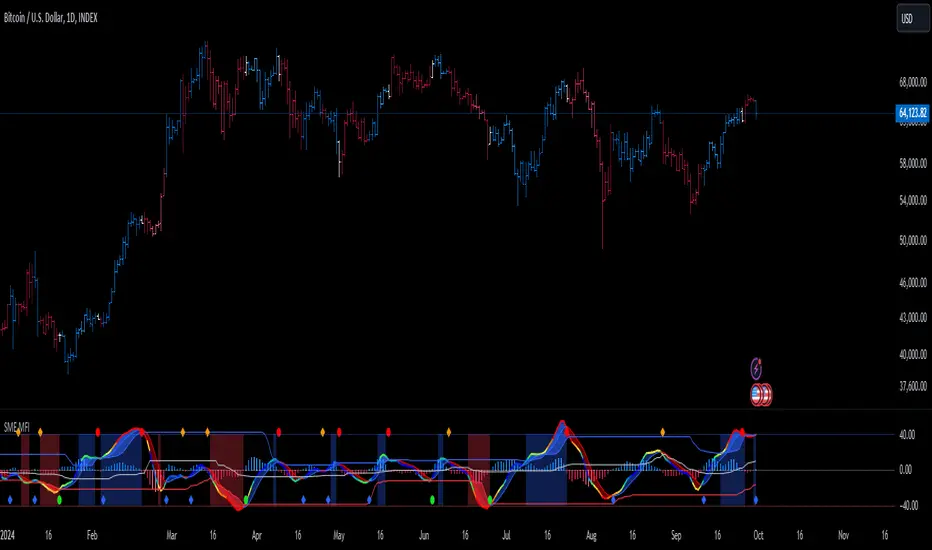
SMI Ergodic Indicator/Oscillator of Money Flow Index▮ Introduction
The Stochastic Momentum Index Ergodic (SMII) indicator is a technical analysis tool designed to predict trend reversals in the price of an asset.
It functions as a momentum oscillator, measuring the ratio of the smoothed price change to the smoothed absolute price change over a given number of previous periods.
The Ergodic SMI is based on the True Strength Index (TSI) and integrates a signal line, which is an exponential moving average (EMA) of the SMI indicator itself.
The Ergodic SMI oscillator provides a clearer picture of market trends than the traditional stochastic oscillator by incorporating the concept of 'ergodicity', which helps remove market noise.
On ther other hand, MFI (Money Flow Index) is a technical analysis indicator used to measure the inflow of money into an asset and thus help identify buying and selling pressure in a given financial instrument.
When these two indicators are combined, they can provide a more comprehensive view of price direction and market strength.
▮ Motivation: why another indicator?
By combining SMII with MFI, we can gain even more insights into the market.
One way to do this is to use the MFI as an input to the SMII, rather than just using price.
This means we are measuring momentum based on buying and selling pressure rather than just price.
Furthermore, there is the possibility of making several fine adjustments to both the calculation and visualization parameters that are not present in other indicators.
▮ What to look for
When using the SMII MFI indicator, there are a few things to look out for.
First, look at the SMII signal line.
When the line crosses above -40, it is considered a buy signal, while the crossing below +40 is considered a sell signal.
Also, pay attention to divergences between the SMII and the price.
If price is rising but the SMII is showing negative divergence, it could indicate that momentum is waning and a reversal could be in the offing.
Likewise, if price is falling but the SMII is showing positive divergence, this could indicate that momentum is building and a reversal could also be in the offing.
Divergences can be considered in both indicator and/or histogram.
Examples:
▮ Notes
The indicator presented here offers both the 'SMII' and the 'SMIO', that is, the 'Stochastic Momentum Index Ergodic Indicator' together with the 'Stochastic Momentum Index Ergodic Oscillator' (histogram), as per the documentation described in reference links.
So it is important to highlight the differences in relation to my other indicator, the 'Stochastic Momentum Index (SMI) of Money Flow Index (MFI)':
This last one is purely based on the SMI , which is implemented using SMA smoothing for the relative range and the high/low range.
Although they may seem the same in some situations, the calculation is actually different. The TSI tends to be more responsive at the expense of being noisier, while the SMI tends to be smoother. Which of these two indicators is best depends on the situation, the context, and the analyst's personal preference.
Please refer to reference links to more info.
▮ References
SMI documentation
SMII documentation
SMIO documentation
MFI documentation
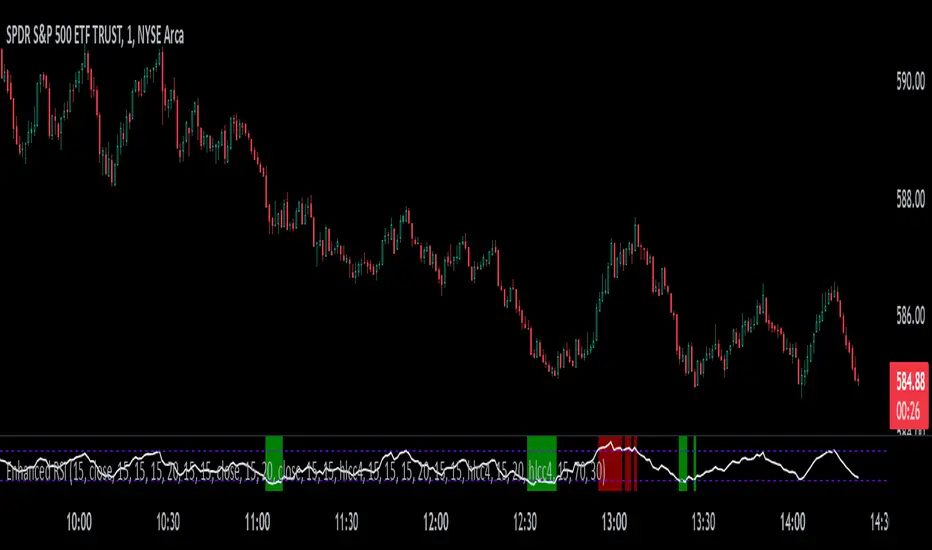
Perfect RSIOverview:
The "Enhanced RSI" is a comprehensive TradingView indicator designed to provide traders with a nuanced and detailed analysis of market conditions using the Relative Strength Index (RSI). It amalgamates various RSI calculation methods to offer a more robust and adaptable approach to technical analysis.
Originality:
This script is unique in its synthesis of multiple RSI calculation techniques, including Regular RSI, Dynamic RSI, DMI RSI, Wilder's RSI, TSI RSI, Momentum RSI, and PPO RSI. By combining these methods, the script creates a distinctive and versatile tool for traders seeking a holistic view of RSI dynamics.
How It Works:
Diverse RSI Calculations:
Regular RSI: Calculates standard RSI with user-defined length and source.
Dynamic RSI: Adjusts RSI dynamically based on price movement direction.
DMI RSI: Uses Directional Movement Index for RSI calculation.
Wilder's RSI: Implements Wilder's smoothing technique for RSI.
TSI RSI: Utilizes True Strength Index for RSI calculation.
Momentum RSI: Calculates RSI based on momentum.
PPO RSI: Applies Percentage Price Oscillator for RSI calculation.
Composite RSI:
Combines the individual RSIs into three composite indices (RSI1, RSI2, RSI) using a weighted average approach.
Dynamic Level Adjustment:
Uses the correlation coefficient to dynamically adjust overbought and oversold levels, enhancing adaptability to market changes.
Visualization and Background Coloring:
Visualizes overbought and oversold zones on the chart.
Adjusts background color based on these conditions for clearer interpretation.
How to Use:
Installation:
Copy and paste the script into the Pine Editor on TradingView.
Adjust parameters as needed.
Analysis:
Utilize the "Enhanced RSI" as a comprehensive analysis tool for RSI dynamics.
Consider it as a confirmation tool alongside other technical indicators.
Customization:
Experiment with different RSI lengths and methods to align with your trading strategy.
Backtest the script to validate its effectiveness.
Considerations:
Complexity:
The script is sophisticated; users are advised to understand each calculation method before reliance.
Parameter Sensitivity:
Effectiveness may vary based on chosen parameters; thorough backtesting and parameter optimization are recommended.
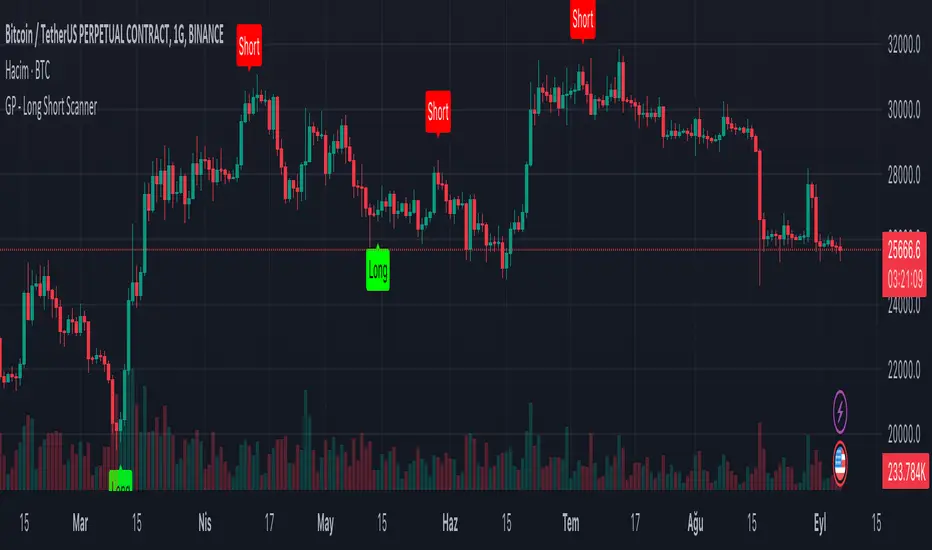
GP - Long Short ScannerThis script is made to predict the point at which price-time charts will rise or fall. The script was inspired by the RSI and TSI formulas. The formula is simply; Calculates the RSI and TSI values of open, high, low and close. Calculated values are converted to an array. The maximum and minimum values in the array are taken for the candles included in the calculation. These values calculate the time when the "Long" label will be seen on the chart of the candle that will increase the price. At the same time, it calculates the time when the "Short" label will appear on the chart of the candle that will decrease the price. Although these calculations are not precise; Seeing the “Long” label means that the price will rise at that candle, and seeing the “Short” label means that the price will decrease at that candle. The “Long”, “Short” tags from this script alone should not be used to determine the direction of the price. It can be used on all price-time charts.
wolfpack by multigrainContext
WolfPack was originally published by @darrellfischer1. The indicator was then made popular as a useful companion to the famous Market Cipher (and other similar) oscillators.
Improvements
Inspired by the Bjorgum TSI I have gone ahead and applied a Exponential Moving Average to the original WolfPack plot. The color changes assist in anticipating trend reversals and curls.
Credits
@bjorgum for the coloring and interpretation ideas
@darrellfischer1 for WolfPack

Indicator Functions with Factor and HeikinAshiHello all,
This indicator returns below selected indicators values with entered parameters.
Also you can add factorization, functions candles, function HeikinAshi and more to the plot.
VERSION:
Version 1: returns series only source and Length with already defined default values
Version 2: returns series with source, Length, p1 and p2 parameters according to the indicator definition (ex: )
PARAMETERS p1 p2
for defining multi arguments (See indicators list) indicator input value usable with verison=V2 selected.. ex: for alma( src , len ,offset=0.85,sigma=6), set source=source, len=length, p1=0.85 an p2=6
FACTOR:
Add double triple, Quadruple factors to selected indicator (like converting EMA to 2-DEMA, 3-TEMA, 4-QEMA...)
1-Original
2-Double
3-Triple
4-Quadruple
LOG
Log: Use log, log10 on function entries
PLOTTING:
PType: Plotting type of the function on the screen
Original :use original values
Org. Range (-1,1): usable for indicators between range -1 and 1
Stochastic: Convert indicator values by using stochastic calculation between -1 & 1. (use AT/% length to better view)
PercentRank: Convert indicator values by using Percent Rank calculation between -1 & 1. (use AT/% length to better view)
ST/%: length for plotting Type for stochastic and Percent Rank options
Smooth: Use SWMA for smoothing the function
DISPLAY TYPES
Plot Candles: Display the selected indicator as candle by implementing values
Plot Ind: Display result of indicator with selected source
HeikinAshi: Display Selected indicator candles with Heikin Ashi calculation
INDICATOR LIST:
hide = 'DONT DISPLAY', //Dont display & calculate the indicator. (For my framework usage)
alma = 'alma( src , len ,offset=0.85,sigma=6)', // Arnaud Legoux Moving Average
ama = 'ama( src , len ,fast=14,slow=100)', //Adjusted Moving Average
acdst = 'accdist()', // Accumulation/distribution index.
cma = 'cma( src , len )', //Corrective Moving average
dema = 'dema( src , len )', // Double EMA (Same as EMA with 2 factor)
ema = 'ema( src , len )', // Exponential Moving Average
gmma = 'gmma( src , len )', //Geometric Mean Moving Average
hghst = 'highest( src , len )', //Highest value for a given number of bars back.
hl2ma = 'hl2ma( src , len )', //higest lowest moving average
hma = 'hma( src , len )', // Hull Moving Average .
lgAdt = 'lagAdapt( src , len ,perclen=5,fperc=50)', //Ehler's Adaptive Laguerre filter
lgAdV = 'lagAdaptV( src , len ,perclen=5,fperc=50)', //Ehler's Adaptive Laguerre filter variation
lguer = 'laguerre( src , len )', //Ehler's Laguerre filter
lsrcp = 'lesrcp( src , len )', //lowest exponential esrcpanding moving line
lexp = 'lexp( src , len )', //lowest exponential expanding moving line
linrg = 'linreg( src , len ,loffset=1)', // Linear regression
lowst = 'lowest( src , len )', //Lovest value for a given number of bars back.
pcnl = 'percntl( src , len )', //percentile nearest rank. Calculates percentile using method of Nearest Rank.
pcnli = 'percntli( src , len )', //percentile linear interpolation. Calculates percentile using method of linear interpolation between the two nearest ranks.
rema = 'rema( src , len )', //Range EMA (REMA)
rma = 'rma( src , len )', //Moving average used in RSI . It is the exponentially weighted moving average with alpha = 1 / length.
sma = 'sma( src , len )', // Smoothed Moving Average
smma = 'smma( src , len )', // Smoothed Moving Average
supr2 = 'super2( src , len )', //Ehler's super smoother, 2 pole
supr3 = 'super3( src , len )', //Ehler's super smoother, 3 pole
strnd = 'supertrend( src , len ,period=3)', //Supertrend indicator
swma = 'swma( src , len )', //Sine-Weighted Moving Average
tema = 'tema( src , len )', // Triple EMA (Same as EMA with 3 factor)
tma = 'tma( src , len )', //Triangular Moving Average
vida = 'vida( src , len )', // Variable Index Dynamic Average
vwma = 'vwma( src , len )', // Volume Weigted Moving Average
wma = 'wma( src , len )', //Weigted Moving Average
angle = 'angle( src , len )', //angle of the series (Use its Input as another indicator output)
atr = 'atr( src , len )', // average true range . RMA of true range.
bbr = 'bbr( src , len ,mult=1)', // bollinger %%
bbw = 'bbw( src , len ,mult=2)', // Bollinger Bands Width . The Bollinger Band Width is the difference between the upper and the lower Bollinger Bands divided by the middle band.
cci = 'cci( src , len )', // commodity channel index
cctbb = 'cctbbo( src , len )', // CCT Bollinger Band Oscilator
chng = 'change( src , len )', //Difference between current value and previous, source - source.
cmo = 'cmo( src , len )', // Chande Momentum Oscillator . Calculates the difference between the sum of recent gains and the sum of recent losses and then divides the result by the sum of all price movement over the same period.
cog = 'cog( src , len )', //The cog (center of gravity ) is an indicator based on statistics and the Fibonacci golden ratio.
cpcrv = 'copcurve( src , len )', // Coppock Curve. was originally developed by Edwin "Sedge" Coppock (Barron's Magazine, October 1962).
corrl = 'correl( src , len )', // Correlation coefficient . Describes the degree to which two series tend to deviate from their ta. sma values.
count = 'count( src , len )', //green avg - red avg
dev = 'dev( src , len )', //ta.dev() Measure of difference between the series and it's ta. sma
fall = 'falling( src , len )', //ta.falling() Test if the `source` series is now falling for `length` bars long. (Use its Input as another indicator output)
kcr = 'kcr( src , len ,mult=2)', // Keltner Channels Range
kcw = 'kcw( src , len ,mult=2)', //ta.kcw(). Keltner Channels Width. The Keltner Channels Width is the difference between the upper and the lower Keltner Channels divided by the middle channel.
macd = 'macd( src , len )', // macd
mfi = 'mfi( src , len )', // Money Flow Index
nvi = 'nvi()', // Negative Volume Index
obv = 'obv()', // On Balance Volume
pvi = 'pvi()', // Positive Volume Index
pvt = 'pvt()', // Price Volume Trend
rise = 'rising( src , len )', //ta.rising() Test if the `source` series is now rising for `length` bars long. (Use its Input as another indicator output)
roc = 'roc( src , len )', // Rate of Change
rsi = 'rsi( src , len )', // Relative strength Index
smosc = 'smi_osc( src , len ,fast=5, slow=34)', //smi Oscillator
smsig = 'smi_sig( src , len ,fast=5, slow=34)', //smi Signal
stdev = 'stdev( src , len )', //Standart deviation
trix = 'trix( src , len )' , //the rate of change of a triple exponentially smoothed moving average .
tsi = 'tsi( src , len )', //True Strength Index
vari = 'variance( src , len )', //ta.variance(). Variance is the expectation of the squared deviation of a series from its mean (ta. sma ), and it informally measures how far a set of numbers are spread out from their mean.
wilpc = 'willprc( src , len )', // Williams %R
wad = 'wad()', // Williams Accumulation/Distribution .
wvad = 'wvad()' //Williams Variable Accumulation/Distribution
I will update the indicator list when I will update the library
Thanks to tradingview, @RodrigoKazuma for their open source indicators

lib_Indicators_v2_DTULibrary "lib_Indicators_v2_DTU"
This library functions returns included Moving averages, indicators with factorization, functions candles, function heikinashi and more.
Created it to feed as backend of my indicator/strategy "Indicators & Combinations Framework Advanced v2 " that will be released ASAP.
This is replacement of my previous indicator (lib_indicators_DT)
I will add an indicator example which will use this indicator named as "lib_indicators_v2_DTU example" to help the usage of this library
Additionally library will be updated with more indicators in the future
NOTES:
Indicator functions returns only one series :-(
plotcandle function returns candle series
INDICATOR LIST:
hide = 'DONT DISPLAY', //Dont display & calculate the indicator. (For my framework usage)
alma = 'alma(src,len,offset=0.85,sigma=6)', //Arnaud Legoux Moving Average
ama = 'ama(src,len,fast=14,slow=100)', //Adjusted Moving Average
acdst = 'accdist()', //Accumulation/distribution index.
cma = 'cma(src,len)', //Corrective Moving average
dema = 'dema(src,len)', //Double EMA (Same as EMA with 2 factor)
ema = 'ema(src,len)', //Exponential Moving Average
gmma = 'gmma(src,len)', //Geometric Mean Moving Average
hghst = 'highest(src,len)', //Highest value for a given number of bars back.
hl2ma = 'hl2ma(src,len)', //higest lowest moving average
hma = 'hma(src,len)', //Hull Moving Average.
lgAdt = 'lagAdapt(src,len,perclen=5,fperc=50)', //Ehler's Adaptive Laguerre filter
lgAdV = 'lagAdaptV(src,len,perclen=5,fperc=50)', //Ehler's Adaptive Laguerre filter variation
lguer = 'laguerre(src,len)', //Ehler's Laguerre filter
lsrcp = 'lesrcp(src,len)', //lowest exponential esrcpanding moving line
lexp = 'lexp(src,len)', //lowest exponential expanding moving line
linrg = 'linreg(src,len,loffset=1)', //Linear regression
lowst = 'lowest(src,len)', //Lovest value for a given number of bars back.
pcnl = 'percntl(src,len)', //percentile nearest rank. Calculates percentile using method of Nearest Rank.
pcnli = 'percntli(src,len)', //percentile linear interpolation. Calculates percentile using method of linear interpolation between the two nearest ranks.
rema = 'rema(src,len)', //Range EMA (REMA)
rma = 'rma(src,len)', //Moving average used in RSI. It is the exponentially weighted moving average with alpha = 1 / length.
sma = 'sma(src,len)', //Smoothed Moving Average
smma = 'smma(src,len)', //Smoothed Moving Average
supr2 = 'super2(src,len)', //Ehler's super smoother, 2 pole
supr3 = 'super3(src,len)', //Ehler's super smoother, 3 pole
strnd = 'supertrend(src,len,period=3)', //Supertrend indicator
swma = 'swma(src,len)', //Sine-Weighted Moving Average
tema = 'tema(src,len)', //Triple EMA (Same as EMA with 3 factor)
tma = 'tma(src,len)', //Triangular Moving Average
vida = 'vida(src,len)', //Variable Index Dynamic Average
vwma = 'vwma(src,len)', //Volume Weigted Moving Average
wma = 'wma(src,len)', //Weigted Moving Average
angle = 'angle(src,len)', //angle of the series (Use its Input as another indicator output)
atr = 'atr(src,len)', //average true range. RMA of true range.
bbr = 'bbr(src,len,mult=1)', //bollinger %%
bbw = 'bbw(src,len,mult=2)', //Bollinger Bands Width. The Bollinger Band Width is the difference between the upper and the lower Bollinger Bands divided by the middle band.
cci = 'cci(src,len)', //commodity channel index
cctbb = 'cctbbo(src,len)', //CCT Bollinger Band Oscilator
chng = 'change(src,len)', //Difference between current value and previous, source - source .
cmo = 'cmo(src,len)', //Chande Momentum Oscillator. Calculates the difference between the sum of recent gains and the sum of recent losses and then divides the result by the sum of all price movement over the same period.
cog = 'cog(src,len)', //The cog (center of gravity) is an indicator based on statistics and the Fibonacci golden ratio.
cpcrv = 'copcurve(src,len)', //Coppock Curve. was originally developed by Edwin "Sedge" Coppock (Barron's Magazine, October 1962).
corrl = 'correl(src,len)', //Correlation coefficient. Describes the degree to which two series tend to deviate from their ta.sma values.
count = 'count(src,len)', //green avg - red avg
dev = 'dev(src,len)', //ta.dev() Measure of difference between the series and it's ta.sma
fall = 'falling(src,len)', //ta.falling() Test if the `source` series is now falling for `length` bars long. (Use its Input as another indicator output)
kcr = 'kcr(src,len,mult=2)', //Keltner Channels Range
kcw = 'kcw(src,len,mult=2)', //ta.kcw(). Keltner Channels Width. The Keltner Channels Width is the difference between the upper and the lower Keltner Channels divided by the middle channel.
macd = 'macd(src,len)', //macd
mfi = 'mfi(src,len)', //Money Flow Index
nvi = 'nvi()', //Negative Volume Index
obv = 'obv()', //On Balance Volume
pvi = 'pvi()', //Positive Volume Index
pvt = 'pvt()', //Price Volume Trend
rise = 'rising(src,len)', //ta.rising() Test if the `source` series is now rising for `length` bars long. (Use its Input as another indicator output)
roc = 'roc(src,len)', //Rate of Change
rsi = 'rsi(src,len)', //Relative strength Index
smosc = 'smi_osc(src,len,fast=5, slow=34)', //smi Oscillator
smsig = 'smi_sig(src,len,fast=5, slow=34)', //smi Signal
stdev = 'stdev(src,len)', //Standart deviation
trix = 'trix(src,len)' , //the rate of change of a triple exponentially smoothed moving average.
tsi = 'tsi(src,len)', //True Strength Index
vari = 'variance(src,len)', //ta.variance(). Variance is the expectation of the squared deviation of a series from its mean (ta.sma), and it informally measures how far a set of numbers are spread out from their mean.
wilpc = 'willprc(src,len)', //Williams %R
wad = 'wad()', //Williams Accumulation/Distribution.
wvad = 'wvad()' //Williams Variable Accumulation/Distribution.
}
f_func(string, float, simple, float, float, float, simple) f_func Return selected indicator value with different parameters. New version. Use extra parameters for available indicators
Parameters:
string : FuncType_ indicator from the indicator list
float : src_ close, open, high, low,hl2, hlc3, ohlc4 or any
simple : int length_ indicator length
float : p1 extra parameter-1. active on Version 2 for defining multi arguments indicator input value. ex: lagAdapt(src_, length_,LAPercLen_=p1,FPerc_=p2)
float : p2 extra parameter-2. active on Version 2 for defining multi arguments indicator input value. ex: lagAdapt(src_, length_,LAPercLen_=p1,FPerc_=p2)
float : p3 extra parameter-3. active on Version 2 for defining multi arguments indicator input value. ex: lagAdapt(src_, length_,LAPercLen_=p1,FPerc_=p2)
simple : int version_ indicator version for backward compatibility. V1:dont use extra parameters p1,p2,p3 and use default values. V2: use extra parameters for available indicators
Returns: float Return calculated indicator value
fn_heikin(float, float, float, float) fn_heikin Return given src data (open, high,low,close) as heikin ashi candle values
Parameters:
float : o_ open value
float : h_ high value
float : l_ low value
float : c_ close value
Returns: float heikin ashi open, high,low,close vlues that will be used with plotcandle
fn_plotFunction(float, string, simple, bool) fn_plotFunction Return input src data with different plotting options
Parameters:
float : src_ indicator src_data or any other series.....
string : plotingType Ploting type of the function on the screen
simple : int stochlen_ length for plotingType for stochastic and PercentRank options
bool : plotSWMA Use SWMA for smoothing Ploting
Returns: float
fn_funcPlotV2(string, float, simple, float, float, float, simple, string, simple, bool, bool) fn_funcPlotV2 Return selected indicator value with different parameters. New version. Use extra parameters fora available indicators
Parameters:
string : FuncType_ indicator from the indicator list
float : src_data_ close, open, high, low,hl2, hlc3, ohlc4 or any
simple : int length_ indicator length
float : p1 extra parameter-1. active on Version 2 for defining multi arguments indicator input value. ex: lagAdapt(src_, length_,LAPercLen_=p1,FPerc_=p2)
float : p2 extra parameter-2. active on Version 2 for defining multi arguments indicator input value. ex: lagAdapt(src_, length_,LAPercLen_=p1,FPerc_=p2)
float : p3 extra parameter-3. active on Version 2 for defining multi arguments indicator input value. ex: lagAdapt(src_, length_,LAPercLen_=p1,FPerc_=p2)
simple : int version_ indicator version for backward compatibility. V1:dont use extra parameters p1,p2,p3 and use default values. V2: use extra parameters for available indicators
string : plotingType Ploting type of the function on the screen
simple : int stochlen_ length for plotingType for stochastic and PercentRank options
bool : plotSWMA Use SWMA for smoothing Ploting
bool : log_ Use log on function entries
Returns: float Return calculated indicator value
fn_factor(string, float, simple, float, float, float, simple, simple, string, simple, bool, bool) fn_factor Return selected indicator's factorization with given arguments
Parameters:
string : FuncType_ indicator from the indicator list
float : src_data_ close, open, high, low,hl2, hlc3, ohlc4 or any
simple : int length_ indicator length
float : p1 parameter-1. active on Version 2 for defining multi arguments indicator input value. ex: lagAdapt(src_, length_,LAPercLen_=p1,FPerc_=p2)
float : p2 parameter-2. active on Version 2 for defining multi arguments indicator input value. ex: lagAdapt(src_, length_,LAPercLen_=p1,FPerc_=p2)
float : p3 parameter-3. active on Version 2 for defining multi arguments indicator input value. ex: lagAdapt(src_, length_,LAPercLen_=p1,FPerc_=p2)
simple : int version_ indicator version for backward compatibility. V1:dont use extra parameters p1,p2,p3 and use default values. V2: use extra parameters for available indicators
simple : int fact_ Add double triple, Quatr factor to selected indicator (like converting EMA to 2-DEMA, 3-TEMA, 4-QEMA...)
string : plotingType Ploting type of the function on the screen
simple : int stochlen_ length for plotingType for stochastic and PercentRank options
bool : plotSWMA Use SWMA for smoothing Ploting
bool : log_ Use log on function entries
Returns: float Return result of the function
fn_plotCandles(string, simple, float, float, float, simple, string, simple, bool, bool, bool) fn_plotCandles Return selected indicator's candle values with different parameters also heikinashi is available
Parameters:
string : FuncType_ indicator from the indicator list
simple : int length_ indicator length
float : p1 parameter-1. active on Version 2 for defining multi arguments indicator input value. ex: lagAdapt(src_, length_,LAPercLen_=p1,FPerc_=p2)
float : p2 parameter-2. active on Version 2 for defining multi arguments indicator input value. ex: lagAdapt(src_, length_,LAPercLen_=p1,FPerc_=p2)
float : p3 parameter-3. active on Version 2 for defining multi arguments indicator input value. ex: lagAdapt(src_, length_,LAPercLen_=p1,FPerc_=p2)
simple : int version_ indicator version for backward compatibility. V1:dont use extra parameters p1,p2,p3 and use default values. V2: use extra parameters for available indicators
string : plotingType Ploting type of the function on the screen
simple : int stochlen_ length for plotingType for stochastic and PercentRank options
bool : plotSWMA Use SWMA for smoothing Ploting
bool : log_ Use log on function entries
bool : plotheikin_ Use Heikin Ashi on Plot
Returns: float

Bollinger Band Width PercentileIntroducing the Bollinger Band Width Percentile
Definitions :
Bollinger Band Width Percentile is derived from the Bollinger Band Width indicator.
It shows the percentage of bars over a specified lookback period that the Bollinger Band Width was less than the current Bollinger Band Width.
Bollinger Band Width is derived from the Bollinger Bands® indicator.
It quantitatively measures the width between the Upper and Lower Bands of the Bollinger Bands.
Bollinger Bands® is a volatility-based indicator.
It consists of three lines which are plotted in relation to a security's price.
The Middle Line is typically a Simple Moving Average.
The Upper and Lower Bands are typically 2 standard deviations above, and below the SMA (Middle Line).
Volatility is a statistical measure of the dispersion of returns for a given security or market index, measured by the standard deviation of logarithmic returns.
The Broad Concept :
Quoting Tradingview specifically for commonly noted limitations of the BBW indicator which I have based this indicator on....
“ Bollinger Bands Width (BBW) outputs a Percentage Difference between the Upper Band and the Lower Band.
This value is used to define the narrowness of the bands.
What needs to be understood however is that a trader cannot simply look at the BBW value and determine if the Band is truly narrow or not.
The significance of an instruments relative narrowness changes depending on the instrument or security in question.
What is considered narrow for one security may not be for another.
What is considered narrow for one security may even change within the scope of the same security depending on the timeframe.
In order to accurately gauge the significance of a narrowing of the bands, a technical analyst will need to research past BBW fluctuations and price performance to increase trading accuracy. ”
Here I present the Bollinger Band Width Percentile as a refinement of the BBW to somewhat overcome the limitations cited above.
Much of the work researching past BBW fluctuations, and making relative comparisons is done naturally by calculating the Bollinger Band Width Percentile.
This calculation also means that it can be read in a similar fashion across assets, greatly simplifying the interpretation of it.
Plotted Components of the Bollinger Band Width Percentile indicator :
Scale High
Mid Line
Scale Low
BBWP plot
Moving Average 1
Moving Average 2
Extreme High Alert
Extreme Low Alert
Bollinger Band Width Percentile Properties:
BBWP Length
The time period to be used in calculating the Moving average which creates the Basis for the BBW component of the BBWP.
Basis Type
The type of moving average to be used as the Basis for the BBW component of the BBWP.
BBWP Lookback
The lookback period to be used in calculating the BBWP itself.
BBWP Plot settings
The BBWP plot settings give a choice between a user defined solid color, and a choice of "Blue Green Red", or "Blue Red" spectrum palettes.
Moving Averages
Has 2 Optional User definable and adjustable moving averages of the BBWP.
Visual Alerts
Optional User adjustable High and low Signal columns.
How to read the BBWP :
A BBWP read of 95 % ... means that the current BBW level is greater than 95% of the lookback period.
A BBWP read of 5 % .... means that the current BBW level is lower than 95% of the lookback period.
Proposed interpretations :
When the BBWP gets above 90 % and particularly when it hits 100% ... this can be a signal that volatility is reaching a maximum and that a macro High or Low is about to be set.
When the BBWP gets below 10 % and particularly when it hits 0% ...... this can be a signal that volatility is reaching a minimum and that there could be a violent range breakout into a trending move.
When the BBWP hits a low level < 5 % and then gets above its moving average ...... this can be an early signal that a consolidation phase is ending and a trending move is beginning.
When the BBWP hits a high level > 95 % and then falls below its moving average ... this can be an early signal that a trending move is ending and a consolidation phase is beginning.
Essential knowledge :
The BBWP was designed with the daily timeframe in mind, but technical analysists may find use for it on other time frames also.
High and Low BBWP readings do not entail any direction bias.
Deeper Concepts :
In finance, “mean reversion” is the assumption that a financial instrument's price will tend to move towards the average price over time.
If we apply that same logic to volatility as represented here by the Bollinger band width percentile, the assumption is that the Bollinger band width percentile will tend to contract from extreme highs, and expand from extreme lows over time corresponding to repeated phases of contraction and expansion of volatility.
It is clear that for most assets there are periods of directional trending behavior followed by periods of “consolidation” ( trading sideways in a range ).
This often ends with a tightening range under reducing volume and volatility ( popularly known as “the squeeze” ).
The squeeze typically ends with a “breakout” from the range characterized by a rapid increase in volume, and volatility when price action again trends directionally, and the cycle repeats.
Typical Use Cases :
The Bollinger Band Width Percentile may be especially useful for Options traders, as it can provide a bias for when Options are relatively expensive, or inexpensive from a Volatility (Vega) perspective.
When the Bollinger Band Width Percentile is relatively high ( 85 percentile or above ) it may be more advantageous to be a net seller of Vega.
When the Bollinger Band Width Percentile is relatively low ( 15 percentile or below ) it may be advantageous to be net long Vega.
Here we examine a number of actionable signals on BTCUSD daily timeframe using the BBWP and a momentum oscillator ( using the TSI here but can equally be used with Bollinger bands, moving averages, or the traders preferred momentum oscillator ).
In this first case we will examine how a spot trader and an options trader could each use a low BBWP read to alert them to a good potential trade setup.
note: using a period of 30 for both the Bollinger bands and the BBWP period ( approximately a month ) and a BBWP lookback of 350 ( approximately a year )
As we see the Bollinger Bands have gradually contracted while price action trended down and the BBWP also fell consistently while below its moving average ( denoting falling volatility ) down to an extremely low level <5% until it broke above its moving average along with a break of range to the upside ( signaling the end of the consolidation at a low level and the beginning of a new trending move to the upside with expanding volatility).
In this next case we will continue to follow the price action presuming that the traders have taken or locked in profit at reasonable take profit levels from the previous trade setup.
Here we see the contraction of the Bollinger bands, and the BBWP alongside price action breaking below the BB Basis giving a warning that the trending move to the upside is likely over.
We then see the BBWP rising and getting above its moving average while price action fails to get above the BB Basis, likewise the TSI fails to get above its signal line and actually crosses below its zeroline.
The trader would normally take this as a signal that the next trending move could be to the downside.
The next trending move turns out to be a dramatic downside move which causes the BBWP to hit 100% signaling that volatility is likely to hit a maximum giving good opportunities for profitable trades to the skilled trader as outlined.
Limitations :
Here we will look at 2 cases where blindly taking BBWP signals could cause the trader to take a failed trade.
In this first example we will look at blindly taking a low volatility options trade
Low Volatility and corresponding low BBWP levels do not automatically mean there has to be expansion immediately, these periods of extreme low volatility can go on for quite some time.
In this second example we will look at blindly taking a high volatility spot short trade
High volatility and corresponding high BBWP levels do not automatically mean there has to be a macro high and contraction of volatility immediately, these periods of extreme high volatility can also go on for quite some time, hence the famous saying "The trend is your friend until the end of the trend" and lesser well known, but equally valid saying "never try to short the top of a parabolic blow off top"
Markets are variable and past performance is no guarantee of future results, this is not financial advice, I am not a financial advisor.
Final thoughts
The BBWP is an improvement over the BBW in my opinion, and is a novel, and useful addition to a Technical Analysts toolkit.
It is not a standalone indicator and is meant to be used in conjunction with other tools for direction bias, and Good Risk Management to base sound trades off.
John Bollinger has suggested using Bolliger bands, and its related indicators with two or three other non-correlated indicators that provide more direct market signals.
He believes it is crucial to use indicators based on different types of data.
Some of his favored technical techniques are moving average divergence/convergence (MACD), on-balance volume and relative strength index (RSI).
Thanks
Massive respect to John Bollinger, long-time technician of the markets, and legendary creator of both the Bollinger Bands® in the 1980´s, and the Bollinger band Width indicator in 2010 which this indicator is based on.
His work continues to inspire, decades after he brought the original Bollinger Bands to the market.
Much respect also to Eric Crown who gave me the fundamental knowledge of Technical Analysis, and Options trading.

[DS]Entry_Exit_TRADE.V01-StrategyThe proposal of this script is to show the possible trading points of BUY and SELL based on the 15-minute chart of the Nasdaq Future Index. The start point of the strategy was schedule for 2021/01/01 and until the time of this publication (2021/01/31), for 1 index contract the results presented area a Gross Profit of 2.97% with a Net Profit of 1.35%.
█ FEATURES
The indicator shows on the graph the position of the MACD and TSI indicators that are the places of strength among Buyers and Sellers.
It's possible to observe a sharp fall or rise in the price of these positions.
On the current candle, a label is displayed containing the value of the William %R Mod indicator, which will display the OverBought position (dark red) and OverSold position (dark green). The other colors like light red and green are the regions where the price makes the decision of which direction to go.
There are also other indicators:
a) The positions of the BUY (light green) and SELL areas (light red);
b) The label with the position of BUY (dark green) and SELL (dark red) with the line that connects these points;
c) DEMA 72 (orange);
d) EmaOchl4 in the color green for BULL and red for BEAR market;
e) Pivots high and low
f) Maximum (purple light) and minimum areas (blue light)
█ FUNCTIONS AND SETTINGS
The indicator uses the following functions:
(1) DEMA - Double Exponential Moving Average (08,17,34, 72)
(2) ema () - Exponential Moving Averge (72, ohlc4)
(3) plot()
(4) barcolor()
(5) cross()
(6) pivots ()
(7) William R% Md (OverBought = -7, OverSold=-93)
(8) Maximum and Minimum Value
(9) fill()
(10) macd () - Moving Average Convergence Divergence (Fast Lengt=12, Slow Length=26, Source=close, Signal Smoothing=9)
(11) tsi() - Trading Strenght Indicator==> Índice de Força Real ( IFR ) (Long Length=72, Short Length=17, Signal Length=17)
(12) Buy and Sell TRADE Points
█ PERFORMANCE AND ERRORS
The positions of BUY and SELL points are defined through the crossing of the Dema 34 candles with the Ema Ohcl4. As it is an indicator, it can present different positions from de market direction. Thus there is a need to observe the direction of the market in order to verify whether the indicate decision is really acceptable. The decision to BUY or SELL an asset must be well studied to avoid financial losses. The indicator will only help you in this decision, is your responsibility the decision of entering or leaving an asset.
█ THANKS TO
PineCoders for all they do, all the tools and help they provide, and their involvement in making a better community. All the PineCoders, Pine Pros, and Pine Wizards, people who share their work and knowledge for the sake of it and helping others, I'm very happy and grate full indeed.
█ NOTE
If you have any suggestions for improving the script or need help using it, please send a message in the comments

TKP-True Relative MovementThis script uses a combination of modified TSI and RSI conditions produce Buy/Sell/Hold signals. Similar to Elder's Impulse, when a buy signal is met, bars turn blue. When a sell signal is met, bars turn Pink. When signals are mixed, bars turn grey. Depending on direction of trend, gray bars can be considered "Hold" or take profit signals. You can change the parameters of TSI or RSI to preference. Also embedded in the script is the ability to add exponential moving average filter for additional conditions if you have some know how with coding.

Currency Strength ALT v1.0Description:
This study is a version of Currency Strength Meter, that utilises TradingViews built-in 8 Currency indices (?XY), rather calculate them from currency pair values. It also utilises the built-in TSI function, the TSI uses moving averages of the underlying momentum of a financial instrument. The advantage of using the Currency Indices for strength is the fact that they are based on multiple Exchange sources and so hopefully making it more representative.
***WARNING*** The TradingView Currency Indices do tend to have gaps between candles especially on the low volume currencies like NZD and AUD, so strength chart can also jump around. I suggest using the indicator with higher TF (4H+) charts.
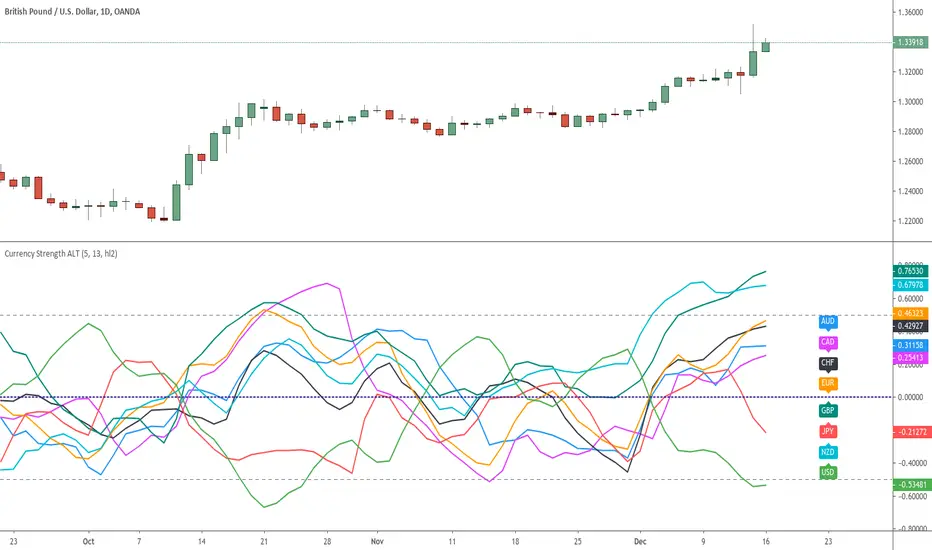
8 Pair Strength R2.0 updated by JustUncleLThis is an updated script Originally written by @glaz
Description:
This study is a version of Currency Strength Meter, that utilises TradingView's built-in "True Strength Index" (TSI) function. The TSI uses moving averages of the underlying momentum of a financial instrument.
Modifications:
10-Nov-2017 by JustUncleL
Corrected the weighting on JPY pairs, by dividing their close values by 100 to bring them within 1.0 range of the other pairs.
Added option to use different Data Source, eg hl2, hlc3, ohlc4 etc.
Updated to PineScript version 3.
Updated variable names to reflect their origin.