USDJPY Fair Value Gap + Session Strategy🎯 Overview
This strategy combines Fair Value Gaps (FVGs) with session-based order flow analysis, specifically optimized for USDJPY. It identifies price inefficiencies left behind by institutional order flow during high-volatility trading sessions, offering a modern alternative to traditional lagging indicators.
🔬 What Are Fair Value Gaps?
Fair Value Gaps represent areas where aggressive institutional buying or selling created "gaps" in the market structure:
Bullish FVG: Price moves up so aggressively that it leaves unfilled buy orders behind
Bearish FVG: Price moves down so quickly that it leaves unfilled sell orders behind
Research shows approximately 80% of FVGs get "filled" (price returns to the gap) within 20-60 bars, making them highly predictable trading zones.
(see the generated image above)
(see the generated image above)
FVG Detection Logic:
text
// Bullish FVG: Gap between high and current low
bullishFVG = low > high and high > high
// Bearish FVG: Gap between low and current high
bearishFVG = high < low and low < low
🌏 Session-Based Trading
Why Sessions Matter for USDJPY
(see the generated image above)
Tokyo Session (00:00-09:00 UTC)
Highest volatility during first hour (00:00-01:00 UTC)
Average movement: 51-60 pips
Best for breakout strategies
London/NY Overlap (13:00-16:00 UTC)
Maximum liquidity and institutional participation
Tightest spreads and most reliable FVG formations
Optimal for continuation trades
Monday Premium Effect
USDJPY moves 120+ pips on Mondays due to weekend positioning
Enhanced FVG formation during session opens
📊 Strategy Components
(see the generated image above)
1. Fair Value Gap Detection
Identifies bullish and bearish FVGs automatically
Age limit: FVGs expire after 20 bars to avoid stale setups
Size filter: Minimum gap size to filter out noise
2. Session Filtering
Tokyo Open focus: Trades during first hour of Asian session
London/NY Overlap: Captures high-liquidity institutional flows
Weekend gap strategy: Enhanced signals on Monday opens
3. Volume Confirmation
Requires 1.5x average volume spike
Confirms institutional participation
Reduces false signals
4. Trend Alignment
50 EMA filter ensures trades align with higher timeframe trend
Long trades above EMA, short trades below
Prevents costly counter-trend trades
5. Risk Management
2:1 Risk/Reward minimum ensures profitability with 40%+ win rate
Percentage-based stops adapt to USDJPY volatility (0.3% default)
Configurable position sizing
🎯 Entry Conditions
(see the generated image above)
Long Entry (BUY)
✅ Bullish FVG detected in previous bars
✅ Price returns to FVG zone during active trading session
✅ Volume spike above 1.5x average
✅ Price above 50 EMA (trend confirmation)
✅ Bullish candle closes within FVG zone
✅ Trading during Tokyo open OR London/NY overlap
Short Entry (SELL)
✅ Bearish FVG detected in previous bars
✅ Price returns to FVG zone during active trading session
✅ Volume spike above 1.5x average
✅ Price below 50 EMA (trend confirmation)
✅ Bearish candle closes within FVG zone
✅ Trading during Tokyo open OR London/NY overlap
📈 Expected Performance
Backtesting Results (Based on Similar Strategies):
Win Rate: 44-59% (profitable due to high R:R ratio)
Average Winner: 60-90 pips during London/NY sessions
Average Loser: 30-40 pips (tight stops at FVG boundaries)
Risk/Reward: 2:1 minimum, often 3:1 during strong trends
Best Performance: Monday Tokyo opens and Wednesday London/NY overlaps
Why This Works for USDJPY:
90% correlation with US-Japan bond yield spreads
High volatility provides sufficient pip movement
Heavy institutional/central bank participation creates clear FVGs
Consistent volatility patterns across trading sessions
⚙️ Configurable Parameters
Session Settings:
Trade Tokyo Session (Enable/Disable)
Trade London/NY Overlap (Enable/Disable)
FVG Settings:
FVG Minimum Size (Filter small gaps)
Maximum FVG Age (20 bars default)
Show FVG Markers (Visual display)
Volume Settings:
Use Volume Filter (Enable/Disable)
Volume Multiplier (1.5x default)
Volume Average Period (20 bars)
Trend Settings:
Use Trend Filter (Enable/Disable)
Trend EMA Period (50 default)
Risk Management:
Risk/Reward Ratio (2.0 default)
Stop Loss Percentage (0.3% default)
🎨 Visual Indicators
🟡 Yellow Line: 50 EMA trend filter
🟢 Green Triangles: Long entry signals
🔴 Red Triangles: Short entry signals
🟢 Green Dots: Bullish FVG zones
🔴 Red Dots: Bearish FVG zones
🟦 Blue Background: Tokyo open session
🟧 Orange Background: London/NY overlap
📊 Recommended Settings
Optimal Timeframes:
Primary: 5-minute charts (scalping)
Secondary: 15-minute charts (swing trading)
Parameter Optimization:
Conservative: Stop Loss 0.2%, R:R 2:1, Volume 2.0x
Balanced: Stop Loss 0.3%, R:R 2:1, Volume 1.5x (default)
Aggressive: Stop Loss 0.4%, R:R 1.5:1, Volume 1.2x
Risk Management:
Maximum 1-2% of account per trade
Daily loss limit: Stop after 3-5 consecutive losses
Use fixed percentage position sizing
⚠️ Important Considerations
Avoid Trading During:
Major news events (BOJ interventions, NFP, FOMC)
Holiday periods with reduced liquidity
Low volatility Asian afternoon sessions
When US-Japan yield differential narrows sharply
Best Practices:
Limit to 2-3 trades per session maximum
Always respect the 50 EMA trend filter
Never risk more than planned per trade
Paper trade for 2-4 weeks before live implementation
Track performance by session and day of week
🚀 How to Use
Add the script to your USDJPY chart
Set timeframe to 5-minute or 15-minute
Adjust parameters based on your risk tolerance
Enable strategy alerts for automated notifications
Wait for visual signals (triangles) to appear
Enter trades according to your risk management rules
📚 Strategy Foundation
This strategy is based on:
Smart Money Concepts (SMC): Institutional order flow tracking
Market Microstructure: Understanding how FVGs form in electronic trading
Quantified Risk Management: Statistical edge through proper R:R ratios
Session Liquidity Patterns: Exploiting predictable volatility cycles
Cerca negli script per "usdjpy"

USDJPY vanilla indicatorThis Pine Script indicator, USDJPY Strength Index, helps traders evaluate the strength and momentum of the USD/JPY currency pair. It combines the strength of the US Dollar Index (DXY), the inverse of the Japanese Yen Index (JPYX), and the trend of USD/JPY based on moving averages.
Key Features:
1. Strength Measurement: Calculates a score between 0–100 to indicate USD/JPY momentum.
• Above 70: Strong bullish signal (uptrend likely).
• Below 30: Strong bearish signal (downtrend likely).
2. Trend Analysis: Uses 21 EMA and 50 EMA differences to assess trend direction and strength.
3. Visual Indicators:
• Blue line: USDJPY Strength Index.
• Orange line: 50-period EMA of the index for longer-term trends.
• Background colors: Green (bullish) and red (bearish) highlight strong momentum zones.
This indicator provides clear signals to help traders make informed buy or sell decisions for the USD/JPY pair.
tipp: use horizontal line for mark last low and high. when the blue line comes back again you must be ready for open position if the line bounce back. use engulfing pattern for extra confirmation.

USDJPY Assumption v1Based on the "logical trading" post of Charles Cornley (thanks!).
Indicator States:
Very Bullish (Lime) = USD trend rising and JPY trend falling and Gold trend falling and US 10Y Bond trend falling and
Dow Jones trend rising and Nasdaq trend rising and Russell 2000 trend rising and
S&P 500 trend rising and Nikkei 225 trend rising
Bullish (Green) = USD trend rising and JPY trend falling
Bearish (Red) = USD trend falling and JPY trend rising

Liquidity Sweep Breakout - LSBLiquidity Sweep Breakout - LSB
A professional session-based breakout system designed for OANDA:USDJPY and other JPY pairs.
Not guesswork, but precision - built on detailed observation of institutional moves to capture clear trade direction daily.
Master the Market’s Daily Bank Flow.
---
Strategy Detail:
I discovered this strategy after carefully studying how Japanese banks influence the forex market during their daily settlement period. Banks are some of the biggest players in the financial world, and when they adjust or settle their accounts in the morning, it often creates a push in the market. From years of observation, I noticed a consistent pattern, once banks finish their settlements, the market usually continues moving in the same direction that was formed right after those actions. This daily banking flow often sets the tone for the entire trading session, especially for JPY pairs like USDJPY.
To capture this move, I built the indicator so that it follows the bank-driven trend with clear rules for entries, stop-loss (SL), and take-profit (TP). The system is designed with professional risk management in mind. By default, it assumes a $10,000 account size, risks only 1% of that balance per trade, and targets a 1:1.5 reward-to-risk ratio. This means for every $100 risked, the potential profit is $150. Such controlled risk makes the system safer and more sustainable for long-term traders. At the same time, users are not limited to this setup, they can adjust the account balance in the settings, and the indicator will automatically recalculate the lot size and risk levels based on their own capital. This ensures the strategy works for small accounts and larger accounts alike.
🌍 Why It Works
Fundamentally driven: Based on **daily Japanese banking settlement flows**.
Session-specific precision: Targets the exact window when USDJPY liquidity reshapes.
Risk-managed: Always calculates lot size based on account and risk preferences.
Automatable: With webhook + MT5 EA, it can be fully hands-free.
---
✅ Recommended
Pair: USDJPY (best observed behavior).
Timeframe: 3-Minute chart.
Platform: TradingView Premium (for webhooks).
Execution: MT5 via EA.
---
🔎 Strategy Concept
The Tokyo Magic Breakout (TMB) is built on years of session observation and the unique daily rhythm of the Japanese banking system.
Every morning between 5:50 AM – 6:10 AM PKT (09:50 – 10:10 JST), Japanese banks perform daily reconciliation and settlement. This often sets the tone for the USDJPY direction of the day.
This strategy isolates that critical moment of liquidity adjustment and waits for a clean breakout confirmation. Instead of chasing noise, it executes only when price action is aligned with the Tokyo market’s hidden flows.
---
🕒 Timing Logic
Session Start: 5:00 AM PKT (Tokyo market open range).
Magic Candle: The 5:54 AM PKT candle is marked as the reference “breakout selector.”
Checkpoints: First confirmation at 6:30 AM PKT, then every 15 minutes until 8:30 AM PKT.
* If price stays inside the magic range → wait.
* If a breakout happens but the candle wick touches the range → wait for the next checkpoint.
* If by 8:30 AM PKT no clean breakout occurs → the day is marked as No Trade Day (NTD).
👉 Recommended timeframe: 3-Minute chart (3M) for precise signals.
---
📈 Trade Execution
Entry: Clean break above/below the magic candle’s range.
Stop-Loss: Opposite side of the Tokyo session high/low.
Take-Profit: Calculated by Reward\:Risk ratio (default 1.5:1).
Lot Size: Auto-calculated based on your risk model:
* Fixed Dollar
* % of Equity
* Conservative (minimum of both).
Visuals include:
✅ Entry/SL/TP lines
✅ Shaded risk (red) and reward (green) zones
✅ Trade labels (Buy/Sell with lot size & levels)
✅ TP/SL hit markers
---
🔔 Alerts & Automation (AutoTMB)
This strategy is fully automation-ready with EA + MT5:
1. Enable alerts in TMB settings.
2. Insert your PineConnector License Key.
3. Configure your risk management preferences.
4. Create a TradingView alert → in the message box simply type:
Pine Script®
{{alert_message}}
and set the EA webhook.
Now, every breakout trade (with exact entry, SL, TP, and lot size) is sent instantly.
👉 On your MT5:
* Install the EA.
* Use the same license key.
* Run it on a VPS or local MT5 terminal.
You now have a hands-free trading system: AutoTMB.

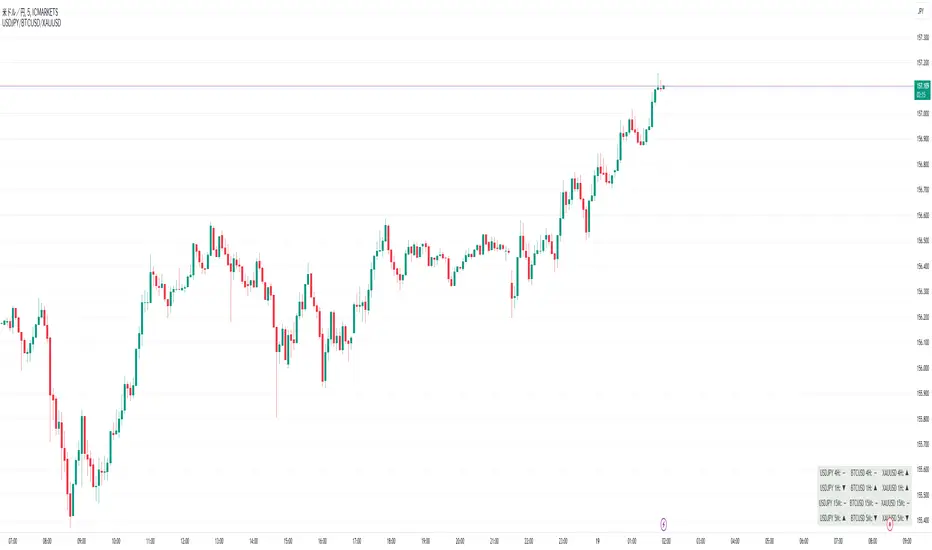
Perfect Order Alert USDJPY/BTCUSD/XAUUSDPerfect Order Alert USDJPY/BTCUSD/XAUUSD 日本語解説は下記
This indicator detects the perfect order of three moving averages and displays on the Panel in an easy-to-understand visual manner whether there is an uptrend, downtrend, or non-trend for each time leg.
This indicator detects perfect orders for the three currency pairs USDJPY/BTCUSD/XAUUSD on the 5-minute, 15-minute, 1-hour, and 4-hour time frames, and displays them on the Panel on the chart, with “▲” for up, “▼” for down, and “ー” for non-trend, so that you can quickly determine the trend. The panel is displayed on the chart.
In order to check for perfect orders without missing them, it is also possible to set up alerts that notify you of all the time frames and currency pairs as well.
Functions
Displaying 4H, 1H, 15M, 5M, up (▲), down (▼), other (-), of USDJPY/BTCUSD/XAUUSD on the panel.
*(By default, 20EMA, 75EMA, and 200EMA are hidden.)
Display position setting of the panel (You can choose from upper left, upper top, upper right, lower left, lower bottom, or lower right).
Panel color and text color change function
The moving average line can be hidden by default.
Moving average period change
Moving average color and thickness can be changed.
EMA/SMA switchable
Alert function - One alert can be set for each currency pair and time frame ▲▼, which is very useful.
Perfect Order Alert
You can use it even if you have a free account with only one alert setting.
To use the alert function, go to the Tradingview default alert settings, select “USDJPY/BTCUSD/XAUUSD” for the top item of conditions, and select “Call Alert() function” in the frame just below it!
_* Supplementary explanation: ____________
Please note that due to the limitation of the script, only 3 currency pairs and 4 time frames are displayed with 12 items (Panels for currency pairs other than USDJPY/BTCUSD/XAUUSD are also created, but they are indicators for other scripts, so if you are interested in other currency pairs, please use those. If you are interested in other currency pairs, please use them.)
Please note that we may change the functions or delete the indicator itself without prior notice.
Translated with DeepL.com (free version)
Reference image of the setting screenReference image of the setting screen
設定画面参考画像
3本の移動平均線のパーフェクトオーダーを検知し、時間足ごとに上昇トレンドか下降トレンドかノントレンドかを視覚的にわかりやすくPanelに表示するインジゲーターです。
このインジゲーターは、USDJPY/BTCUSD/XAUUSDの3通貨ペアの5分足、15分足、1時間足、4時間足のパーフェクトオーダーを検知して、チャートに表示されるPanelに、上昇は「▲」下降は「▼」ノントレンドは「ー」と、すぐに判断できる表示にしてあります。
パーフェクトオーダーを逃さずチェックできるように、それぞれの時間足や通貨ペアも全てを通知してくれるアラート設定が可能なのも特徴です。
機能紹介
・USDJPY/BTCUSD/XAUUSDの4H,1H,15M,5M,の上昇(▲),下降(▼),その他(-),をパネルに表示
※(デフォルトでは20EMA,75EMA,200EMAの3本で非表示にしてあります)
・パネルの表示位置設定(左上、上、右上、左下、下、右下、から選択できます。)
・パネルの色とテキスト色変更機能
・移動平均線表示非表示機能(デフォルトでは表示OFFにしてあります。)
・移動平均線期間変更
・移動平均線色と太さ変更
・EMA/SMA切り替え可能
・アラート機能ー1つのアラート設定で通貨ペアと時間足▲▼一つ一つを細かく教えてくれるので便利。
※パーフェクト オーダーアラート
無料アカウントで1つしかアラート設定できなくても使えます。
アラート機能はTradingviewデフォルトのアラート設定から、条件の一番上の項目を「USDJPY/BTCUSD/XAUUSD」選択、そのすぐ下の枠に「Alert()関数の呼び出し」を選択でOK!
_※ 補足説明____________
・スクリプトの制限の為、3通貨ペアと4つの時間足の12項目で表示させていますのでご了承ください
(USDJPY/BTCUSD/XAUUSD以外の通貨ペアのPanelも作成していますが別スクリプトのインジゲーターになりますので他の通貨ペアも興味がある方はそちらをお使いください)
・予告なしで機能の変更やインジゲーター自体の削除等行う事もあるかもなのでご了承ください。
Macro Stress Monitor (USDJPY + JGB + Yield Curve)
# **Note‑Style Description**
This indicator provides a consolidated framework for monitoring two of the most systemically important channels of global USD liquidity transmission: **offshore USD funding conditions in Japan** and **front‑end U.S. rates stress linked to repo and collateral dynamics**. While TradingView does not supply direct access to cross‑currency basis swaps or repo benchmarks, the script employs market‑validated proxies that closely track the same underlying pressures observed in dealer balance‑sheet constraints, FX‑hedged flows, and Treasury funding markets.
### **1. USD/JPY Funding Pressure (Basis‑Swap Proxy)**
The USD/JPY cross‑currency basis is a primary indicator of offshore USD funding premia for Japanese banks, insurers, and real‑money accounts. Basis widening typically reflects elevated USD demand, reduced hedge ratios, and impaired FX swap market liquidity.
To approximate this behavior in real time, the indicator combines:
- **USDJPY spot**, which tends to accelerate higher during USD funding stress, FX swap dislocations, or shifts in BOJ/Fed policy differentials.
- **JP10Y (Japan 10‑year yield)**, which captures JGB‑market stress, duration‑hedging flows, and the impact of FX‑hedged UST carry dynamics on domestic rates.
The joint behavior of these two series provides a high‑signal proxy for USD/JPY basis conditions, particularly around quarter‑end, fiscal year‑end, and BOJ policy events.
### **2. U.S. Front‑End Curve Stress (Repo/Collateral Proxy)**
Stress in the U.S. repo market often manifests first in the front end of the Treasury curve, where funding volatility, collateral scarcity, and dealer balance‑sheet compression drive rapid curve distortions.
The indicator tracks:
- **US02Y – US10Y (2s10s spread)** as a public‑market proxy for repo tightness, GC specialness, and leveraged Treasury basis‑trade unwind risk.
A deeper inversion or accelerated flattening of the 2s10s curve frequently coincides with rising funding premia, increased margin requirements, and deleveraging across rates‑sensitive strategies.
### **3. Stress Diagnostics**
The script highlights three conditions that historically align with elevated cross‑asset fragility:
- **USDJPY > 20‑day SMA** — proxy for USD funding stress / basis widening
- **JP10Y < 20‑day SMA** — proxy for JGB‑market stress or hedging‑related duration flows
- **2s10s < –0.50** — proxy for front‑end funding pressure and repo‑related curve distortions
These are not directional trading signals. They are **liquidity‑risk diagnostics** intended to identify periods when global funding markets become more vulnerable to synchronized deleveraging.
### **4. Intended Use Case**
This tool is designed for macro practitioners, cross‑asset strategists, and risk managers who monitor:
- USD funding premia and cross‑currency basis dynamics
- FX‑hedged UST flows and Japanese institutional positioning
- Treasury basis‑trade leverage and repo‑driven volatility
- BOJ/Fed policy interactions and quarter‑end balance‑sheet effects
- Systemic liquidity conditions across FX, rates, and credit
The indicator provides a real‑time dashboard for identifying early‑stage liquidity stress that may precede broader cross‑asset volatility.

DayFlow VWAP Relay Forex Majors StrategySummary in one paragraph
DayFlow VWAP Relay is a day-trading strategy for major FX pairs on intraday timeframes, demonstrated on EURUSD 15 minutes. It waits for alignment between a daily anchored VWAP regime check, residual percentiles, and lower-timeframe micro flow before suggesting trades. The originality is the fusion of daily VWAP residual percentiles with a live micro-flow score from 1 minute data to switch between fade and breakout behavior inside the same session. Add it to a clean chart and use the markers and alerts.
Scope and intent
• Markets: Major FX pairs such as EURUSD, GBPUSD, USDJPY, AUDUSD, USDCHF, USDCAD
• Timeframes: One minute to one hour
• Default demo in this publication: EURUSD on 15 minutes
• Purpose: Reduce false starts by acting only when context, location and micro flow agree
• Limits: This is a strategy. Orders are simulated on standard candles only
Originality and usefulness
• Core novelty: Residual percentiles to daily anchored VWAP decide “balanced versus expanding day”. A separate 1 minute micro-flow score confirms direction, so the same model fades extremes in balance and rides range breaks in expansion
• Failure modes addressed: Chop fakeouts and unconfirmed breakouts are filtered by the expansion gate and micro-flow threshold
• Testability: Every input is exposed. Bands, background regime color, and markers show why a suggestion appears
• Portable yardstick: Stops and targets are ATR multiples converted to ticks, which transfer across symbols
• Open source status: No reused third-party code that requires attribution
Method overview in plain language
The day is anchored with a VWAP that updates from the daily session start. Price minus VWAP is the residual. Percentiles of that residual measured over a rolling window define location extremes for the current day. A regime score compares residual volatility to price volatility. When expansion is low, the day is treated as balanced and the model fades residual extremes if 1 minute micro flow points back to VWAP. When expansion is high, the model trades breakouts outside the VWAP bands if slope and micro flow agree with the move.
Base measures
• Range basis: True Range smoothed by ATR for stops and targets, length 14
• Return basis: Not required for signals; residuals are absolute price distance to VWAP
Components
• Daily Anchor VWAP Bands. VWAP with standard-deviation bands. Slope sign is used for trend confirmation on breakouts
• Residual Percentiles. Rolling percentiles of close minus VWAP over Signal length. Identify location extremes inside the day
• Expansion Ratio. Standard deviation of residuals divided by standard deviation of price over Signal length. Classifies balanced versus expanding day
• Micro Flow. Net up minus down closes from 1 minute data across a short span, normalized to −1..+1. Confirms direction and avoids fades against pressure
• Session Window optional. Restricts trading to your configured hours to avoid thin periods
• Cooldown optional. Bars to wait after a position closes to prevent immediate re-entry
Fusion rule
Gating rather than weighting. First choose regime by Expansion Ratio versus the Expansion gate. Inside each regime all listed conditions must be true: location test plus micro-flow threshold plus session window plus cooldown. Breakouts also require VWAP slope alignment.
Signal rule
• Long suggestion on balanced day: residual at or below the lower percentile and micro flow positive above the gate while inside session and cooldown is satisfied
• Short suggestion on balanced day: residual at or above the upper percentile and micro flow negative below the gate while inside session and cooldown is satisfied
• Long suggestion on expanding day: close above the upper VWAP band, VWAP slope positive, micro flow positive, session and cooldown satisfied
• Short suggestion on expanding day: close below the lower VWAP band, VWAP slope negative, micro flow negative, session and cooldown satisfied
• Positions flip on opposite suggestions or exit by brackets
What you will see on the chart
• Markers on suggestion bars: L for long, S for short
• Exit occurs on reverse signal or when a bracket order is filled
• Reference lines: daily anchored VWAP with upper and lower bands
• Optional background: teal for balanced day, orange for expanding day
Inputs with guidance
Setup
• Signal length. Residual and regime window. Typical 40 to 100. Higher smooths, lower reacts faster
Micro Flow
• Micro TF. Lower timeframe used for micro flow, default 1 minute
• Micro span bars. Count of lower-TF bars. Typical 5 to 20
• Micro flow gate 0..1. Minimum absolute flow. Raising it demands stronger confirmation and reduces trade count
VWAP Bands
• VWAP stdev multiplier. Band width. Typical 0.8 to 1.6. Wider bands reduce breakout frequency and increase fade distance
• Expansion gate 0..3. Threshold to switch from fades to breakouts. Raising it favors fades, lowering it favors breakouts
Sessions
• Use session filter. Enable to trade only inside your window
• Trade window UTC. Default 07:00 to 17:00
Risk
• ATR length. Stop and target basis. Typical 10 to 21
• Stop ATR x. Initial stop distance in ATR multiples
• Target ATR x. Profit target distance in ATR multiples
• Cooldown bars after close. Wait bars before a new entry
• Side. Both, long only, or short only
View
• Show VWAP and bands
• Color bars by residual regime
Properties visible in this publication
• Initial capital 10000
• Base currency Default
• request.security uses lookahead off everywhere
• Strategy: Percent of equity with value 3. Pyramiding 0. Commission cash per order 0.0001 USD. Slippage 3 ticks. Process orders on close ON. Bar magnifier ON. Recalculate after order is filled OFF. Calc on every tick OFF. Using standard OHLC fills ON.
Realism and responsible publication
No performance claims. Past results never guarantee future outcomes. Fills and slippage vary by venue. Shapes can move while a bar forms and settle on close. Strategies must run on standard candles for signals and orders.
Honest limitations and failure modes
High impact news, session opens, and thin liquidity can invalidate assumptions. Very quiet days can reduce contrast between residuals and price volatility. Session windows use the chart exchange time. If both stop and target are touched within a single bar, TradingView’s standard OHLC price-movement model decides the outcome.
Expect different behavior on illiquid pairs or during holidays. The model is sensitive to session definitions and feed time. Past results never guarantee future outcomes.
Legal
Education and research only. Not investment advice. You are responsible for your decisions. Test on historical data and in simulation before any live use. Use realistic costs.

Mara JPY Strength (USDJPY+EURJPY+GBPJPY)/3 + DXYJPY, USDJPY, EURJPY, GBPJPY, smart money, bias, index, forex indicator, DXY, strength meter, professional, trading tool, price action

5-Minute YEN Pivot Bars 1.0The 5-Minute YEN Pivot Bars indicator is designed to identify and highlight low-range pivot bars on 5-minute charts, specifically tailored for Yen-based pairs (e.g., GBPJPY, USDJPY). By focusing on precise pip thresholds, this tool helps traders detect potential pivot points within specific trading sessions, while avoiding inside bars and other noise often seen in low-volatility conditions. This can be particularly useful for trend traders and those looking to refine their entry points based on intraday reversals.
Key Features:
- Customized Pip Thresholds for Yen Pairs:
The indicator is pre-configured for Yen pairs, where 1 pip is typically represented by 0.01. It applies these thresholds:
- Limited Range: 4 pips or less between open and close prices.
- High/Low Directionality: At least 3 pips from the close/open to the bar's high or low.
- Open/Close Proximity: 4 pips or less between open and close.
- Inside Bar Tolerance: A tolerance of 3 pips for inside bars, helping reduce false signals from bars contained within the previous bar's range.
- Session-Specific Alerts:
- The indicator allows you to enable alerts for the European Session (6:00-12:00), American Session (12:00-17:00), and London Close (17:00-20:00). You can adjust these times based on your own trading hours or timezone preferences via a time-shift setting.
- Receive real-time alerts when a valid bullish or bearish pivot bar is identified within the chosen sessions, allowing you to respond to potential trade opportunities immediately.
- Time Shift Customization:
- Adjust the "Time Shift" parameter to account for different time zones, ensuring accurate session alignment regardless of your local time.
How It Works:
1. Pivot Bar Identification:
The indicator scans for bars where the difference between the open and close is within the "Limited Range" threshold, and both open and close prices are close to either the high or the low of the bar.
2. Directional Filtering:
It requires the bar to show strong directional bias by enforcing an additional distance between the open/close levels and the opposite end of the bar (high/low). Only bars with this directional structure are considered for highlighting.
3. Exclusion of Inside Bars:
Bars that are completely contained within the range of the previous bar are excluded (inside bars), as are consecutive inside bars. This filtering is essential to avoid marking bars that typically indicate consolidation rather than potential pivot points.
4. Session Alerts:
When a valid pivot bar appears within the selected sessions, an alert is triggered, notifying the trader of a potential trading signal. Bullish and bearish signals are differentiated based on whether the close is near the high or low.
How to Use:
- Trend Reversals: Use this indicator to spot potential trend reversals or pullbacks on a 5-minute chart, especially within key trading sessions.
- Entry and Exit Points: Highlighted bars can serve as potential entry points for traders looking to capitalize on short-term directional changes or continuation patterns.
- Combine with Other Indicators: Consider pairing this tool with momentum indicators or trendlines to confirm the signals, providing a comprehensive analysis framework.
Default Parameters:
- Limited Range: 4 Pips
- High/Low Directionality: 3 Pips
- Open/Close Proximity: 4 Pips
- Inside Bar Tolerance: 3 Pips
- Session Alerts: Enabled for European, American, and London Close sessions
- Time Shift: Default 6 (adjustable to align with different time zones)
This indicator is specifically optimized for Yen pairs on 5-minute charts due to its pip calculation.

Trend Trading with Currency Strength MeterThis is a trend trading strategy designed mainly for forex made of two big components:
First we have the currency meter, which is made of taking TSI of different INDEXes such as EUR, USD, GBP, JPY, NZD, AUD , CHF and CAD.
Once we establish which one is the weakest and most powerful, we pair them together and we go on that chart.
Lastly we check with the EMA 200 to confirm our direction.
We can see in this example for the USDJPY chart, that USD is the strongest, JPY is the weakest and ema confirm our bullish trend.
For timeframe in general I recommend big timeframes, 1-4h+ , and as a mentality a swing trading mentality, we can stay in trade for days/weeks.
For exit in general I recommend to exit when either one of the pairs losses/gain power or when the EMA is crossing with current candle
If you have any questions, let me know !

Correlation of chart symbol to different Index-ETF-currencyScript plots correlation of chart symbol to a variety of indexes, symbols, equities. ** Original idea was to find Bitcoin correlation, which I did not. Built in correlations are: Nikie, DAX, SPY, AAPL, US Dollar, Gold, EURUSD, USDCNY, EEM, QQQ, XLK, XLF, USDJPY, EURGBP

Gotobi TeriyakiUSDJPY Anomaly.
This anomaly originated in Japan.
Buy from 2:00 pm Japan time.
Sell at 9:55 Japan time.
Japanese importers often settle payments to suppliers in dollars, and exchange yen for dollars on settlement days (days falling on a 5 or 10, so-called goto days).
Therefore, on goto days, there is sometimes a shortage of dollars held by financial institutions. This is called the "middle price shortage," and financial institutions purchase dollars through the foreign exchange market to resolve the middle price shortage.
As a result, the dollar currency is bought and USD/JPY depreciates against the yen. Since the yen has historically appreciated against the dollar, exporting companies make forward exchange contracts with financial institutions as a risk hedge.
Financial institutions are therefore forced to procure dollars in the market because they do not have enough dollars in their balance sheets to deliver to exporters.
Five days is called "GO" in Japanese.
Ten days is called "TO" in Japanese.
In Japanese, a day is called "BI".
Now I can eat teriyaki all day long :)
ドル円ゴトー日ストラテジーを作ってみました。

USDJPY Only StrategyOnce again, I wish that tradingview offered at least a year of data on 15 minute time frames, but too bad.
The only issue is that the last 2 and 1/2 months over which this was backtested is not enough and does not provide actual representation of future results.
However, if it is, then I can comfortably earn 100%+ every month on average.

Band Walk Detector TENKYO [BASIC]Band Walk Detector TENKYO is a precision volatility analyzer designed for the 15-minute timeframe. It allows traders to visually verify the efficacy of the "TENKYO" logic, focusing strictly on high-probability breakout zones during specific market sessions.
Core Logic
This indicator is designed to capture the initial movement of a band walk. By filtering market noise through a specialized algorithm, it isolates the exact moment trend momentum begins to accelerate, providing a clear visual representation of market expansion.
Strategy Verification
This tool is engineered for rigorous market analysis and strategy confirmation. The backtest period can be set freely in 15-minute increments. Whether analyzing past market cycles or recent volatility, please feel free to test extensively across various seasons and times of day. This allows for a deep understanding of how the logic performs under different liquidity conditions.
Operational Guide
This release focuses on manual analysis and visual timing:
・Entry Signals: This version does not have an alert function. Please gauge the entry timing based on the labels that appear on the screen.
・Exit Management: In this version, labels indicating the timing of the exit are not displayed. Traders are encouraged to monitor the chart to determine the optimal exit points based on the trend's progression.
System Specifications
To ensure logical consistency and performance accuracy, the following settings are applied:
・Supported Assets: This version functions only on EURUSD and USDJPY currency pairs. The parameters are tuned specifically for the liquidity profiles of these major pairs.
・Session Timing: In this version, the time zone is fixed to London. This ensures that market session overlaps are calculated consistently, regardless of your local time.
・Parameter Tuning: In this version, users cannot finely customize details such as the band expansion acceleration threshold or the sensitivity of the wick block. The developer's recommended settings are used.
For more detailed information and further resources, please check the links in my profile.

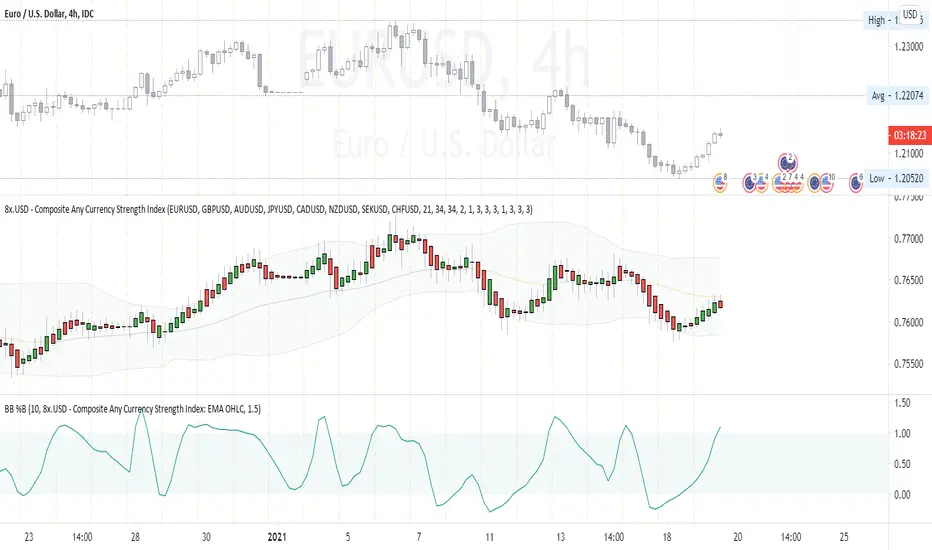
Composite Any Currency Strength IndexThis is a flexible currency strength indicator and you can adjust it to any currency you wish 'to measure'. By default, it is set to measure USD major pairs. Indicator calculates every pair you list, and plots one composite chart in the form of Heikin Ashi candles. Basically, you will get USD index in this case. Similarly, you can get AUD, EUR, CAD, JPY, CHF, etc indexes by specifying corresponding symbols. Remember about base and quote currencies and location of each for correct calculations. Simple adjustments in the script needed if you want to value USD by using USD in both base and quote (counter) currencies.
For example, when calculating USD strength by looking into USDJPY (not into JPYUSD) symbols, you will need to add minus "-" before corresponding security in the script itself, not in the Settings Inputs.
Default study script (with JPYUSD):
// Inputs
...
string sec3 = input(defval="JPYUSD", type=input.symbol, title="Symbol")
...
h_sec3 = security(heikinashi(sec3), timeframe.period, high)
l_sec3 = security(heikinashi(sec3), timeframe.period, low)
o_sec3 = security(heikinashi(sec3), timeframe.period, open)
c_sec3 = security(heikinashi(sec3), timeframe.period, close)
Adjusted study script with USDJPY:
// Inputs
...
string sec3 = input(defval="USDJPY", type=input.symbol, title="Symbol")
...
h_sec3 = -security(heikinashi(sec3), timeframe.period, high)
l_sec3 = -security(heikinashi(sec3), timeframe.period, low)
o_sec3 = -security(heikinashi(sec3), timeframe.period, open)
c_sec3 = -security(heikinashi(sec3), timeframe.period, close)
Unfortunately, I am not a coder specialist and perhaps someone here could improve this indicator for easier and more friendly adjustments. But thanks to variety of symbols on TradingView , you can ignore any changes in the script, and just use symbols with corresponding counter currency offered by this great platform.
Bollinger Bands, 2 x RMA, 4 x SMA/EMA were added for deeper analysing of the index. Other indicators with ability to select data sources (like CCI, StochRSI, Momentum etc) can be separately added to a current chart, but use Composite Any Currency Strength Index data as the source for analysing displayed pair, i.e. by selecting source - Composite Any Currency Strength Index: SMA Close or EMA HLC.
Thank you and good luck everyone!
Bloomberg Mega Board [v2.5 Fixed]Transform your TradingView chart into a professional-grade command center. Designed for traders who need high-level market awareness without switching tabs, this dashboard provides deep, multi-timeframe analysis across US Sectors, Commodities, Currencies, and Crypto.
Key Features
1. Multi-Asset Paging System Pine Script has a limit of 40 security calls, which usually limits how much data you can see. This script bypasses that limitation using a smart Paging System:
Sectors Page: Tracks the top 10 US Sectors (SPY, XLK, XLF, etc.) & Indices.
Commodities Page: Gold, Silver, Oil, Gas, Copper, Corn, etc.
Currencies Page: Major Forex pairs including DXY, EURUSD, USDJPY.
Crypto Page: Top 10 Cryptocurrencies by volume.
Switch pages instantly via the Settings menu.
2. Smart "News" Headlines Since Pine Script cannot access the live internet for news, this script uses an Algorithmic Headline Generator. It analyzes price action and trend alignment to generate a "Market Status" summary:
Full Bull Trend: Intraday + Daily + Weekly trends are all positive.
Strong Rally: Asset is up significantly (>1.25%) on the day.
Heavy Sell-off: Asset is down significantly (<-1.25%) on the day.
Pullback (Buy?): Daily trend is UP, but Intraday is DOWN (potential entry).
Consolidating: Market is chopping sideways.
3. Timeframe Trend Matrix Monitor momentum across the curve with a single glance. The "Trend" columns are powered by the 5 EMA (Exponential Moving Average):
Intraday: Adapts to your current chart timeframe (e.g., switch your chart to 15m to see the 15m trend).
Daily / Weekly / Monthly: These are hard coded to always show the higher timeframe trend, regardless of what chart you are looking at. Trend is determined by price in relation to it's 5 EMA.
4. "Terminal" Aesthetic
Styled with a dark, high-contrast Bloomberg Terminal look.
Uses Amber tickers and Neon status blocks for rapid visual scanning.
Optimized for Full Screen Mode: Hide your main chart candles to turn your monitor into a dedicated data dashboard.
How to Use
Add the indicator to your chart and move it to "New Lower Indicator" Then repeat 4 times for each dashboard.
Open Settings (the gear icon) and find "Select Page".
Choose your desired market view (e.g., Sectors, Crypto, Currencies, Commodities)
Optional: To replicate the full dashboard look, go to your Chart Settings -> Symbol -> Uncheck "Body" and "Borders" to hide the candles behind the table.
2 hours ago
Release Notes
Transform your TradingView chart into a professional-grade command center. Designed for traders who need high-level market awareness without switching tabs, this dashboard provides deep, multi-timeframe analysis across US Sectors, Commodities, Currencies, and Crypto.
Key Features
1. Multi-Asset Paging System Pine Script has a limit of 40 security calls, which usually limits how much data you can see. This script bypasses that limitation using a smart Paging System:
Sectors Page: Tracks the top 10 US Sectors (SPY, XLK, XLF, etc.) & Indices.
Commodities Page: Gold, Silver, Oil, Gas, Copper, Corn, etc.
Currencies Page: Major Forex pairs including DXY, EURUSD, USDJPY.
Crypto Page: Top 10 Cryptocurrencies by volume.
Switch pages instantly via the Settings menu.
2. Smart "News" Headlines Since Pine Script cannot access the live internet for news, this script uses an Algorithmic Headline Generator. It analyzes price action and trend alignment to generate a "Market Status" summary:
Full Bull Trend: Intraday + Daily + Weekly trends are all positive.
Strong Rally: Asset is up significantly (>1.25%) on the day.
Heavy Sell-off: Asset is down significantly (<-1.25%) on the day.
Pullback (Buy?): Daily trend is UP, but Intraday is DOWN (potential entry).
Consolidating: Market is chopping sideways.
3. Timeframe Trend Matrix Monitor momentum across the curve with a single glance. The "Trend" columns are powered by the 5 EMA (Exponential Moving Average):
Intraday: Adapts to your current chart timeframe (e.g., switch your chart to 15m to see the 15m trend).
Daily / Weekly / Monthly: These are hard coded to always show the higher timeframe trend, regardless of what chart you are looking at. Trend is determined by price in relation to it's 5 EMA.
4. "Terminal" Aesthetic
Styled with a dark, high-contrast Bloomberg Terminal look.
Uses Amber tickers and Neon status blocks for rapid visual scanning.
Optimized for Full Screen Mode: Hide your main chart candles to turn your monitor into a dedicated data dashboard.
How to Use
Add the indicator to your chart and move it to "New Lower Indicator" Then repeat 4 times for each dashboard.
Open Settings (the gear icon) and find "Select Page".
Choose your desired market view (e.g., Sectors, Crypto, Currencies, Commodities)
Optional: To replicate the full dashboard look, go to your Chart Settings -> Symbol -> Uncheck "Body" and "Borders" to hide the candles behind the table.

Chaikin Momentum Scalper🎯 Overview
The Chaikin Momentum Scalper is a powerful trading strategy designed to identify momentum shifts in the market and ride the trend for maximum profits. This strategy is ideal for trading the USD/JPY currency pair on a 15-minute chart, making it perfect for high-frequency trading (HFT). Whether you’re starting with a small account of $1,000 or managing a larger portfolio, this strategy can scale to suit your needs.
________________________________________
🔑 How the Strategy Works
Here’s how the Chaikin Momentum Scalper identifies trade opportunities:
1️⃣ Momentum Detection
The core of this strategy is the Chaikin Oscillator, a tool that measures the flow of money into or out of a market. It helps us understand whether buyers (bulls) or sellers (bears) are in control.
• When the indicator crosses above zero, it signals that buying momentum is picking up – a buying opportunity.
• When the indicator crosses below zero, it signals that selling momentum is increasing – a selling opportunity.
2️⃣ Trend Confirmation
We don’t just jump into trades based on momentum alone. We also use a 200-period simple moving average (SMA) to confirm the overall trend.
• If the price is above the SMA, it confirms an uptrend, so we look for buy trades.
• If the price is below the SMA, it confirms a downtrend, so we look for sell trades.
This way, we align our trades with the broader market direction for higher success rates.
3️⃣ Volatility & Risk Management
We use a tool called the Average True Range (ATR) to measure market volatility. This helps us:
• Set a stop-loss (where we’ll exit the trade if the market moves against us) at a safe distance from our entry point.
• Set a take-profit (where we’ll lock in profits) at a target that’s larger than the stop-loss, ensuring a good reward-to-risk ratio.
This approach adapts to the market’s behavior, tightening stops in calmer conditions and widening them when volatility increases.
________________________________________
📈 Why This Strategy Works
✅ It combines momentum and trend-following principles, increasing the chances of trading in the right direction.
✅ It dynamically adjusts risk levels based on market volatility, keeping losses small and profits big.
✅ It’s scalable – perfect for both small accounts (like $1,000) and larger, corporate-sized portfolios.
✅ It has been deep-backtested on USD/JPY 15-minute charts, proving its consistency across different market conditions.
________________________________________
📝 Important Notes
📌 This strategy is best used for USD/JPY on a 15-minute chart, making it great for high-frequency trading while you continue to build and refine your trading system.
📌 It’s designed to work on both small ($1,000+) and large accounts, so it can grow with you as your capital increases.
📌 While it has passed deep backtesting on this pair and timeframe, remember that no strategy is perfect. It’s crucial to test it yourself, start with a demo account, and apply proper risk management before trading real money.
🌟 Final Thoughts
The Chaikin Momentum Scalper is a solid, adaptable trading approach combining momentum, trend direction, and volatility awareness. If you’re looking for a strategy to kick-start your trading journey—or to add to your existing system—it offers a strong foundation.

Smart Margin Zone
SMART MARGIN ZONE - CME-BASED SUPPORT & RESISTANCE INDICATOR
TITLE FOR PUBLICATION:
Smart Margin Zone - CME Margin-Based Support and Resistance
CATEGORY:
Support and Resistance
SHORT DESCRIPTION (for preview):
Automatically plots margin zones based on CME Group requirements. These zones represent critical price levels where leveraged traders face margin calls, creating natural support and resistance through forced liquidations.
═══════════════════════════════════════════════════════════════
FULL DESCRIPTION FOR TRADINGVIEW:
═══════════════════════════════════════════════════════════════
📊 Smart Margin Zone - Professional Trading Zones Based on CME Data
This indicator automatically calculates and displays margin zones derived from official CME Group margin requirements. These zones represent critical price levels where traders using leverage receive margin calls, triggering forced position closures that create natural support and resistance levels.
═══════════════════════════════════════════════════════════════
🎯 CORE CONCEPT
═══════════════════════════════════════════════════════════════
When price reaches calculated margin zones, traders using 2:1 or 4:1 leverage on CME futures receive margin calls. Brokers automatically liquidate these positions, creating waves of buying or selling pressure that form strong support and resistance levels.
This is not theoretical - it's based on actual margin requirements from CME Group, the world's largest derivatives marketplace.
═══════════════════════════════════════════════════════════════
📐 CALCULATION METHODOLOGY
═══════════════════════════════════════════════════════════════
The indicator uses the following formula to calculate zone sizes:
Zone Size = (Margin Requirement / Tick Value) × Tick Size × 1.10
Where:
• Margin Requirement = Official CME initial margin (updated November 2024)
• Tick Value = Dollar value of minimum price movement
• Tick Size = Minimum price increment
• 1.10 = 10% buffer for realistic zone width
SUPPORTED INSTRUMENTS WITH CME DATA:
Currency Pairs:
• EURUSD: $2,100 margin → 0.0168 zone size
• GBPUSD: $1,800 margin → 0.0144 zone size
• AUDUSD: $1,300 margin → 0.0065 zone size
• NZDUSD: $1,100 margin → 0.0055 zone size
• USDJPY: $3,200 margin → custom calculation
• USDCAD: $950 margin → calculated
• USDCHF: $1,650 margin → calculated
Commodities:
• Gold (XAUUSD): $8,000 margin → 80 points zone size
• Silver (XAGUSD): $6,500 margin → calculated
• WTI Crude Oil: $4,500 margin → calculated
═══════════════════════════════════════════════════════════════
🔍 HOW IT WORKS
═══════════════════════════════════════════════════════════════
1. SWING POINT DETECTION
The indicator automatically identifies swing highs and swing lows using a configurable lookback period (default 10 bars). These become anchor points for zone calculations.
2. FIVE ZONE LEVELS
From each swing point, five zone levels are calculated:
• Zone 1/4 (25%) - First correction level
• Zone 1/2 (50%) - KEY ZONE for trend determination
• Zone 3/4 (75%) - Intermediate level
• Zone 1/1 (100%) - Full margin zone (strongest level)
• Zone 5/4 (125%) - Extended zone
3. TREND IDENTIFICATION
• Close above Zone 1/2 resistance = Bullish trend
• Close below Zone 1/2 support = Bearish trend
• Between zones = Range/consolidation
4. HISTORICAL CONTEXT
Current zones are displayed prominently with fills and labels. Historical zones appear as thin, semi-transparent lines for context without cluttering the chart.
═══════════════════════════════════════════════════════════════
⚙️ FEATURES
═══════════════════════════════════════════════════════════════
AUTOMATED CALCULATION:
✅ Auto-detection of swing highs and lows
✅ Real-time zone updates as new swings form
✅ CME margin data built-in for major instruments
✅ Manual override option for custom calculations
VISUAL CLARITY:
✅ Color-coded zones (red=resistance, green=support)
✅ Adjustable transparency for fills and lines
✅ Current zones bold with fills and price labels
✅ Historical zones thin and transparent
✅ Swing point markers show calculation origins
CUSTOMIZATION:
✅ Show/hide individual zone levels (1/4, 1/2, 3/4, 1/1, 5/4)
✅ Toggle historical zones on/off
✅ Adjustable lookback period (5-50 bars)
✅ Customizable colors for all elements
✅ Line width and transparency controls
✅ Zone extension options (none/right/both)
TREND ANALYSIS:
✅ Optional trend background coloring
✅ Customizable trend colors and transparency
✅ Real-time trend identification display
STATISTICS:
✅ Live statistics table showing:
- Current instrument
- Active zone size
- Calculation mode
- Current trend direction
- Number of zones displayed
ALERTS:
✅ Zone 1/2 breakout (up/down)
✅ Full margin zone 1/1 reached
✅ Customizable alert messages
═══════════════════════════════════════════════════════════════
📈 TRADING APPLICATIONS
═══════════════════════════════════════════════════════════════
ENTRY SIGNALS:
• Bounces from zone levels = potential entry points
• Zone 1/2 breakouts = trend continuation entries
• Zone rejections = reversal opportunities
RISK MANAGEMENT:
• Zone levels = logical stop-loss placement
• Zone 1/1 = maximum risk level
• Zone spacing = position sizing guide
PROFIT TARGETS:
• Next zone level = first target
• Zone 1/1 = full profit target
• Zone breakouts = extended targets
TREND CONFIRMATION:
• Price above Zone 1/2 resistance = confirmed uptrend
• Price below Zone 1/2 support = confirmed downtrend
• Consolidation between zones = wait for breakout
═══════════════════════════════════════════════════════════════
📚 USAGE INSTRUCTIONS
═══════════════════════════════════════════════════════════════
GETTING STARTED:
1. Add indicator to chart of any supported instrument
2. Zones automatically calculate and display
3. Adjust swing detection period if needed (default 10 works well)
4. Customize colors and visibility to your preference
OPTIMAL SETTINGS:
• Best timeframes: H1, H4, Daily, Weekly
• Default swing length (10) suitable for most markets
• Show 2-3 historical zones for context
• Enable swing point markers to see calculation origins
INTERPRETATION:
• Watch for price reactions at zone boundaries
• Strong bounces = respect for margin level
• Clean breaks = momentum continuation
• Multiple touches = zone strength confirmation
SET ALERTS:
• Zone 1/2 breakouts for trend entries
• Zone 1/1 reaches for profit-taking
• Custom alerts for your specific strategy
═══════════════════════════════════════════════════════════════
⚠️ IMPORTANT NOTES
═══════════════════════════════════════════════════════════════
DATA ACCURACY:
• CME margin requirements updated November 2024
• Margins change periodically - check CME Group website
• Manual mode available for latest margin data
• Indicator provides analysis tool, not financial advice
STATISTICAL PERFORMANCE:
• Historical data shows >60% probability of continued movement after Zone 1/2 breakout
• Zone effectiveness varies by market conditions
• Best results in trending markets with clear swings
LIMITATIONS:
• Margin requirements change - monitor CME updates
• Works best on liquid instruments with clear swings
• Not a standalone trading system
• Should be combined with additional analysis
═══════════════════════════════════════════════════════════════
🔧 METHODOLOGY CREDIT
═══════════════════════════════════════════════════════════════
This indicator is based on the margin zones concept developed by Alexander Bazylev (BTrade indicator for MetaTrader platforms).
The TradingView implementation has been completely rewritten with original enhancements:
• Multiple zone levels instead of single level
• Automatic swing point detection algorithm
• Direct CME data integration
• Historical zone visualization
• Advanced customization options
• Comprehensive statistics and alerts
All code is original and specifically designed for TradingView's Pine Script v5 environment.
═══════════════════════════════════════════════════════════════
💡 BEST PRACTICES
═══════════════════════════════════════════════════════════════
COMBINE WITH:
• Volume analysis for confirmation
• Trend indicators for direction bias
• Price action patterns at zones
• Higher timeframe analysis
AVOID:
• Trading against strong trends at minor zones
• Over-leveraging based solely on zone placement
• Ignoring broader market context
• Expecting perfect bounces every time
OPTIMIZE:
• Adjust swing length for different timeframes
• Shorter period (5-7) for intraday trading
• Longer period (15-20) for swing trading
• Test historical effectiveness on your instruments
═══════════════════════════════════════════════════════════════
📖 EDUCATIONAL VALUE
═══════════════════════════════════════════════════════════════
This indicator helps traders understand:
• How institutional margin requirements affect price
• Where forced liquidations create pressure
• Natural support and resistance formation
• Relationship between leverage and price levels
• Market structure and key technical levels
═══════════════════════════════════════════════════════════════
🔄 VERSION HISTORY
═══════════════════════════════════════════════════════════════
Version 1.0 (Initial Release):
• CME-based zone calculation for 10 instruments
• Automatic swing high/low detection
• 5 zone levels with customizable display
• Historical zones with transparency control
• Swing point markers
• Trend background indicator
• Live statistics table
• Multiple alert conditions
• Fully customizable colors and styles
• English language interface
═══════════════════════════════════════════════════════════════
📞 SUPPORT & FEEDBACK
═══════════════════════════════════════════════════════════════
Questions or suggestions? Leave a comment below!
If you find this indicator useful:
⭐ Please leave a like
💬 Share your experience in comments
🔔 Follow for updates and new indicators
═══════════════════════════════════════════════════════════════
⚖️ DISCLAIMER
═══════════════════════════════════════════════════════════════
This indicator is provided for educational and analytical purposes only. It is not financial advice and should not be the sole basis for trading decisions.
• Past performance does not guarantee future results
• Trading involves substantial risk of loss
• CME margin requirements subject to change
• Always do your own research and risk management
• Consult a financial advisor for investment advice
The creator is not responsible for any trading losses incurred through use of this indicator.

MMI (Multi.Index.Indicator)Multi-Index Momentum Indicator (MMI)
The Multi-Index Momentum Indicator (MMI) is a custom TradingView Pine Script indicator designed to calculate and display the momentum difference between the base and quote indexes of various currency pairs. This indicator helps traders identify the relative strength or weakness of a currency pair by comparing the momentum of its base and quote indexes.
Features:
Currency Pair Detection: The indicator automatically detects the currency pair of the current chart and selects the appropriate base and quote indexes for that pair.
Index Data Retrieval: It fetches the closing prices of the base and quote indexes for the specified timeframe.
Momentum Calculation:
The indicator calculates the 14-period momentum for both the base and quote indexes and then computes the momentum difference.
Visual Representation: The momentum difference is plotted on the chart as a colored line. If the momentum difference is positive, the line is green; if negative, the line is red.
Data Availability Check:
The script checks if the index data is available. If any index data is missing, the script displays a red label on the chart indicating which index data is missing.
Zero Line: A horizontal line at the zero level is plotted for reference.
Supported Currency Pairs and Their Indexes:
USDJPY: Base Index - DXY, Quote Index - JPYX
EURUSD: Base Index - EXY, Quote Index - DXY
GBPUSD: Base Index - BXY, Quote Index - DXY
AUDUSD: Base Index - AXY, Quote Index - DXY
USDCHF: Base Index - DXY, Quote Index - SXY
USDCAD: Base Index - DXY, Quote Index - CXY
GBPJPY: Base Index - BXY, Quote Index - JPYX

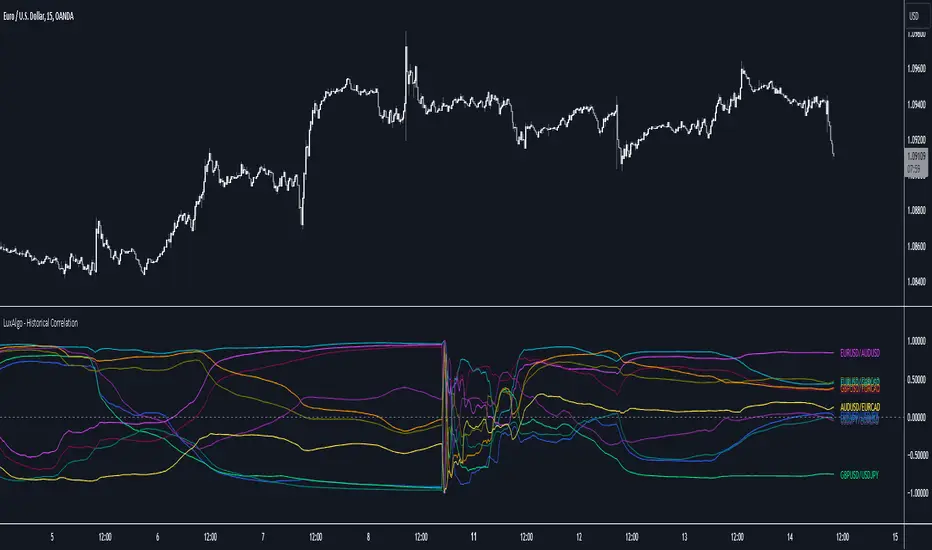
Historical Correlation [LuxAlgo]The Historical Correlation tool aims to provide the historical correlation coefficients of up to 10 pairs of user-defined tickers starting from a user-defined point in time.
Users can choose to display the historical values as lines or the most recent correlation values as a heat map.
🔶 USAGE
This tool provides historical correlation coefficients, the correlation coefficient between two assets highlight their linear relationship and is always within the range (-1, 1).
It is a simple and easy to use statistical tool, with the following interpretation:
Positive correlation (values close to +1.0): the two assets move in sync, they rise and fall at the same time.
Negative correlation (values close to -1.0): the two assets move in opposite directions: when one goes up, the other goes down and vice versa.
No correlation (values close to 0): the two assets move independently.
The user must confirm the selection of the anchor point in order for the tool to be executed; this can be done directly on the chart by clicking on any bar, or via the date field in the settings panel.
For the parameter Anchor period , the user can choose between the following values NONE, HOURLY, DAILY, WEEKLY, MONTHLY, QUARTERLY and YEARLY. If NONE is selected, there will be no resetting of the calculations, otherwise the calculations will start from the first bar of the new period.
There is a wide range of trading strategies that make use of correlation coefficients between assets, some examples are:
Pair Trading: Traders may wish to take advantage of divergences in the price movements of highly positively correlated assets; even highly positively correlated assets do not always move in the same direction; when assets with a correlation close to +1.0 diverge in their behavior, traders may see this as an opportunity to buy one and sell the other in the expectation that the assets will return to the likely same price behavior.
Sector rotation: Traders may want to favor some sectors that are expected to perform in the next cycle, tracking the correlation between different sectors and between the sector and the overall market.
Diversification: Traders can aim to have a diversified portfolio of uncorrelated assets. From a risk management perspective, it is useful to know the correlation between the assets in your portfolio, if you hold equal positions in positively correlated assets, your risk is tilted in the same direction, so if the assets move against you, your risk is doubled. You can avoid this increased risk by choosing uncorrelated assets so that they move independently.
Hedging: Traders may want to hedge positions with correlated assets, from a hedging perspective, if you are long an asset, you can hedge going long a negative correlated asset or going short a positive correlated asset.
Traders generally need to develop awareness, a key point is to be aware of the relationships between the assets we hold or trade, the historical correlation is an invaluable tool in our arsenal which allows us to make better informed decisions.
On this chart we have an example of historical correlations for several futures markets.
We can clearly see how positively correlated the Nasdaq100 and Dow30 are with the SP500 over the whole period, or how the correlation between the Euro and the SP500 falls from almost +85% to almost -4% since 2021.
As we can see, correlations, like everything else in the market, are not static and vary over time depending on many factors, from macro to technical and everything in between.
🔹 Heatmap
The chart above shows the tool with the default settings and the Drawing Mode set to 'HEATMAP'.
We can see the current correlation between the assets, in this case the FX pairs.
The highest positive correlation is +90% (+0.90) between EURUSD and GBPUSD.
The highest negative correlation is -78% (-0.78) between EURUSD and USDJPY.
The pair with no correlation is AUDUSD and EURCAD with 1% (0.01)
On the above chart we can see the current correlations for the futures markets.
Currently, the assets that are less correlated to the SP500 are NaturalGas and the Euro, the more positive correlations are Nasdaq100 and Dow20, and the more negative correlations are the Yen, Treasury Bonds and 10-Year Notes.
🔶 DETAILS
🔹 Anchor Period
This chart shows the standard FX correlations with the Anchor Period set to `MONTHLY`.
We can clearly see how the calculations restart with the new month, in this case we can clearly see the differences between the correlations from month to month.
Let us look at the correlation coefficient between GBPUSD and USDJPY
In January, their correlation started at close to -100%, rose to close to +50%, only to fall to close to 0% and remain there for the second half of the month.
In February it was -90% in the first few days of the month and is now around -57%.
And between AUDUSD and EURCAD
Last month their correlation was negative for most of the month, reaching -70% and ending around -14%.
This month their correlation has never gone below +21% and at the time of writing is close to +53%.
🔶 SETTINGS
Anchor point: Starting point from which the tool is executed
Anchor period: At the beginning of each new period, the tool will reset the calculations
Pairs from 1 to 10: For each pair of tickers, you can: enable/disable the pair, select the color and specify the two tickers from which you wish to obtain the correlation
🔹 Style
Drawing Mode: Output style, `LINES` will show the historical correlations as lines, `HEATMAP` will show the current correlations with a color gradient from green for correlations near 1 to red for correlations near -1.
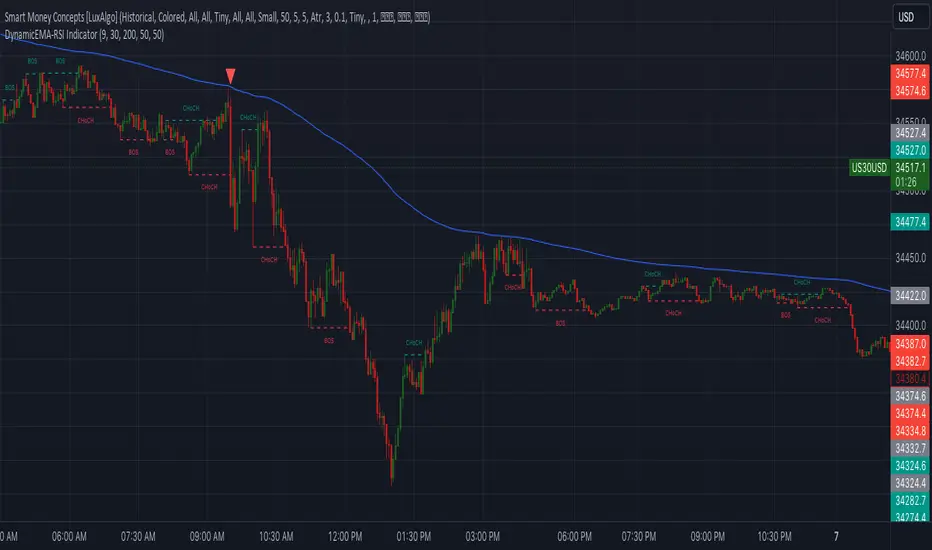
DynamicEMA-RSI IndicatorIntroducing the 'Custom EMA and RSI Indicator' – a powerful trading tool compatible with US30 and USDJPY. This indicator is designed to provide high-precision trading signals once a day. It combines the expertise of Exponential Moving Averages (EMA) and Relative Strength Index (RSI) to identify optimal entry points in the market. With a track record of high accuracy, this indicator can help you make informed trading decisions. It's the perfect addition to your trading arsenal for precision trading on the US30 and USDJPY currency pairs."
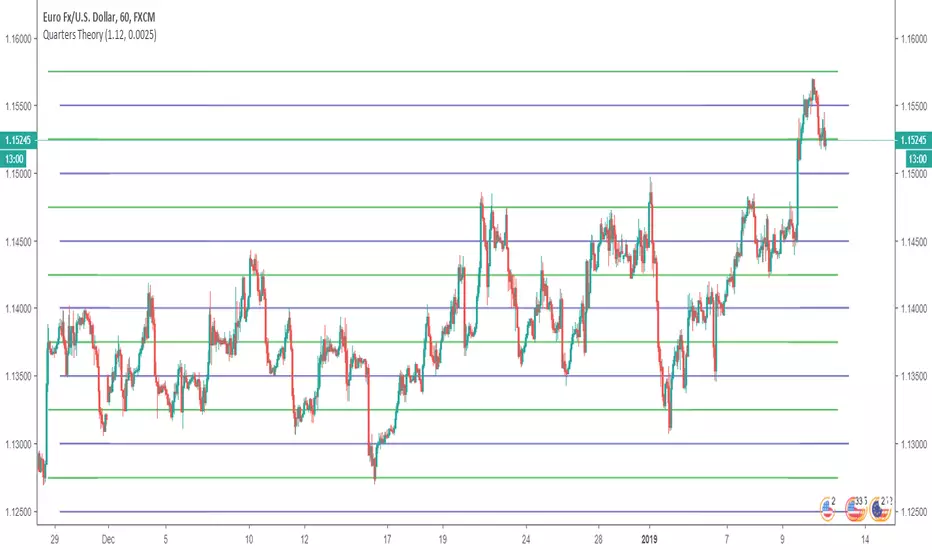
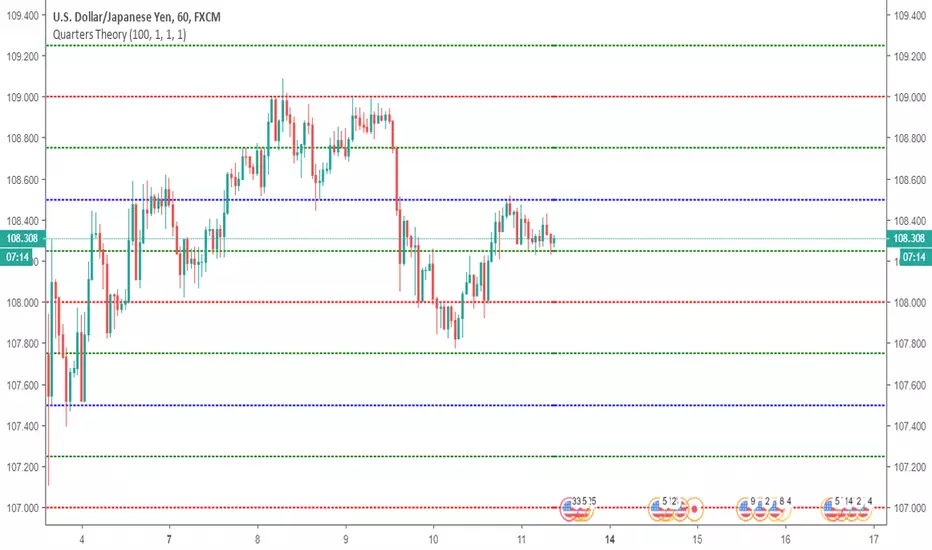
Quarters TheoryThis indicator helps you to put Quarter Theory lines on your chart. It's defaults are meant for EURUSD , but you can change it for other charts. There are 16 lines in this indicator.
For EURUSD recommended settings right now are: Starting Price (Bottom):1.12 and Gap: 0.0025
USDCAD: Starting Price (Bottom):1.315 and Gap: 0.005
EURAUD: Starting Price (Bottom):1.59 and Gap: 0.005
USDJPY: Starting Price (Bottom):107 and Gap: 0.5
USDCHF: Starting Price (Bottom):0.97 and Gap: 0.0025
BTCUSD: Starting Price (Bottom):3200 and Gap: 100
XAUUSD: Starting Price (Bottom): 1230 and Gap: 5
These settings are the ones I use, but you could find better settings for yourself.
Works very well on JPY pairs.
Horizontal LinesHorizontal lines help you to put Quarter Theory lines on your chart. It's defaults are meant for EURUSD , but you can change it for other charts. There are 16 lines in this indicator.
For EURUSD recommended settings right now are: Starting Price (Bottom):1.12 and Gap: 0.0025
USDCAD: Starting Price (Bottom):1.315 and Gap: 0.005
EURAUD: Starting Price (Bottom):1.59 and Gap: 0.005
USDJPY: Starting Price (Bottom):107 and Gap: 0.5
USDCHF: Starting Price (Bottom):0.97 and Gap: 0.0025
BTCUSD: Starting Price (Bottom):3200 and Gap: 100
XAUUSD: Starting Price (Bottom): 1230 and Gap: 5
These settings are the ones I use, but you could find better settings for yourself. It works very well on JPY pairs.