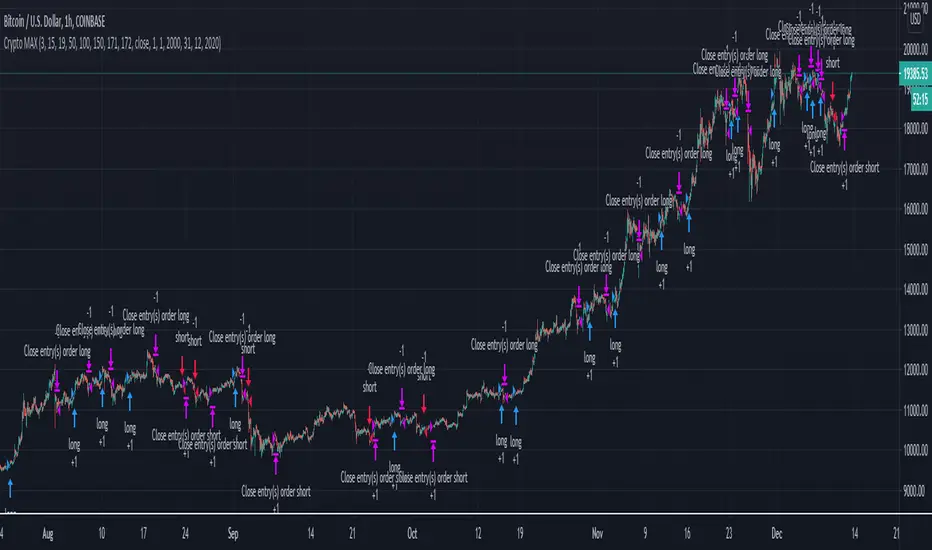
CRYPTO HA Strategy money maker long termToday I bring you another amazing strategy.
Its made of 2 EMA in this case 50 and 100.
At the same time, internaly for candles we calculate the candles using the HA system ( while still using in live the normal candles). This way we can assure that even if we use HA candles, we avoid repainting, and its legit.
We first calculate the HA candles based on the EMA 50 values, and after that , we use that candle properties to apply to EMA 100.
Once we have that, for entries we have the next conditions :
sell = o2 > c2 and o2 < c2 and time_cond
buy = o2 < c2 and o2 > c2 and time_cond
For sell : Our open from HA 100 is bigger than Close from ha 100, and the previous open is smaller than previous close
For long : Our open from ha 100 is smaller than close from ha 100 and the previous open is bigger than previous close.
Then we have 2 options :
If we wnat to go only long , which is my prefered version ,or the original one where we go both long and short.
I found that the best results are in general around bigger timeframes, 1h+ , 3h works the best so far on my tests.
For exit we have 2 versions :
1 lets say we had a long signal, as soon as we have a short signal we close the trade. Viceversa for short.
2. Is based on price % movement. In this case I use 7.5% price movement of asset.
We have no TP in use for this system.
For the purpose of this test I use 10.000 $ account. For test I use 100% of it, without any leverage.
I use the SL based on price movement , which is a very risky tool, since it can fluctuate even at 20-30% of our capital.
For comission I used 0.1% for each deal, and a slippage of 5 points.
Be cautious with this system !
If you have any questions , message me.
Cerca negli script per "usdt"

Crypto MultiTrend multi timeframesHello, today I bring you another crypto strategy which can work with multiple timeframes and most of crypto currencies
Its made entirelly of multiple EMA , of different lengths : like super fast, fast, normal, slow and very slow
We also combine a little bit of price action together with the trend direction both for entry and for exits, to have a more precise control.
The rules for long close is above all EMA's, they are in ascending order and the at same time close is bigger than the previous high, and previous high > second previous high, close > 3rd previous high , close > 4th previous high, close > 5th previous high, 5th high > 6th high.
For short we have the same, but instead of high, we use lows, and instead of > we use < .
As exit we have 2 conditions for long and 2 for short
To exit long we have : super fast ema < fast ema and fast ema < normal and normal < slow ema. For short, they would be the opposite, using > sign.
The second exit for long is when our current low crosses below 4 of ours EMA during the same candle. For short, is when the high crosses above 4 of ours EMA during the same candle.
CAUTIOUS : Currently it uses not risk management system, so in this current condition is extremely risky . Be careful
If you have any questions lets me know
CRYPTO Trend Direction Multiple EMA'sToday I bring an indicator specialized in crypto markets.
Its made of multiples EMA : very fast, fast, normal, slow, very slow
The logic behind its simple :
For long : we check that the EMA are in ascending order like EMA 5 > EMA 10 > EMA 20 .... and at the same time that last close of candle is above all of them.
For short : we check that the EMA are in descending order like EMA 5 < EMA 10 < EMA 20 .... and at the same time last close of candle is below all of them.
It can be used with all time frames.
Enjoy it !

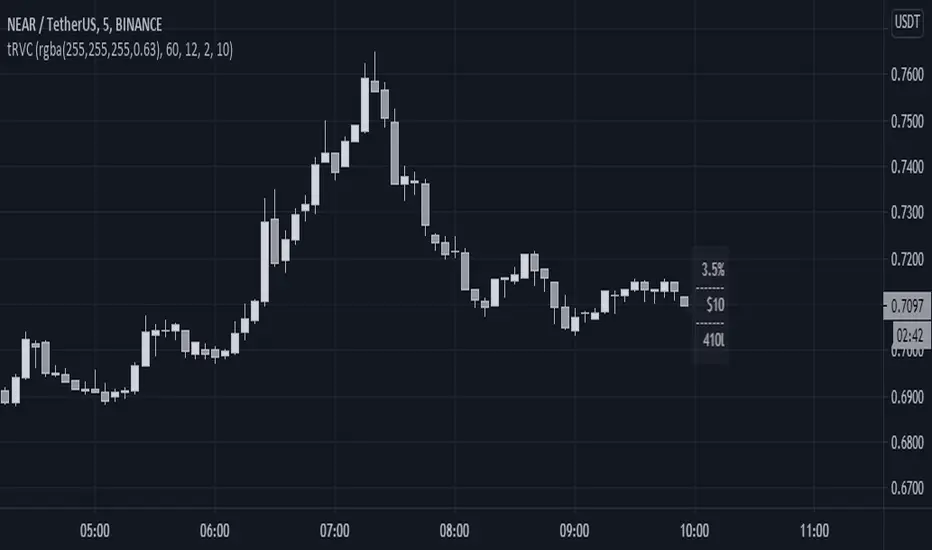
Risk Volume CalculatorBid volume calculation from average volatility
On label (top to bot):
Percents - averaged by moving in timeframe resolution
Cash - selected risk volume in usdt
Lots - bid volume in lots wich moving in Percents with used leverage is Cash
U can switch on channels to visualise volatility*2 channel or stakan settings
[blackcat] L1 Bitcoin Guppy Whale Pump Dump OscillatorLevel: 1
Background
The Guppy Multiple Moving Average (GMMA) is a technical indicator that identifies changing trends, breakouts, and trading opportunities in the price of an asset by combining two sets of moving averages (MA) with different time periods. There is a short term group of MAs and a long term group of MAs.
One of the biggest differences between cryptocurrency and traditional financial markets is that cryptocurrency is based on blockchain technology. Individual investors can discover the direction of the flow of large funds through on-chain transfers. These large funds are often referred to as Whale. Whale can have a significant impact on the price movements of cryptocurrencies, especially Bitcoin . Therefore, how to monitor Whale trends is of great significance both in terms of fundamentals and technical aspects.
Function
L1 Bitcoin Guppy Whale Pump Dump Oscillator is innovative because it was moved from main chart to aux chart and the input source of Guppy moving average was changed in to bias rate of key EMAs. This makes it work as a Guppy oscillator. This Guppy oscillator was designed and optimized to detect whale pump and dump behavior for BTCUSD or BTCUSDT trading pairs. When whale pump is detected, yellow candles appear; when whale dump is detected, fuchsia candles appear.
Key Signal
di,d1~d8 ---> Guppy oscillator lines
pump --> whale pump detector
dump --> whale dump detector
Pros and Cons
Pros:
1. easy observe price trend
2. it detects whale pump and dump
Cons:
1. no explicit entries are disclosed
2. only optimized for Bitcoin usd/usdt trading pairs
Remarks
Courtesy of @LunaOwl " Rainbow Color Gradient" for colorful Guppy oscillator lines in this script
Readme
In real life, I am a prolific inventor. I have successfully applied for more than 60 international and regional patents in the past 12 years. But in the past two years or so, I have tried to transfer my creativity to the development of trading strategies. Tradingview is the ideal platform for me. I am selecting and contributing some of the hundreds of scripts to publish in Tradingview community. Welcome everyone to interact with me to discuss these interesting pine scripts.
The scripts posted are categorized into 5 levels according to my efforts or manhours put into these works.
Level 1 : interesting script snippets or distinctive improvement from classic indicators or strategy. Level 1 scripts can usually appear in more complex indicators as a function module or element.
Level 2 : composite indicator/strategy. By selecting or combining several independent or dependent functions or sub indicators in proper way, the composite script exhibits a resonance phenomenon which can filter out noise or fake trading signal to enhance trading confidence level.
Level 3 : comprehensive indicator/strategy. They are simple trading systems based on my strategies. They are commonly containing several or all of entry signal, close signal, stop loss, take profit, re-entry, risk management, and position sizing techniques. Even some interesting fundamental and mass psychological aspects are incorporated.
Level 4 : script snippets or functions that do not disclose source code. Interesting element that can reveal market laws and work as raw material for indicators and strategies. If you find Level 1~2 scripts are helpful, Level 4 is a private version that took me far more efforts to develop.
Level 5 : indicator/strategy that do not disclose source code. private version of Level 3 script with my accumulated script processing skills or a large number of custom functions. I had a private function library built in past two years. Level 5 scripts use many of them to achieve private trading strategy.

DePriExchange weighted price for cryptocurrencies
DECENTRALIZED PRICE CHART FOR DECENTRALIZED WORLD
See non-manipulated , globally price action that comes from whole liquidity!
The main idea behind this script is that...
The value of each trading pair finally determined globally and the price displayed in exchanges is its own and not global! differences between exchanges, reduced to near zero gradually by market makers and arbitrages, so..
Every min tick price changes Must be backed by liquidity to be part of the global fluctuations
more liquidity gives it more credibility
more credibility give it more weight
..Against opposing movements.
This script can collect price of crypto pairs from 12 exchanges that listed on TV and have effective volume.
In the first step, summarizes the volume of all exchanges and creates the total volume
In the next step, divide each exchange volume to total volume to obtain relative weight of each exchange.
In the final step, multiply each exchange price to weight of itself and summarizes these numbers .. now, we have Exchange weighted price!
The results on high liquidity pairs like BTCUSDT, ETHUSDT, is not much differ then simple chart but when you apply it on lower liquidity, lower time frames of altcoins, you realize its benefits and usefulness. Altcoins chart in composite and simple mode is very differ, I hope you enjoy from TRUE CHART.
With this, also you can..
Filter and smooth candlestick chart with SMA or EMA
Plot a line chart of pair at your desired frame separate from the main chart for monitor important price levels
Get realtime report of whole volume of pair on included exchanges
Get realtime report of each exchange weight and share
Note.1:
some of pairs queted on more than one like BTCUSD, BTCUSDT, BTCUSDC and etc. In this pairs we choose the one that usually has more volume on that exchange.
Note.2:
At this time, supported queted currencies are BTC, ETH, USD, USDT, BUSD, USDC, USDK.
Note.3:
This script is relatively heavy! This is not cuz of bad coding.
Each bar compution contains at least one plot and some of security calls, so 10 to 15 seconds is normal load time.
Note.4:
You can combine this with your price action base scripts and use balanced OHLCV. The necessary explanations about this are available in the code.
Note.5:
You must only include exchanges that support your ticker, Otherwise you will receive an error.
I hope it comes useful to you.

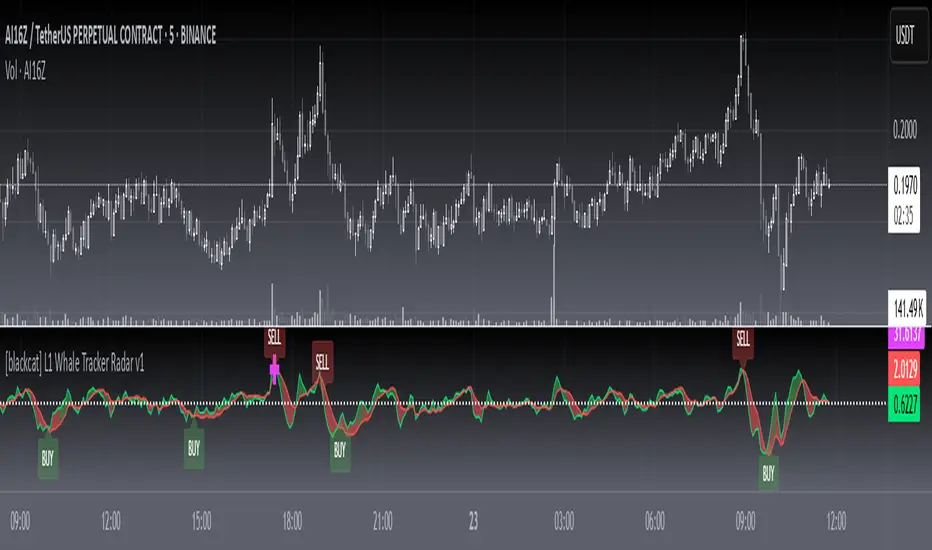
L1 Whale Tracker Radar v1Level: 1
Background
One of the biggest differences between cryptocurrency and traditional financial markets is that cryptocurrency is based on blockchain technology. Individual investors can discover the direction of the flow of large funds through on-chain transfers. These large funds are often referred to as Whale. Whale can have a significant impact on the price movements of cryptocurrencies, especially Bitcoin . Therefore, how to monitor Whale trends is of great significance both in terms of fundamentals and technical aspects.
Function
By modeling the behavior of Whale and individuals, L1 Whale Tracker Radar script can not only simply describe the behavior trends of Whale and individuals, but also generate some simple buying and selling points.
Key Signal
selradar indicates top region is reached.
buyradar indicates bottom region is reached.
buy is the long/xshort entry point suggested.
sell is the short/xlong entry point suggested.
Pros and Cons
Pros:
1. Detect Whale pump and trend.
2. Not a mature and accurate buy and sell script but provide alerts of Whale movements.
3. When it resonante with Buy signal, it has higher confidence level.
Cons:
1. Only use simple moving average to depict Whale behaviors so some info may be missing.
2. It is sensitive and may have noise inside and generate fake signal. BINANCE:BTCUSDT
Remarks
You can use this to confirm blockchain large fund transfer activities. E.g. Large amount of USDT flows into large exchanges.
Readme
In real life, I am a prolific inventor. I have successfully applied for more than 60 international and regional patents in the past 12 years. But in the past two years or so, I have tried to transfer my creativity to the development of trading strategies. Tradingview is the ideal platform for me. I am selecting and contributing some of the hundreds of scripts to publish in Tradingview community. Welcome everyone to interact with me to discuss these interesting pine scripts.
The scripts posted are categorized into 5 levels according to my efforts or manhours put into these works.
Level 1 : interesting script snippets or distinctive improvement from classic indicators or strategy. Level 1 scripts can usually appear in more complex indicators as a function module or element.
Level 2 : composite indicator/strategy. By selecting or combining several independent or dependent functions or sub indicators in proper way, the composite script exhibits a resonance phenomenon which can filter out noise or fake trading signal to enhance trading confidence level.
Level 3 : comprehensive indicator/strategy. They are simple trading systems based on my strategies. They are commonly containing several or all of entry signal, close signal, stop loss, take profit, re-entry, risk management, and position sizing techniques. Even some interesting fundamental and mass psychological aspects are incorporated.
Level 4 : script snippets or functions that do not disclose source code. Interesting element that can reveal market laws and work as raw material for indicators and strategies. If you find Level 1~2 scripts are helpful, Level 4 is a private version that took me far more efforts to develop.
Level 5 : indicator/strategy that do not disclose source code. private version of Level 3 script with my accumulated script processing skills or a large number of custom functions. I had a private function library built in past two years. Level 5 scripts use many of them to achieve private trading strategy.
L1 Bitcoin Whale Pump DetectorLevel: 1
Background
One of the biggest differences between cryptocurrency and traditional financial markets is that cryptocurrency is based on blockchain technology. Individual investors can discover the direction of the flow of large funds through on-chain transfers. These large funds are often referred to as Whale. Whale can have a significant impact on the price movements of cryptocurrencies, especially Bitcoin. Therefore, how to monitor Whale trends is of great significance both in terms of fundamentals and technical aspects.
Function
L1 Bitcoin Whale Pump Detector script This is a simple technical indicator that judges whether Whale is involved in the relationship between price increase and trading volume. Its purpose is not to accurately judge Whale behavior, but to provide a starting point for more Pine lovers to develop more advanced Whale monitoring programs.
Key Signal
pumpcond1 use price information alone with 7% as a threshold
pumpcond2 use both price and volume infomation.
Pros and Cons
Pros:
1. Detect Whale pump in large time frame.
2. Not a mature and accurate buy and sell script but provide alerts of Whale movements.
3. When it resonante with Buy signal, it has higher confidence level.
Cons:
1. Only detect Whale Pump, not Whale Dump is realized.
2. Only provide large fund information, not an accurate trading signal generator.
Remarks
You can use this to confirm blockchain large fund transfer activities. E.g. Large amount of USDT flows into large exchanges.
Readme
In real life, I am a prolific inventor. I have successfully applied for more than 60 international and regional patents in the past 12 years. But in the past two years or so, I have tried to transfer my creativity to the development of trading strategies. Tradingview is the ideal platform for me. I am selecting and contributing some of the hundreds of scripts to publish in Tradingview community. Welcome everyone to interact with me to discuss these interesting pine scripts.
The scripts posted are categorized into 5 levels according to my efforts or manhours put into these works.
Level 1 : interesting script snippets or distinctive improvement from classic indicators or strategy. Level 1 scripts can usually appear in more complex indicators as a function module or element.
Level 2 : composite indicator/strategy. By selecting or combining several independent or dependent functions or sub indicators in proper way, the composite script exhibits a resonance phenomenon which can filter out noise or fake trading signal to enhance trading confidence level.
Level 3 : comprehensive indicator/strategy. They are simple trading systems based on my strategies. They are commonly containing several or all of entry signal, close signal, stop loss, take profit, re-entry, risk management, and position sizing techniques. Even some interesting fundamental and mass psychological aspects are incorporated.
Level 4 : script snippets or functions that do not disclose source code. Interesting element that can reveal market laws and work as raw material for indicators and strategies. If you find Level 1~2 scripts are helpful, Level 4 is a private version that took me far more efforts to develop.
Level 5 : indicator/strategy that do not disclose source code. private version of Level 3 script with my accumulated script processing skills or a large number of custom functions. I had a private function library built in past two years. Level 5 scripts use many of them to achieve private trading strategy.

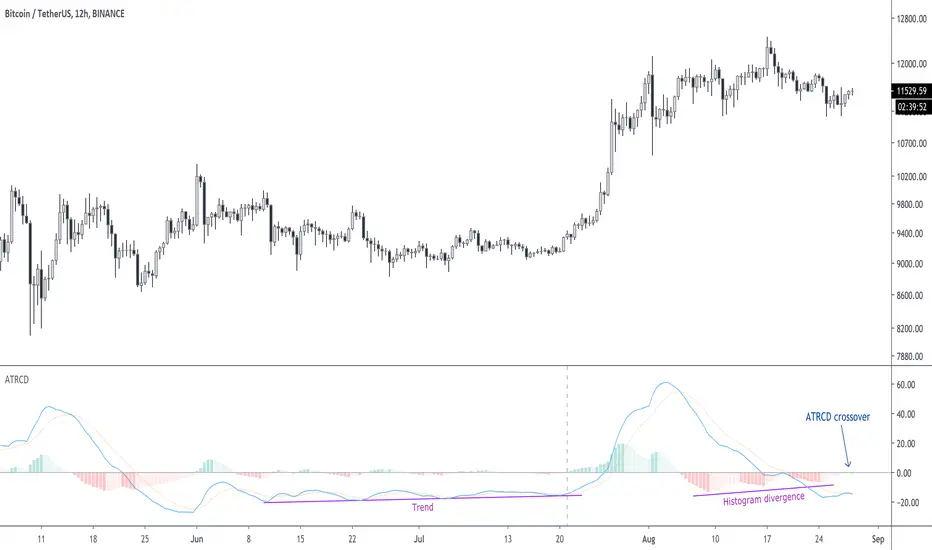
ATRCD, Average True Range Convergence DivergenceATRCD calculates a MACD over the Average True Range, therefore helping traders to spot momentum in volatility.
The Average True Range is a measurement of the average candle size over a period of time, i.e. when the candles are small, the ATR is low. ATR measures volatility .
The MACD is a momentum indicator. It measures market momentum based on the average closing prices over a period.
Therefore, using the MACD calculation over the ATR we get a measurement of momentum in volatility . The ATRCD is a concept at this point. I was curious to see whether such an indicator could provide any edge trading the markets. Because this is a MACD of the ATR the same concepts can be applied, e.g. spotting divergences, momentum trends, etc. Please be careful however, this indicator only looks like the MACD but it measures volatility and not price momentum . Maybe this can help traders confirm breakouts using price action?
Applying this indicator to the 12h of BTC/USDT we can see that we could be nearing a volatility expansion with a divergence on the histogram, and an ATRCD crossover.
BINANCE:BTCUSDT
Noro's RiskChannel StrategyIndicator
The Donchian price channel is used. There are 2 methods available to close the position. The user can choose a method.
Wikipedia: en.wikipedia.org
Strategy #1 (stop-loss type = channel)
Old classic trading strategy, using breakouts of the Donchan price channel.
If the price is above the price channel top line, open the long position (and close the short position)
If the price is below the lower line of the price channel, open the short position (and close the long position)
It is recommended that you all use market stop orders.
Strategy #2 (stop-loss type = center)
This metod is better. This method is recommended.
The central line (red) is the middle of the Donchian price channel. Used to close any positions.
If the price is higher than the price channel top line, open the long position.
If the price is lower than the lower line of the price channel, open the short position.
If the price has crossed the central line of the channel, close any position.
It is recommended that you all use market stop orders.
Risk
There are 2 options. Risk for long positions and risk for short positions. This is the size of the possible loss. Order size depends on the possible loss and is calculated for each position.
For
BTC/USD, BTC/USDT, XBT/USD, ETH/USD, ETH/USD (need USD!)
Timeframes: 1h and length of price channel = 50 bars or 4h and length of price channel = 12

Donchian Strat EXMOThis is simple test of Turtle Trading strategy by Richard Dennis. The script meant to place orders on Donchian Channel borders. It's best to test and use on mid-term charts like 1H and more.
I've chosen Kraken XBT/USDT chart because this market opened in december 2019. The main problem of crypto trading strategy testing is the bullish market of 2017 year. That enormous growth gives unrealisting expectations to all trend-following strategies tested.

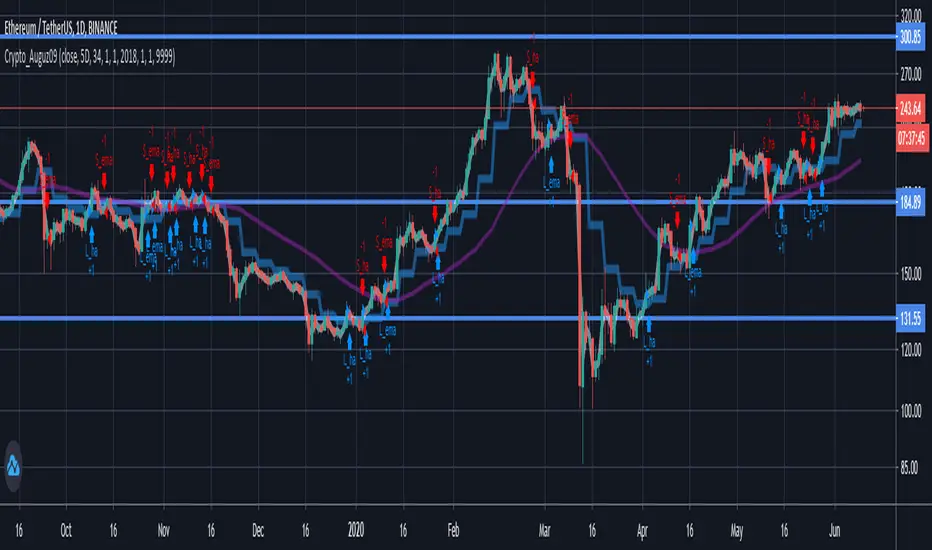
Tan_Aug09Crypto pairs: ETH/USDT
Time-frame: D1
Based on Heikin Ashi Candle and Exponential Moving Average Indicators
Crypto pick: 5D
Stock pick: 8D
Best work in strong trend.
Recommend using with trend line .
Bitcoin SpreadThis indicator display the current lowest and the highest value of btc on a set of exchanges for a define type of market.
Bitcoin Spread was originally made by @DayTradingItalia, i have bring his indicator to pine v4, add add some stuff to it:
5 Type of BTC Market : USDT Swap, USD and Futures (current/next contract)
Spread value

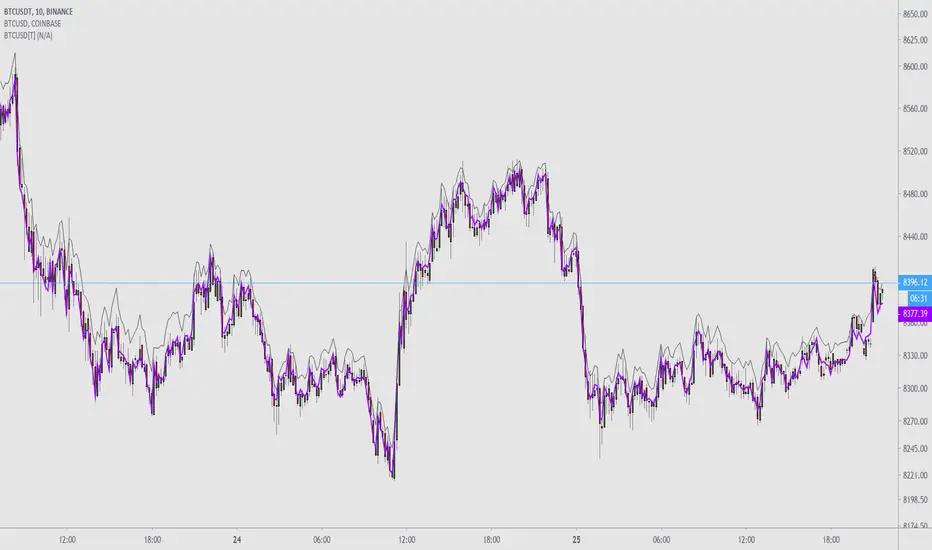
Binance BTCUSDT Tether AdjustedThis provides a Binance BTCUSDT ticker that is more aligned with spot exchange price.
There is an invisible line added to so it is possible to add indicators like MAs to it. It must be turned on in options to be used.
Possible usecases:
Add it to a Binance chart as a price source but keep real volume
To feel like you have an edge
For an more accurate and liquid representation of spot price
SuPeR-RePaNoCHa #2TP#This is the last of the 'RePaNoCHa' script for Automatic Trading ;-) ... This time with two take profits ...
It Use 6 indicators + volume:
-JURIK MOVING AVERAGE
-RANGE FILTER
-ADX
-PARABOLIC SAR
-RSI + VOLUME WEIGHTED
-MACD
-VOLUME
To close the position you can choose between 2 Take Profit and the amount to use on each one.
You can transform it yourself into 'study' mode to get alerts.
Take Profits can be generated from the same entry, (syntax example on the script) so the fees will be lower (0.04 + 0.02 / 2 = 0.03).
Settings for BINANCE FUTURES BTC:USDT
Enjoy...

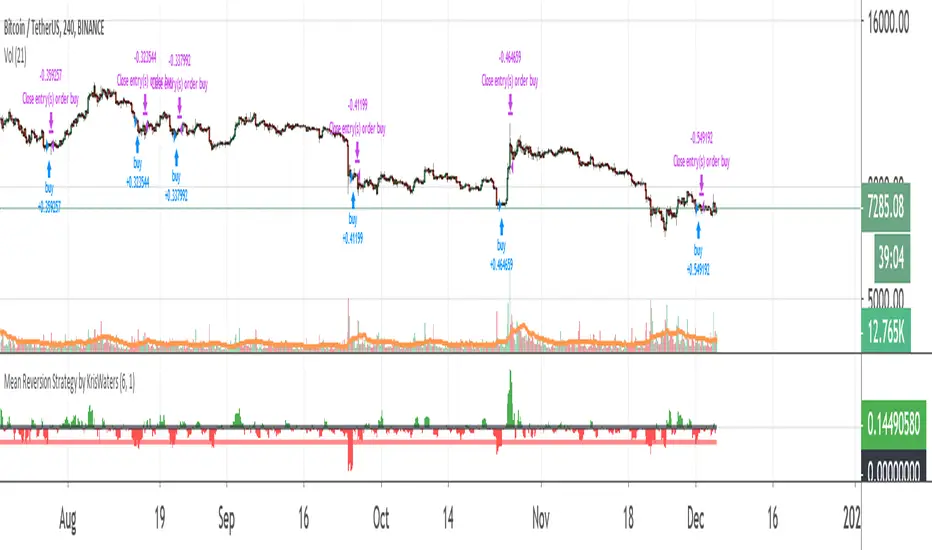
Mean Reversion Strategy by KrisWatersThis is a type of mean reversion strategy. It only generates long signals when the price is far away from the mean. It tries buy from the dip. Use it with BTC/USDT pair on 4 hour timeframe.
Volumen Consolidado por DIVISAS contra BITCOIN #09/2019Volumen Consolidado de Bitcoin clasificado por divisas. Gracias a este indicador se podrá obtener la dominancia y participación en el mercado de las diferentes divisas o contratos. Actualmente el indicador incluye un aproximado de 40 pares de BTC contra diferentes divisas, en las cuales resaltan:
*USD
*USDT
*USDC
*XBT
*CNY
*KRW
*GBP
*EUR
Este indicador es un criterio utilizado para un indicador que estaré subiendo en proximamente, el cuál sí contará con el volumen total expresado en un solo panel. Es decir, este indicador, solo especifica una parte del indicador general, que será el volumen consolidado total, que este expresará la cantidad total de bitcoins negociados a nivel mundial. El USD es la moneda con la que el "Market Maker", respalda sus fondos para operar el mercado, cosa que sabemos, por lo tanto otras divisas serían solo un metodo de compra para el retailer(cosa que me motivó a la creación del indicador ya que se podría conocer el sentimiento y reacción de los mismos en lo que ocurre en el mercado).
Recordemos que el principal problema de los análisis que toman en cuenta el precio y volumen en bitcoin es que tradingview te da a conocer solo el "volumen del exchange", por lo tanto no obtienes una cifra exacta de los bitcoins comprados y/o vendidos en todos los sitios en los que se negocia, lo que dificulta tener una percepción objetiva de lo que sucede en el mercado, ya que te guiarías por el volumen que te da el exchange dónde operas y no el que es real.
Sin nada más que decir, espero que tome en cuenta este recurso para sus análisis, que será esencial para aquellos que operan con precio y volumen.
Si quiere realizar alguna colaboración y/o donación por mí obra, será muy bien bienvenida y agradecida:
BTC: 1TqvNSQs39pr2mLeDo3swcrkYvkK1YQAN
LTC: LKYYkJQHBvnEaJSatp53pg8C7iKp9Jp45B
ETH: 0x6e0902a16a0a0d6379cd8600c455a7ab335278cc

Noro's Crypto PatternsFor
- symbols: crypto/usd or crypto/usdt (or any stablecoins)
- timeframe: 1 hour
Signals - quantity of signals (arrows)
Accuracy - as many such transactions were profitable

BTC Spot vs Tether Volumespot_volume / tether_volume
spot = Coinbase + bitFlyer + Kraken + Bitstamp
tether = Bitfinex + binance + Huobi + HitBTC

Minimal Godmode 1.0// Acknowledgements:
// Original Godmode Authors:
// @Legion, @LazyBear, @Ni6HTH4wK, @xSilas
// Drop a line if you use or modify this code.
// Godmode 3.1.4: @SNOW_CITY
// Godmode 3.2: @sco77m4r7in and @oh92
// Godmode3.2+LSMA: @scilentor
// Godmode 4.0.0-4.0.1: @chrysopoetics
// Jurik Moving Average: @everget
// Minimal Godmode v1.0:
// Removed BITSTAMP:BTCUSD, added presets for 9-26-13 and 17-6-4, added more exchanges + USDT and USDC pairs to multi-exchange option
// JMA smoothing - more responsive + less lag than SMA at equivalent length settings
// Minor cosmetic changes to account for pinescript 3 transparency and z-order

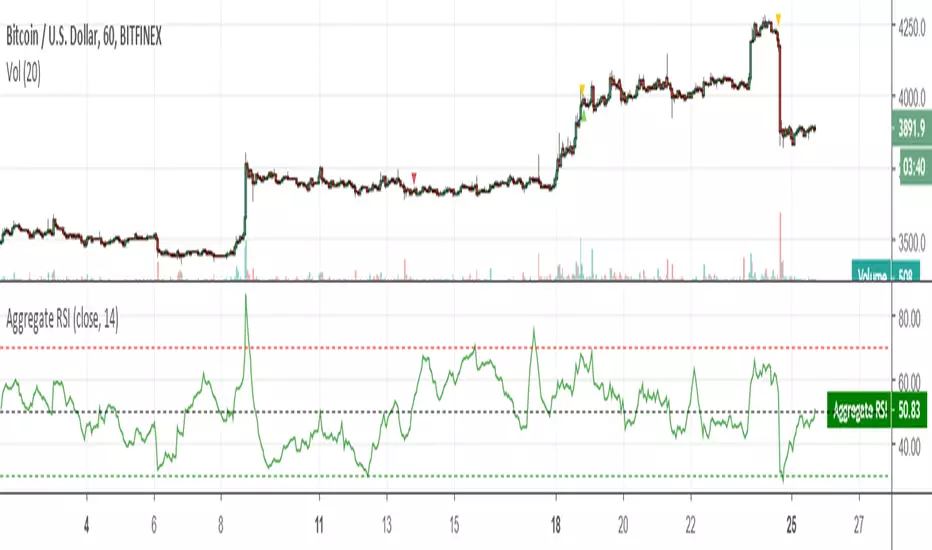
Aggregate RSIAggregate RSI of the top 40 coins listed on CoinMarketCap.com on 25th of February, 2019, on USD or USDT pairs.
Because of requesting info about the prices of 40 coins using security(), this script is SLOW.
ETH HawkEye Aggregated Volume IndicatorThis is combined Aggregated ETH Exchange Volume by Neobutane with HawkEye volume clone indicator by LazyBear.
Indicator includes aggregated raw ETH volume from 7 user selectable fiat and tether exchanges on USD, USDT, BTC, EUR, GBP, JPY pairs + Exponential MA + hawkeye bar coloring where: green is bullish volume , red - bearish and white - volume neutral to the market:
Bitfinex
Coinbase
Bitstamp
Kraken
Binance
Poloniex
Bittrex
*There is a TV bug that doesn't display a whole volume history if some pair was added later than date intended to be analysed by operator eg, if you want to watch older data you should exclude all secondary pairs that were added later and switch off "newer" exchanges like Binance.

APEX - Tester - Aurora Borealis USDTA script to test Aurori's strategy Aurora Borealis with the Apex Trading bot. This script was built upon the tester basic script provided by puppytherapy and repurposed to only have my strategy in it.
For more awesome Apex scripts by puppy please follow this link: www.tradingview.com
