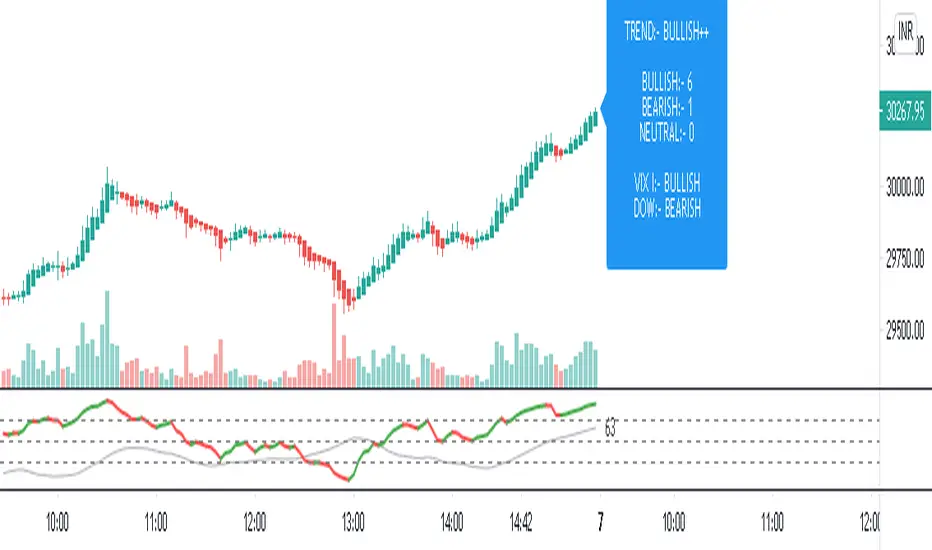
Multiple Indicator Connecting DotsHello All,
This script compares
1. Smoothed RSI
2. INDIA VIX
3. DOW
4. Price
5. Day Trend
6. Volume
And provides overall relative status of indicators.
Also play with different higher time-frames to get correct view on lower time-frames accordingly
P.S :- Please trade according to our setup, it just aids your view and only for educational purposes.
Cerca negli script per "vix"
Tug-of-War Fast/Slow Technical IndicatorThe script Tug-of-War (ToW) Fast/Slow has a couple of lines (red and purple) and areas (purple and greenish) which give the trend. It also has one line (blue) and dots (green) that give the up-and-down swing.
HOW THE INDICATOR WORKS
It is based on moving averages run on normal OHLC bars, Heikin Ashi bars as well as customized bars (which modify the open/high/low/close values similar to how Haikin Ashi bars do). These moving averages are weighted by volume and related to each other (for example differences are calculated) to produce the final lines. Since the script requires volume, it may not work for tickers which don't have volume (however for some tickers the script uses a proxy-volume so that they work; for example it uses the SPY volume for VIX). There is a different but similar script that I'll be publishing (ToW Simple) which doesn't use volume and runs on any ticker.
HOW TO SETUP THE INDICATOR
The indicator can be run on "close" prices as well as "open", "high", "low" and several mini-max modes ("MM ..."). They pick highs and lows (minim and maxim values, hence the mini-max name) to generate the indicator lines. See the drop down box options under "Adjust Close Type" (the very fist options in the script settings). The multiple MM modes use different formulas to calculate the mini-max values. The more significant MM modes are MM ZZ (zig-zag), MM HL/HL (determines highs and lows based on highs and lows), MM HL/C (determines highs and lows based on close) and MM Close. Note: if the MM ZZ mode show you the highs for the current bar and you actually want the lows (or vice versa) check "MM ZZ Reverse".
The indicator has two fast lines:
the green dots (called F1 since it's the 1st Fast line, actually dots)
the blue line (called F2--the 2nd Fast line)
They are called "fast" because they move up and down faster. In previous iterations of the script I called them "swing lines" since they capture the prices swing up and down. The blue line is the more significant one (since the green one I set, by default to dots instead of an actual line).
The indicator has two slow lines:
the purple line (called S1 since it's the 1st Slow line)
the blue line (called S2--the 2nd Slow line)
They move slower than the fast line and they are better at determining the trend.
The order of lines, from fast to slow, is: F1 (green), F2 (blue), S1 (purple) and S2 (red).
The indicator also has two areas:
the greenish area (called FA since it's the Fast Area)
the purple area (called SA since it's the Slow Area)
Additional lines (but less significant are displayed if you uncheck the "Clean look" option).
The script allows to display up to for sets of lines (see the top "Adjust Close Type (Set #)" options). For example one set may show "Highs" and the other "Lows" or "Close" and "MM HL/HL". Additionally it can run in multi-set mode when it shows the chosen one line (F1, F2, S1, S2, FA, SA) for each OHLC (open, high, low, close). See "Only Show Related Lines" option. In this display purple is the line for Open, green is the line for High, red is the line for Low and black is the line for Close.
The indicator also has a custom mode (see the "Enable custom bars" checkbox and the options following it). With it you can change the open/high/low/close value (see "Custom #1 OHLC to Modify") of a bar ("Custom #1 Index To Modify" determines which bare to modify, 0 being the most recent bar). Then "Custom #1 Modifier Type" specifies to use open/high/low/close value of the same or different bar (use "Custom #1 Modifier Index/Value ..." to choose which bar's OHLC value to use for the custom value; 0 means the O/H/L/C value of the same bar as the one being modified; 1 means previous bar, etc.). If "Custom" is selected instead (under Modifier Type) then you can enter the custom value in the "Custom #1 Modifier Index/Value ..." field. This will show you how the indicator lines look like if the price was different. Three different bars can be modified this way. You can try different custom values and see for what price value one of the lines reaches a high or low point. That is an estimate of how far the price may go. Note: the indicator values depends depends on all OHLC values (plus volume) not just on the one chosen. That is, if the indicators is based on close values it is still affected to some extent by high, low and volume. Therefore the price value determined using the custom mode may not be exact but only a rough estimate (and the bigger changes in OHLC the bigger affect on the indicator and the actual price may not be exactly what was calculated using the custom mode.
HOW TO USE THE INDICATOR
Strategies and tools that apply to price such as resistance and support levels and trend lines, pitchforks (particularly Schiff pitchforks in case of the indicator) also apply to these lines. Because the indicator lines are within a range it is generally easier and faster to see and find such support/resistance levels and trend lines.
Additionally, the lines or the areas crossing the 0 line often indicate a change in trend (however if earlier indicator highs/lows bounce off around the 0 line that may happen this time around as well). The more significant 0 crossing is for the slow lines (red first and then purple) as well as the areas.
The slow lines and the areas, as mentioned already, show the trend (in previous iterations of the indicator I called them direction lines).
The fast lines (blue line, green dots) show the swing, as mentioned earlier. They often swing up and down. When they reach a high (you can thin of it as overbought) they may move back down on the next bar (or vice-versa when reaching a low). However, sometimes they don't swing but rather move in a line closer to a straight line (more like the slow lines). That indicates that the trend is stronger.
The fast lines can also indicate the trend by looking if their highs and/or lows are trending up or down. Thus, if the highs and lows are trending down then it's likely the price will go down.
Another thing to look at is divergence between the price and the slow lines or the high/lows trend of the fast lines (that I mentioned above). If the price is going up but the these are trending down then over the same bars then the price may be coming closer to a reversal.
STRATEGIES
Swing-in-trend. Find a ticker with the slow lines showing an upward trend (i.e., the red line crossing 0 or being above 0) and a the slow line (such as the blue line) reaching a previous low level (draw support levels and/or trend lines to determine that). Go long when the fast line reaches the support level or bottom trendline. The expectation is that the price will move up by the close of the next bar (when the position should normally be closed). The "go-short" setup is just reversed (slow lines trending down and the fast lines reaching high levels). You can use the "High", "Low", "MM ZZ" or one of the other MM modes instead of "Close" to get a better entry and exist point (in this case you enter when the the "Low" or "MM ZZ" modes reached a low and you enter if the "High" or "MM ZZ" reached a high or else exit at close of the next bar).
Trend-on-swing. When the red line is about to cross or just crossed the 0 line and wait for the swing line to go down first (you can use "High", "Low" or an MM mode, as explained dabove, for a better entry point) and then you enter the position and exit when either the slow (red) line reaches a resistance level, it crosses 0 the other way or when the fast line reaches a very high resistance level. This strategy will take longer, it won't be closed on the next bar.
Mini-max strategy. This is a new strategy I've developed. It uses MM ZZ mode (and a second MM ZZ set to "reverse") as well as "High", "Low" and "MM HL/HL" mode. I basically draw resistance and support lines on these, usually 2-3 lines for high and the same for low, for multiple tickers that seem a good match (they show a nice, consistent up/down pattern for MM ZZ). When the F2/blue lines reaches one of the horizontal lines further from the 0 lines (I setup alerts for this), then I enter expecting a move in the opposite direction. If it reaches the 2nd or 3rd low horizontal line then I go long. Then on the next bar when the F2 line reaches the 1st high horizontal line then I close the position (alternatively, I close half and keep half for when the second high horizontal line is reached). Alternatively, I may close the same bar, when the reversed MM ZZ setup reaches the 1st high horizontal line. I usually use this setup on weekly charts and use weekly options but it can be used on other charts such as daily charts as well.
I recommend to setup alerts on the indicator. After you draw a horizontal line or a trend line and you select it, its bar has a clock icon with a "+" sign. If you click on it you can setup an alert. In the setup dialog, under "Condition" select the indicator and then select the line of the indicator (such as "F2 (f_s/Blue)") then select "Once Per Bar" under "Options" (that's my recommendation, it will alert you only one time per bar). Finally customize the message for example: "ZZ: F2/blue /lo hl 1/3, TQQQ, 1D" (which means it's for MM ZZ mode when F2 (blue) line intersects the 1st (out of 3) low horizontal line (HL) and it's for TQQQ on 1D chart. When I use the reverse mode for ZZ then I write: "ZZr: ..."
In the chart above, the first indicator shows the "Close" mode and the second the "MM ZZ" mode (along with 2 levels for high and low).

Moving Average Ribbon Master StrategyThe following features available in this strategy are listed below. To access, please visit the website in the signature area of this posting.
INTRODUCTION
Robust, fast, trading system
Multiple time frame (MTF) aspects built in everywhere into the strategy
Combines swing, scalp, greedy, volatile trading mechanisms
Works on intraday day time frames as well as Daily and Weekly
Trade sizing, targets, and stops are shown as new trades form and existing trades develop
Alerts warn the trader on all aspects of the trade evolution
Alerts are ready to be used for complete lifecycle automated trading
EMA TRADING
Combining EMAs on a higher time frame than the chart time frame is key
Trade conditions are met on a lower time frame that agree with the EMA ribbon direction
WHY DOES IT WORK?
With the right EMA settings, it is "hard" to generate trades.
The trade direction can easily shift
Successful trade entry triggers require a strong trend
While the EMA trend is positive, longs are taken on pullbacks, opposite for shorts
A basic learning algorithm is used to create a stop behind the trades
Learns over time the best stop offset from the price based on volatility
SWINGS AND SCALPS
Swings and scalps are treated differently.
Swings are the very first trade taken upon a directional shift. This is similar to the DIVINE series trading strategies
Swings are held until stopped out, Scalps always have a target based on the current volatility of the ticker and multiplier
Both swings and scalps start out in the "building" or "forming" phase.
A building phase is triggered when all criteria are met to form a long or short
Both trade types are executed as a market long or short when the ATR execution sensitivity reverses
The current ATR direction can be seen by the colored bars.
TRADING STYLES
Conservative
Aggressive
Greedy
Volatile
TRADE SIZING
Contract/Unit
VIX Multiplier
Percent of Equity
Percent Risk
TRADE INFORMATION
Historical trades show the price target of a scalp and the number of ticks of profit in parenthesis
New trades show all of the extra information surrounding the trade. This can be turned on to show the same information for past trades, but is left off to reduce clutter
Go over trade information categories one-by-one
Recent historical trades have a tooltip loaded to hover over and see the hidden information
Scalp trade is filled the numbered scalp icon shows as a (N)
SESSION WINDOW
Longs and shorts can only receive an execution signal when the ticker is within one of three session options provided
ADJUSTMENT
Last 3 sizing types show the quantity required to enter the trade to meet the parameters
Percent risk automatically adjusts the quantity to meet the risk criteria given the account equity, per trade
The account currency can be changed with will update the quantities automatically
Tick Unit and Value can also be changed if they are not accurate
ALERTS
Alerts for entire trade lifecycle
Full automated trading ready

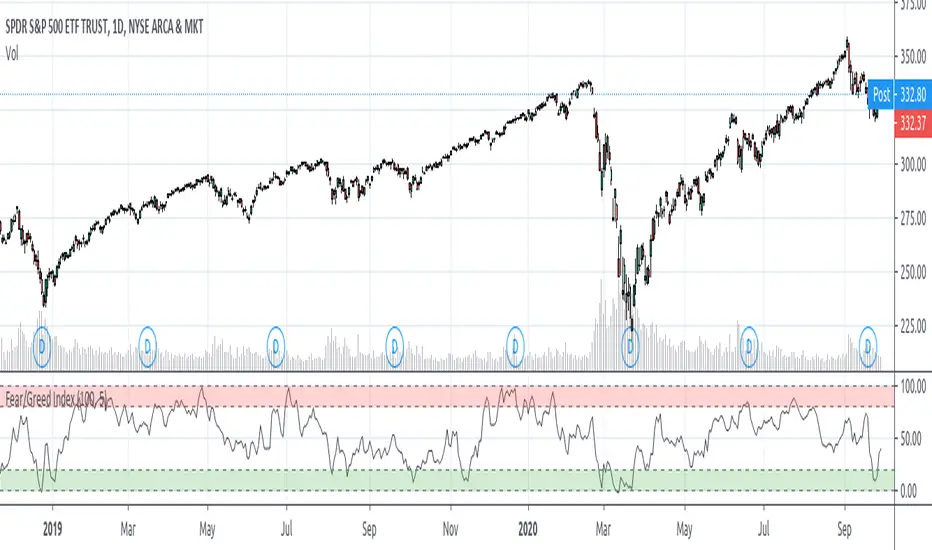
Fear/Greed IndexMy goal was to create something akin to the Fear & Greed Index ( money.cnn.com ) that CNN and others do.
A Fear/Greed Index can be used by any trader or investor but I believe it's best viewed with a contrarian's eye--
When the market appears to be signalling Extreme Fear, that is a good place to start buying from emotional players who want to sell no matter the price
When signalling Extreme Greed, that may be a good place to start taking profits off or getting hedged, as there may be too much exuberance in the air
Important to note and remember, however, is that there can often times be fear in the air for good reasons! I like to see this as if we dip into extreme fear and return shortly after, the fear may warrant constraint from buying, or returning back to extreme greed may be a very strong market extension
The script draws from several other tickers which I have read and personally observed to be decent macro correlations for the stock market (specifically the SP500). For the state of each of these metrics I gave a rating, good or bad, then added them together and put it into your standard Stochastic.
These macro correlations include--
The % of stocks in the SP500 above multiple Simple Moving Average lengths
VIX and its term-structure (contango, backwardation)
Treasury Bonds
Gold
Junk/High Yield Bonds
The Put/Call Ratio
The SP500 Options Skew
Advancing and Declining Issues
On some of these I opted to use a function for the Relative Momentum Index instead of RSI, as the RMI oscillates better (in my opinion). I also used a Band-Pass Filter/Double EMA for smoothing the results of the stochastic.
A LOT of these numbers were made to my own observation and discretion and can get out-dated over time. With that said, PLEASE feel free to revise, fine tune, modify this as you wish to optimize yours. And please let me know if I have made any mistakes here or something should be added.
CC - Array-meta Consolidated Interval Display (ACID)This script extends my other two Array examples (which I've also provided to you open source):
The Ticker-centric 5m,15m,45m,1h,4h,1d resolution labels using arrays:
And the more Macro VIX,GLD,TLT,QQQ,SPY,IWM 1d resolution labels using arrays:
This script aims to show how to use min/max/avg with Arrays easily. My next example after this will be exploring the usage of variance versus covariance ratios over different periodic interval resolutions. Currently, this is using the following intervals: 5m,15m,45m,1h,4h,1d. It takes these intervals, calculates the values at those resolutions and puts the absolute min and max from the 5 minute to the 1 day resolutions.
It's more of an example of the power that arrays can hold, as all this truly is right now is a min/max bound calculator. The real gem lies in the avg calculators for multiple resoltuions tied into a single label with readable data. Check out the code and let me know what you think. If you need more examples, the other two scripts I mentioned before are also open source.
Using this on intervals of less than 1D sometimes times out, the way I wrote it is memory intensive, may not work for non-pro users.
Thanks!
NONE OF THIS IS FOREWARD LOOKING STATEMENTS, THIS IS NOT A PREDECTIVE ANALYSIS TOOL. THIS IS A RESEARCH ATTEMPT AT A NOVEL INDICATOR. I am not responsible for outcomes using it.
Please use and give criticisms freely. I am experimenting with combining resolutions and comparing covariance values at different levels right now, so let me know your thoughts! The last indicator will likely not be open source, but may be depending on how complex I get.

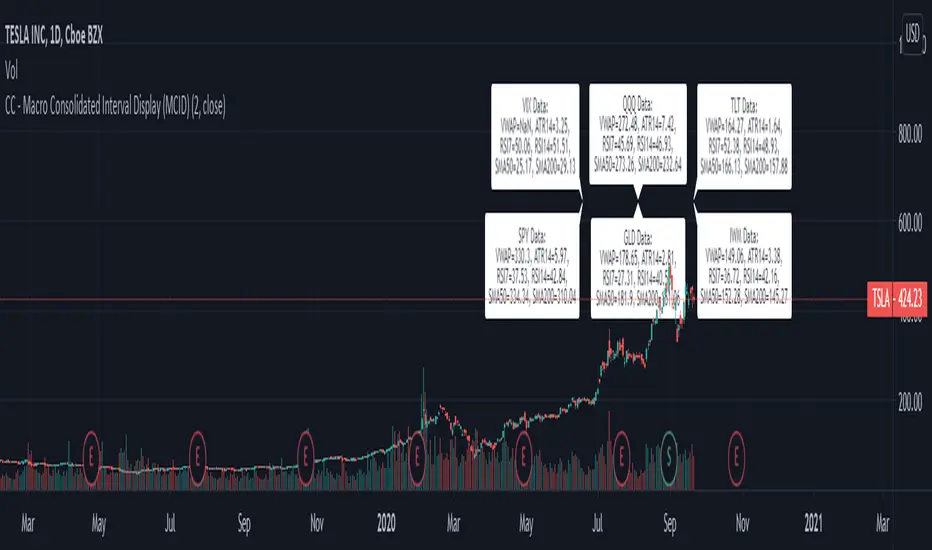
CC - Macro Consolidated Interval Display (MCID)Ever wish you didn't have to rapidly flip between 6 different tickers to get the full picture?
Yeah, me too. Do you also wish that you kind of understood how the shift / unshift function works for arrays?
Yeah, I did too. Both of those birds are taken care of with one stone!
The Macro Consolidated Interval Display uses the new Array structure and security to display data for VIX, GLD, TLT, QQQ, SPY and IWM (at a 1D interval) SIMUTANEOUSLY! Regardless of which ticker you're looking at you can get the full picture of macro futures data without flipping around to get it.
This is my first script trying to use arrays. It basically shows the following a 1d interval:
ATR14, RSI7, RSI14, SMA50, SMA200 and VWAP for VIX.
ATR14, RSI7, RSI14, SMA50, SMA200 and VWAP for GLD.
ATR14, RSI7, RSI14, SMA50, SMA200 and VWAP for TLT.
ATR14, RSI7, RSI14, SMA50, SMA200 and VWAP for QQQ.
ATR14, RSI7, RSI14, SMA50, SMA200 and VWAP for SPY.
ATR14, RSI7, RSI14, SMA50, SMA200 and VWAP for IWM
To make it more or less busy, I've allowed you to toggle off any of the levels you wish. I've also chosen to leave this as open source, as it's nothing too experimental, and I hope that it can gain some traction as an Array example that the public can use! If you don't like the different values that are shown, use this source code example as a spring-board to put values that you do care about onto the labels.
If this code has helped you at all please drop me a like or some constructive criticism if you do not think it's worth a like.
Good luck and happy trading friends. This should be compatible with my CID as well:
If this gets traction, I will post something similar for a dynamic combination of tickers and intervals that you can set yourself.
CC - Consolidated Interval Display (CID)Ever wish you didn't have to rapidly flip between 6 different intervals to get the full picture?
Yeah, me too. Do you also wish that you kind of understood how the shift / unshift function works for arrays?
Yeah, I did too. Both of those birds are taken care of with one stone!
The Consolidated Interval Display uses the new Array structure and security to display data for 5m, 15m, 45m, 1h, 4h and 1d intervals SIMUTANEOUSLY! Regardless of which interval you're looking at you can get the full picture of numerical data without flipping around to get it.
This is my first script trying to use arrays. It basically shows the following for the given ticker:
ATR14, RSI7, RSI14, SMA50, SMA200 and VWAP at the 5 minute level.
ATR14, RSI7, RSI14, SMA50, SMA200 and VWAP at the 15 minute level.
ATR14, RSI7, RSI14, SMA50, SMA200 and VWAP at the 45 minute level.
ATR14, RSI7, RSI14, SMA50, SMA200 and VWAP at the 1 hour level.
ATR14, RSI7, RSI14, SMA50, SMA200 and VWAP at the 4 hour level.
ATR14, RSI7, RSI14, SMA50, SMA200 and VWAP at the 1 day level.
To make it more or less busy, I've allowed you to toggle off any of the levels you wish. I've also chosen to leave this as open source, as it's nothing too experimental, and I hope that it can gain some traction as an Array example that the public can use! If you don't like the different values that are shown, use this source code example as a spring-board to put values that you do care about onto the labels.
If this code has helped you at all please drop me a like or some constructive criticism if you do not think it's worth a like.
Good luck and happy trading friends.
If this gets traction, I will post something similar for a combination of SPY, VIX, GOLD, QQQ, IWM and TLT.

Risk RangeThis indicator creates risk ranges using implied volatility (VIX) or historical volatility, skewness ( Cboe SKEW or estimate ) and kurtosis.
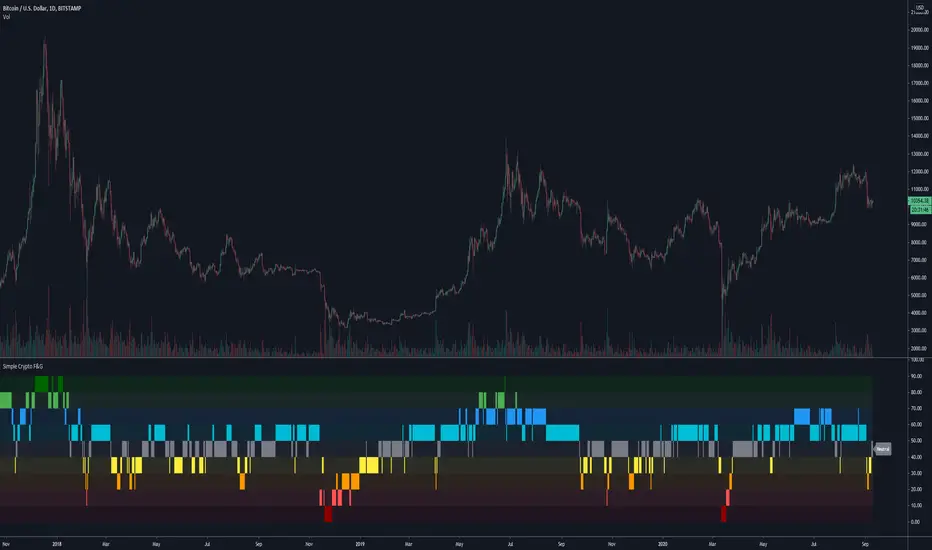
Simplified Crypto Fear & Greed DisplayA more simplified view of a Fear & Greed index.
This script has been made public because it uses Trading Psychology - Fear & Greed Index by DGT as the basis/inspiration for it.
I've re-imagined the visuals in order to display F&G data differently to the more traditional versions of the indicator floating around, as well as adapting it's calculations and reference assets for use with Crypto markets.
It's aim is to show the current status / mindset of market participants at a quick glance.
When there is a lot of fear in the market it is usually a good time to look for buying opportunities.
On the flip side you can use it to spot selling opportunities when there is too much greed / FOMO in the markets.
This indicator has the option for Traditional and Crypto markets.
The Traditional option uses the tickers VIX and GOLD as part of it's calculations, where as Crypto uses BVOL24H and BTC.D in order to base it's decisions off of more relevant data.
There are also 10 levels of smoothing so play around with that to get the desired result. Depending on the asset you are looking at, smoothing of 1 or 2 may work much better than 5+
Have a play around, customize it, use it and let me know what you think.
Supertrend, MA & Market Strength by Keiron RichieThis script comprises of three separate indicators to give an improved view; a redesign of the Supertrend indicator to identify up/down trend and changes the background colour to red or green accordingly. This is then overlayed with the Mother of Adaptive Moving averages by John Ehlers (MAMA) which adapts to price movement in an entirely new and unique way. The advantage of this method of adaptation is that it features a fast attack average and a slow decay average so that composite average rapidly ratchets behind price changes and holds the average value until the next ratchet occurs. Since the average fallback is slow I can build trading systems that are virtually free of whipsaw trades.
Additionally, there are up & down arrows below and above the bars respectively which demonstrate overall market strength or weakness. By combining the relative strength in a trend with the true strength of the Nasdaq (NDX) and S&P500 (SPY) we can then compare that against the volatility/fear index (VIX) to show if the market is excerpting pressure on the component in either direction. i.e. if the red arrow shows then the market indexes true strength is decreasing & if the small green arrow shows then the market index is gaining strength which may be likely to impact the component/symbol you are viewing. It’s a very quick and effective method of seeing the strength within the market indexes and how they are effecting your chart.
Because of the nature of the script it is tested and works well on all timeframes with Stocks listed on NASDAQ & S&P500.
Alerts are available for a change of background colour state. i.e Green=Buy, Red=Sell

Carl's BOTTOM DETECTOR: Williams %R + normalized ATRThis script is based on Williams %r and normalized ATR.
When William%R indicates extreme oversold conditions
and the ATR indicates extreme volatility at the same time,
then it prints an arrow below the candle.
It is based on the concept that swing lows and market bottoms
are characterized by extreme oversold momentum and
extreme volatility.
The highest tf's like the daily, show you perfect market bottoms for btc.
If you zoom in it's still good to find swing highs and lows, if necessary
you can tweak the settings.
Next to that I added grey, red, and green vertical bands to the chart.
This is based on the VIX, the SPX volatility index.
Whenever the volatility of the S&P500 crosses above a specific level
it prints a colored background band behind the candle.
Grey means high volatility, red extreme volatility (like in the covid
crisis and 2008 crisis), and green means the same as grey, but indicates
it came after a red zone and could mean strong bullish bounce momentum.
You can tweak the thresholds for the grey/green and read areas.

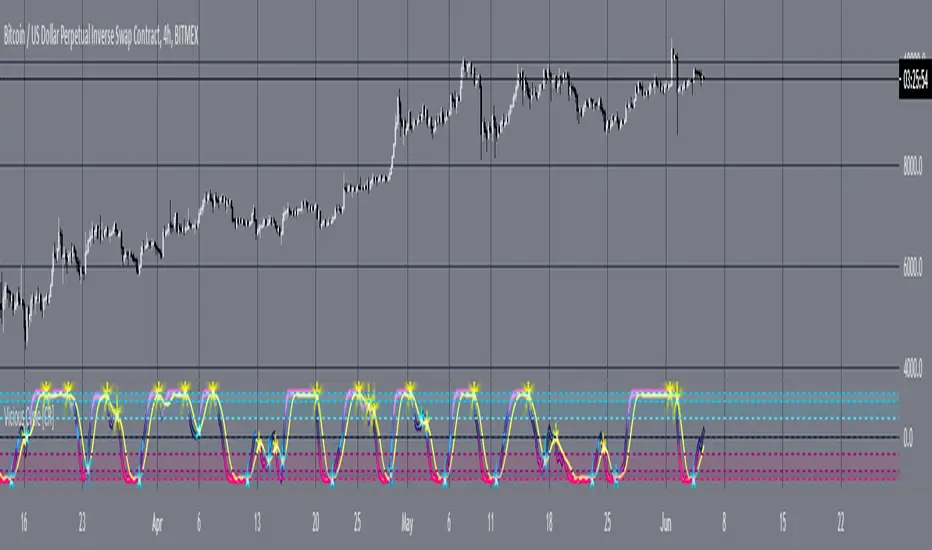
Vicious Cycle by Cryptorhythms [CR]Vicious Cycle by Cryptorhythms
Intro
I have been working on this one for a few months now, bringing our flagship indicator Bull Bear Filter up to date with new ideas and algorithms to clarify cyclical trend components in any time series data.
Description
This indicator has no settings that the user needs to change. It is completely adaptive and dynamic to any market, timeframe, or time series data. The goal was to create a tool that isolated cyclical waveforms, making it easier to follow a noisy market. Keep in mind, its not RSI, Stoch, Ehlers or anything else - its a completely new DSP method that I created myself. You can only get the Vicious Cycle from CR!
Private
This indicator is reserved for our members only to prevent the alpha decay as long as possible. You can view my signature at the bottom of this post for more information on membership.
Examples
Here I will list a number of examples screenshots across markets and timeframes. Remember, NO SETTINGS WERE CHANGED at all for these screenshots. As you can see its quite a versatile tool!
BITCOIN
XBTUSD 20Min
XBTUSD 4H
XBTUSD 6H
GOLD
XAUUSD 2D
XAUUSD 4H
FOREX
EURUSD 3 Min
EURUSD 30 Min
GBPJPY 1H
USDJPY 12H
STOCKS
TSLA 1D
AMD 1D
SPY 1D
VIX 12H
OIL
USDWTI 3D
USDWTI 2H
USOIL 15 Min
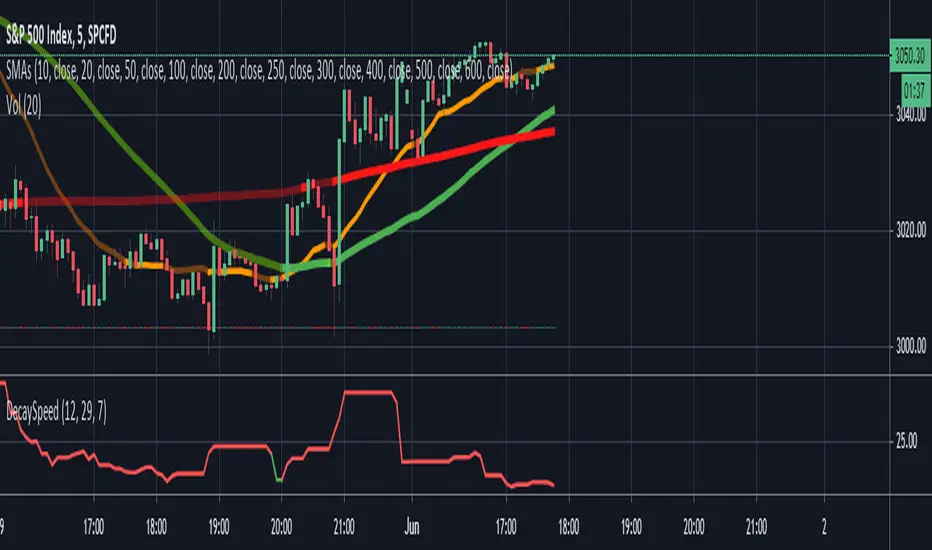
Options Decay Speed for 0DTEUse only for:
SPX, 5 minutes time frame
This indicator is complementing options 0DTE strategy - selling options for SPX index in the same day as they are expiring. Output of the indicator (red or green color of the curve) indicates whether is profitable to sell options at given moment at delta and VIX specified in the parameters. Changing parameter "Candles" is not recommended.
Main thought is that options expire with certain speed (theta decay) when stock doesnt move. When stock moves in unfavorable direction slowly enough, decay speed can compensate for disadvantage coming from option delta. Intuitively there must be certain speed of stock value change (expressed in stock value per 5 minutes) that is exactly compensating theta decay. This indicator calculates those two values (details below) and shows, where theta decay is faster than stock movement in the last hour and thus favorable to sell options.
Indicator gets its result from comparing two values:
1) volatility in the form of highest high and lowest low for past 12 candles (one hour in total) divided by 12 - meaning average movement of stock expressed in
2) speed of options value decay in form of combination of theta decay and option delta. Formulas are approximation of Black-Scholes model as Pine script doesnt allow for advanced functions. Approximations are accurate to 2 decimal points from market open to one hour before market close and will not indicate green when accuracy is not sufficient. Its value is also expressed in so its mutualy comparable.
My focus was not on code elegance but on practical usability.
Written by Ondřej Škop.
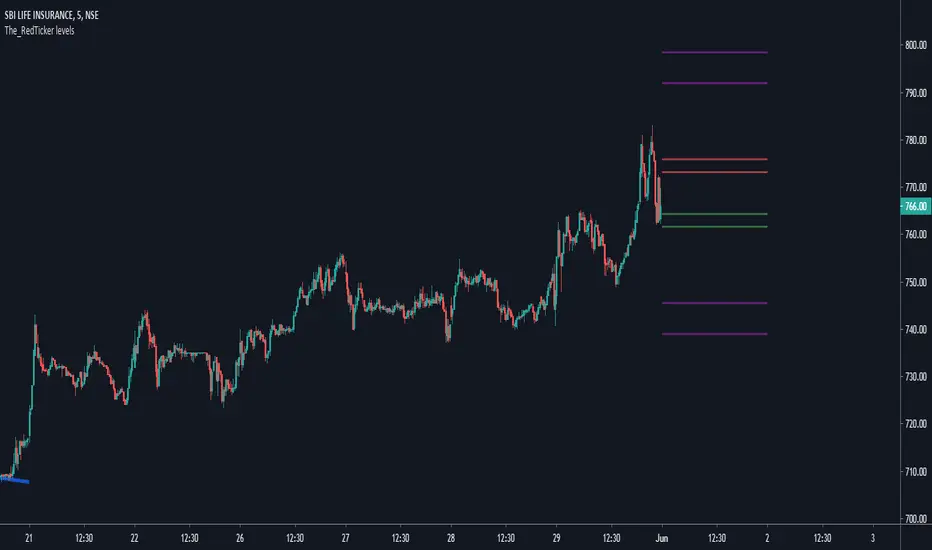
The_Redticker's Intraday IndicatorThis is a simplistic indicator capable of predicting Intraday Reversal regions for almost any chart on NSE/BSE (Indian Stock Exchanges)
Notes for Usage:
Best works when used on both indexes NIFTY and NIFTYBANK simultaneously in correlation. Its easy to understand that correlation, any one using it should spot it in a few days
Also, should only be used on 3 or 5 mins timeframe.
ENTRY:
The Inner regions marked by Red and Green lines are to be used for entries. Can look for both long and short reversal on either zones, can be teamed with other oscillators for better understanding.
Basically, when the CMP enters either Red or Green Zone, look for a long or short entry at the close outside the zone on 3 or 5 mins timeframe with the other side of the zone as stoploss trigger price.
While the Purple line on either side indicates the target zones.
P.s. If entering Short reversal at the Red Zone, then Green zone can also serve as first target and Purple zone as the final target depending on Market momentum. Vice-versa for entry at Long reversal at Green zone too.
Note: This indicator is most of the time absolutely correct, but needs to corrected every few months for VIX change. If and when that is done next will update it to show a NOTE on chart regarding that.
Look at any Index ideas on my profile to see live examples.
Ekambit Strength Index (ESI)Ekambit Strength Index ( ESI ) is an improved relative strength oscillator, which makes it easy to identify trends and reversals using weighted multi-timeframe comparisons in a single chart.
We at Ekambit Technologies use it daily with consistent success in Indian markets, especially with NSE:NIFTY and NSE:BANKNIFTY .
ESI indicator rules:
1) Above mid-zone & rising: uptrend
2) Falling from high-zone: uptrend reversal
3) Below mid-zone & falling: downtrend
4) Rising from low-zone: downtrend reversal
Apply the same indicator to VIX (in the same chart!) or up to 3 correlated instruments to gain greater conviction for your trades, as shown in the chart.
In addition to the chart timeframe, optionally 3 higher weighted timeframes can be used in ESI computation.
In effect, ESI is a single indicator which provides an insight of 16 indicators (4 timeframes * 4 instruments).
In the example shown,
Purple = NSE:NIFTY
Green = NSE:BANKNIFTY
Red = NSE:INDIAVIX
The same color coding is used for ESI indicator as well, and reasoning for each trade is shown in the chart based on ESI indicator values.
Use the link below to obtain 7-days free access to this indicator.

CM_Williams_Vix_Fix_V3_Ultimate_Filtered_Alerts_With_ThresholdModified from the original Vix Fix V3 to include thresholds of the bar values.


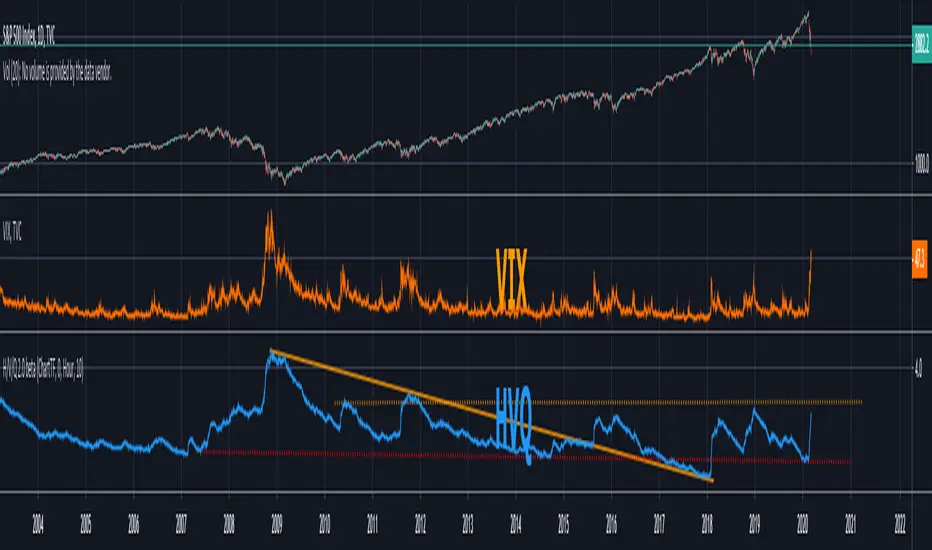
H/V/Q Volatility Index v2.0This is a standalone version of the volatility calculation used in QuantRsi. It is a relatively complex volatility-specific filtering calculation designed to give deeper insight into volatility trends for any asset class.
Use with Log scaling on the indicator's value scalar.
This tool offers an alternative model for volatility calculation. Experience using this tool proves that it extends the efficacy of volatility prediction techniques, and allows deeper technical analysis within volatility moves.
Use alongside conventional volatility indices to find opportunities within option chains to long or short volatility when HVQ provides evidence for volatility reversal that other options value models have not priced in.
Use as part of a predictive based risk management strategy.
Use alongside QuantRsi and HeffaeClouds as a complete trading suite, sans volume analysis, and gain insight not offered by any other indicator set.
SETTINGS:
TimeFrame settings:
Chart/Custom timeframe inputs are carried over from HeffaeClouds and QuantRsi indicators. Allows you to assign any non-chart timeframe to the indicator:
"ChartTF" follows your chart's selected resolution / TimeFrame
"Non-Chart TimeFrame" is an integer for your custom TimeFrame, the setting below:
"Non-Chart TimeFrame" selects "Minutes, Hours, Days" that corresponds to the above setting for a custom TimeFrame.
More Settings:
"Invert Output switch" will invert the volatility chart scale. Useful for visualizing some trends on assets that regularly correlate large volatility spikes with disorderly selloffs.
"Show High/Low Volt range" switch (experimental) shows the high/low extremes of alternate volatility window calculations. There is insight to be gained from large differences v.s. all ranges trending near the same values.
"Relative value switch" (experimental) divides the HVQ values by the hl2 candle price, per candle. This is a unique way to filter the output, visualize the volatility value per asset value.
"Range Multiplier" adjusts the average window length HVQ uses for calculations. This has been finely tuned so that the value of "10" corresponds to the best average fitting of all assets and timeframes. In most situations TimeFrame should be used to alter the real window periods and this should be left at default. Instead you can change this to find better fitting if you'd like.
If there is a feature you would like, question answered, or a bug to report, visit the TradingView SNOW_CITY public chat-room; link in my signature
Use the pastebin link below for indicator access information and pricing
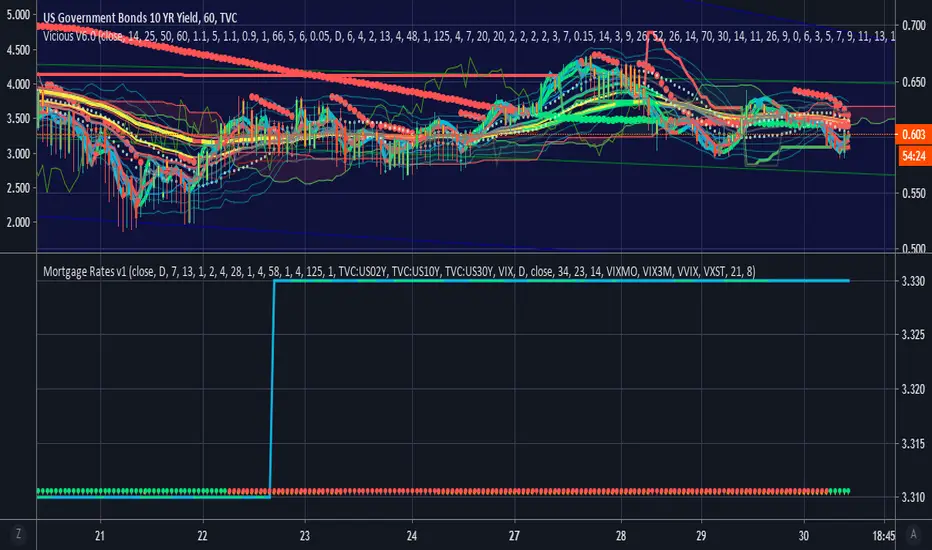
Vicious Mortgage Rates V1.0A script that contains real time mortgage rates from Wells Fargo using the QUANDL data link.
Use this lower indicator with US10Y or others on the top.
VIX will be added as well to help inform and predict.
List of Available Mortgage Interest Rates including APR or IR (Interest Rate)
*NOTE* : Not all indicators are up and running yet but will be very soon.
INDICATOR|CODE
Purchase Rate Conforming Loan 30-Year Fixed Rate Interest Rate|PR_CON_30YFIXED_IR
Purchase Rate Conforming Loan 30-Year Fixed Rate APR|PR_CON_30YFIXED_APR
Purchase Rate Government Loan 30-Year Fixed-Rate FHA Interest Rate|PR_GOV_30YFIXEDFHA_IR
Purchase Rate Government Loan 30-Year Fixed-Rate FHA APR|PR_GOV_30YFIXEDFHA_APR
Purchase Rate Conforming Loan 15-Year Fixed Rate Interest Rate|PR_CON_15YFIXED_IR
Purchase Rate Conforming Loan 15-Year Fixed Rate APR|PR_CON_15YFIXED_APR
*Purchase Rate Conforming Loan 7/1 ARM Interest Rate|PR_CON_71ARM_IR
*Purchase Rate Conforming Loan 7/1 ARM APR|PR_CON_71ARM_APR
*Purchase Rate Conforming Loan 5/1 ARM FHA Interest Rate|PR_CON_51ARM_IR
*Purchase Rate Conforming Loan 5/1 ARM FHA APR|PR_CON_51ARM_APR
Purchase Rate Government Loan 5/1 ARM FHA Interest Rate|PR_GOV_51ARMFHA_IR
Purchase Rate Government Loan 5/1 ARM FHA APR|PR_GOV_51ARMFHA_APR
Purchase Rate Larger Loan Amounts in Eligible Areas (Conforming Loan) 30-Year Fixed Rate Interest Rate|PR_LARGERCON_30YFIXED_IR
Purchase Rate Larger Loan Amounts in Eligible Areas (Conforming Loan) 30-Year Fixed Rate APR|PR_LARGERCON_30YFIXED_APR
Purchase Rate Larger Loan Amounts in Eligible Areas (Government Loan) 30-Year Fixed-Rate FHA Interest Rate|PR_LARGERGOV_30YFIXEDFHA_IR
Purchase Rate Larger Loan Amounts in Eligible Areas (Government Loan) 30-Year Fixed-Rate FHA APR|PR_LARGERGOV_30YFIXEDFHA_APR
Purchase Rate Larger Loan Amounts in Eligible Areas (Conforming Loan) 7/1 ARM Interest Rate|PR_LARGERCON_71ARM_IR
Purchase Rate Larger Loan Amounts in Eligible Areas (Conforming Loan) 7/1 ARM APR|PR_LARGERCON_71ARM_APR
Purchase Rate Jumbo Loan (Amounts that exceed conforming loan limits) 30-Year Fixed Rate Interest Rate|PR_JUMBO_30YFIXED_IR
Purchase Rate Jumbo Loan (Amounts that exceed conforming loan limits) 30-Year Fixed Rate APR|PR_JUMBO_30YFIXED_APR
Purchase Rate Jumbo Loan (Amounts that exceed conforming loan limits) 7/1 ARM Interest Rate|PR_JUMBO_71ARM_IR
Purchase Rate Jumbo Loan (Amounts that exceed conforming loan limits) 7/1 ARM APR|PR_JUMBO_71ARM_APR
Refinance Rate Conforming Loan 30-Year Fixed Rate Interest Rate|RR_CON_30YFIXED_IR
Refinance Rate Conforming Loan 30-Year Fixed Rate APR|RR_CON_30YFIXED_APR
Refinance Rate Government Loan 30-Year Fixed-Rate FHA Interest Rate|RR_GOV_30YFIXEDFHA_IR
Refinance Rate Government Loan 30-Year Fixed-Rate FHA APR|RR_GOV_30YFIXEDFHA_APR
Refinance Rate Conforming Loan 15-Year Fixed Rate Interest Rate|RR_CON_15YFIXED_IR
Refinance Rate Conforming Loan 15-Year Fixed Rate APR|RR_CON_15YFIXED_APR
*Refinance Rate Conforming Loan 7/1 ARM Interest Rate|RR_CON_71ARM_IR
*Refinance Rate Conforming Loan 7/1 ARM APR|RR_CON_71ARM_APR
*Refinance Rate Conforming Loan 5/1 ARM Interest Rate|PR_CON_51ARM_IR
*Refinance Rate Conforming Loan 5/1 ARM APR|PR_CON_51ARM_APR
Refinance Rate Government Loan 5/1 ARM FHA Interest Rate|RR_GOV_51ARMFHA_IR
Refinance Rate Government Loan 5/1 ARM FHA APR|RR_GOV_51ARMFHA_APR
Refinance Rate Larger Loan Amounts in Eligible Areas (Conforming Loan) 30-Year Fixed Rate Interest Rate|RR_LARGERCON_30YFIXED_IR
Refinance Rate Larger Loan Amounts in Eligible Areas (Conforming Loan) 30-Year Fixed Rate APR|RR_LARGERCON_30YFIXED_APR
Refinance Rate Larger Loan Amounts in Eligible Areas (Government Loan) 30-Year Fixed-Rate FHA Interest Rate|RR_LARGERGOV_30YFIXEDFHA_IR
Refinance Rate Larger Loan Amounts in Eligible Areas (Government Loan) 30-Year Fixed-Rate FHA APR|RR_LARGERGOV_30YFIXEDFHA_APR
Refinance Rate Larger Loan Amounts in Eligible Areas (Conforming Loan) 7/1 ARM Interest Rate|RR_LARGERCON_71ARM_IR
Refinance Rate Larger Loan Amounts in Eligible Areas (Conforming Loan) 7/1 ARM APR|RR_LARGERCON_71ARM_APR
Refinance Rate Jumbo Loan (Amounts that exceed conforming loan limits) 30-Year Fixed Rate Interest Rate|RR_JUMBO_30YFIXED_IR
Refinance Rate Jumbo Loan (Amounts that exceed conforming loan limits) 30-Year Fixed Rate APR|RR_JUMBO_30YFIXED_APR
Refinance Rate Jumbo Loan (Amounts that exceed conforming loan limits) 7/1 ARM Interest Rate|RR_JUMBO_71ARM_IR
Refinance Rate Jumbo Loan (Amounts that exceed conforming loan limits) 7/1 ARM APR|RR_JUMBO_71ARM_APR
QUANDL:FRED/MORTG
Feature to be Added:
Trending
Oscillators
Alerts
www.quandl.com
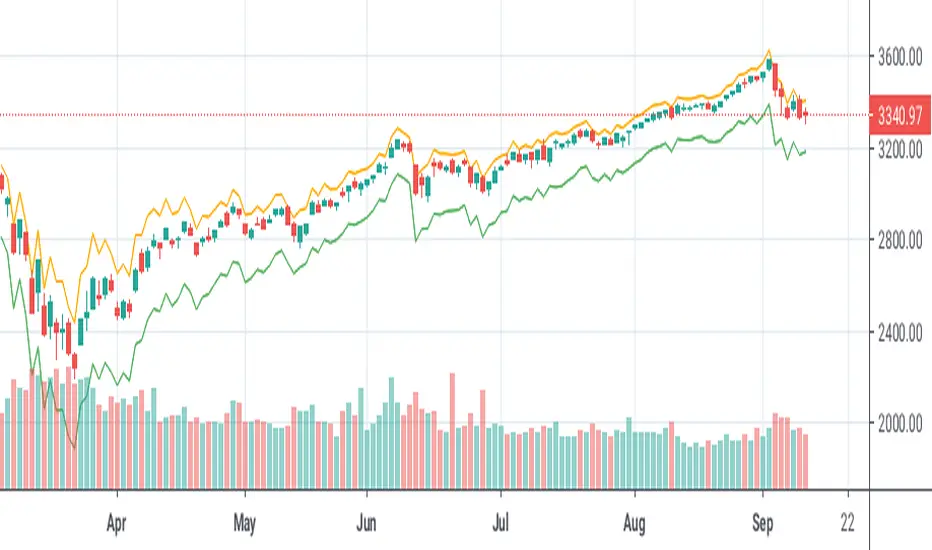
RISK-OFF.RISK.ON-ppxdf.v3======================================= RISK-OFF & RISK ON INDEX ================================================
1. Stock Price Momentum: Measuring the Standard & Poor's 500 Index ( S&P 500 ) versus its 125-day moving average (MA)
2. Stock Price Strength: Calculating the number of stocks hitting 52-week highs versus those hitting 52-week lows on the New York Stock Exchange (NYSE)
3. Stock Price Breadth: Analyzing trading volumes in rising stocks against declining stocks
4. Put and Call Options: How much do put options lag behind call options, signifying greed, or surpass them, indicating fear
5. Junk Bond Demand: Gauging appetite for higher risk strategies by measuring the spread between yields on investment-grade bonds and junk bonds
6. Market Volatility: CNN measures the Chicago Board Options Exchange Volatility Index ( VIX ), concentrating on a 50-day MA
7. Safe Haven Demand: The difference in returns for stocks versus treasuries
Each of these seven indicators is measured on a scale from 0 to 100, with the index being computed by taking an equal-weighted average of each of them.
A reading of 50 is deemed NEUTRAL.
Above 50 signals the market with RISK-ON. (GREED)
Below 50, Signals the market with RISK-OFF (FEAR)
8

[GM ELITE] Dynamic_Introduction
This is the first of the GM ELITE indicator range. Designed for Algorithmic Traders looking to speed up their process of testing and optimizing their algorithm. This script contains an entire suite of indicators, that work together in unison to find optimal trade entries, based on NNFX rules. There are two versions of this script. One is a strategy and built in back-tester, and the other will update in real time designed for live trading and forward testing.
This script is for live trading/forward testing.
Entries/Exits
The System has 5 indicator slots, and the user can choose one indicator per slot
- Trend Confirmation Indicators to pick when the market has taken off
- Volume and volatility Indicators to determine the strength of the trend or whether the market is ranging.
- Moving Averages for trend bias
- Exit Indicators to signal when to get out!
Money Management
Dynamic allows you to choose your Stop Loss and Take Profit distance based on a multiplier x ATR.
Options to exit the whole trade at TP or at a signal from the exit indicator of your choosing.
Start and End times (Window) to backtest.
Forex - $EVZ
Euro Volatility FX Vix ( aka $EVZ) is built in. You can toggle a filter for low $EVZ or whether or not EVZ is above average. No signals will be given if EVZ is below threshold. EVZ is one of the best indicators of overall forex market volume and volatility .
Customization
Several visual and color customization options. Thousands of possible parameter combinations.
The "bias" or mode of the Confirmation Indicators appears at the top and bottom of the screen as horizontal rows of triangles.
For any two-line Indicator (eg MACD ) if the fast line is above the slow line, the triangles are green, other-wise, they are red.
For any "Level Cross" indicator, when the line is above the level, the triangles are green, otherwise, they are red.
The Arrows at the bottom of the screen determine whether or not there is sufficient volume

MatrixBased on ChrisMoody CM_Williams_VIX_Fix and Glaz Matrix Series
I have difficault to enter exit trades and this is one of indicators that is helping me to get in/out in time
Applied changes are Vix multiplied by 10 to match scale and is made transparent not to confuse to much.

