COT - Noncommercial Interest (futures+options)Credit goes to Greeny for the script.
What is added:
You can see non-commercial interest for Eurodollar and Vix futures.
Cerca negli script per "vix"


IV Rank & IV PercentileThis indicator is meant to be a substitute for Implied Volatility Rank and Percentile for traders who do not have access to readily available options data. This indicator is based on the William's VixFix which is an indicator that mirrors the VIX, which charts the implied volatility of the SPX. The great thing about the VixFix is that it can be applied to any security, not just the SPX.
IV Rank is calculated by taking the highest and lowest values over the past however many periods you choose, and seeing what percentage of the way between those values the current IV value is. For example if over the past 5 periods the highest IV value was 30 and the lowest IV value was 10, and the current is 20; then the IV Rank would be 50% because 20 is 50% of the way between 10 & 30.
IV Percentile is calculated by looking at all of the past values, not just the highest and lowest, and seeing how many of those values were below the current. For example lets say over the past five periods the IV values were : 30,10,11,15, & 17; while the current IV value is 20. As stated before the IV Rank would be 50%, while the IV Percentile would be 80%, given that 4/5 of the values were below the current IV value of 20.
IV Rank and IV Percentile are often wrongly used interchangeably, but as shown here they are very different. Most people use IV Rank as their main options tool; while IV percentile is a great way to give IV Rank context. Whichever you choose to use, or even both, does not really matter as long as you use either one or both consistently.
IV Rank and IV Percentile are mainly used in this way: when IVR/IVP <50, buy options, when IVR/IVP >50 sell options. The reason that you buy options when IVR/IVP is low is because IV is mean reverting, so you would expect IV to eventually start increasing towards the mean, causing prices to move. The reason you would sell options when IVR/IVP is high is because IV is mean reverting and you would expect IV to decrease towards the mean, causing prices to move sideways.
In this script there are two lines, one denoting IVR and one denoting IVP. IVR is the line which is green when it's above 50 and red when below 50. IVP is the line which is aqua when above 50 and orange when below 50.

Historical Volatility RankSame formulation of IVR but based on Historical Volatility instead.
Serves the same purpose as IV rank.

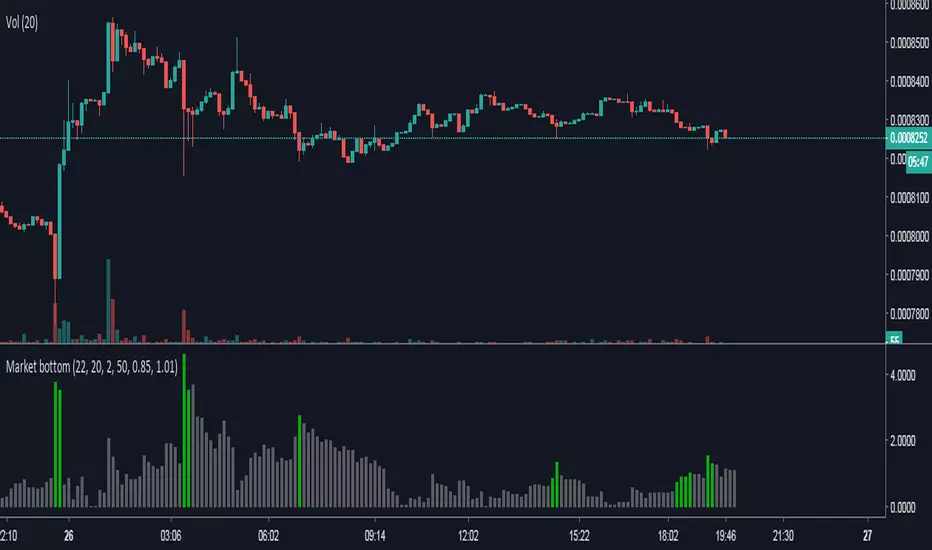
Market bottomLarry Williams Developed This Incredible Indicator. It Gives The Same Readings The VIX -2.01% does for Stock Index’s…But This Indicator Works on All Asset Classes.
I Customized The Settings Slightly To Create “Percentile” Based Highlight Bars…So You May Need To Adjust Slightly For Your Asset Class. These Are The Standard Settings Shown Here. Designed For Daily Charts…But Works GREAT On Intra-Day Charts!!!
Download the PDF and Read To Learn Larry’s Thought Process.
Link To PDF:
dl.dropboxusercontent.com
CP_EasyTrade_2Beta - Allowing a few subscribers to play with this indicator during the debug phase
About this indicator
1. Uses a variant of the Vix Fix to identify long/short entries
2. Users have full control over the loop back period so indicator can be optimized over any time frame
3. Thresholds allow users to change trigger level sensitivity

TTM Squeeze RibbonTTM is based on Greeny TTM, so not strict style (Yet).
TTM has multiplier and is by default set to 12 times the length of a standard TTM (12x 20 candles). So on 2h candles, it will show equivalent of 24hr TTM.
This is done to increase sampling rate for higher resolution curves.
**MAIN OSCILLATOR**
Teal and Pink line is the Main Momentum Oscillator, and behind it is the ribbon showing Momentums 2x, 3x, 4x, ... to 12x slower than Main Oscillator.
**SLOW TREND LINE**
The thick white line is the sample average (not time based moving average) of all the ribbons eg (osc1 + osc2 + osc3 ... + osc12)/12 and the thinner white line is a moving average of the thick line, to give cross over and show longer trend.
**ACCELERATION LINES**
The yellow to red to brown lines are the Momentums shorter than the Main oscillator eg x/2, x/3, x/4 and show the Acceleration of Main Oscillator, Above Zero is positive acceleration of Main Osc and the thick lime green line is the sample average of these lines.
**MAIN ACCELERATION LINE**
The lime green usually diverges with price when bottoming or topping of momentum is building and will show the change in Momentum in greater detail than just a Momentum Oscillator alone. The line leads the momentum oscillator, and When it crosses zero that means momentum has officially changed from one direction to another.
Since the lime green line is sample average of multiple lines, it changes direction more sharply than just a single oscillator line.
**PUMP BAND**
The dark green line with red outline is a bollinger band applied to the lime green line acceleration line. It shows squeezing when the lime green line is consolidating and blows out when the lime green line becomes volatile and makes a move in whichever direction.
**TTM SQUEEZE**
The dots show 4 squeezes on multiple time frames, but is not multiplied by 12x like the oscillators. Eg, the smallest dot on 2h candles is for 2h, but momentum as explained above is multiplied by default 12x so it is 24h. Th squeezes are multiples ranging from 1x (small black square), 2x Larger white square, 3x larger black square, 4x largest white square.
**SETTINGS**
The multiplier can be changed, so setting to 1x will be the same as regular TTM, but resolution will be greatly reduced. 12x seems good.
Thiccness just makes the lines thicker if you are using 4K screen or Mobile phone you can adjust to what looks good.
Im still learning how to use this and plan to make more changes so experiment and see if you can read the patterns. Hopefully that all made sense good enough.
Good ones to try is, BNB on 2h, SPX on 3d, BTC on 2h, VIX,
Enjoy and let me know what you think, only sharing this with few people for now

RSI/RCI3TripleTimeframe+VixFearInverseBottomDefault: RSI OFF,RCI ExLine OFF
RSI triangle signal: Buy-green Sell-red
Vix color(BG color): Fear-green Inverse-fuchsia Bottom-red

Change Per Period - Tom1traderwww.tradingview.com
Plots the values between current close and close (specified number of periods) ago. User chooses the period defaulted to 1 and the period of a simple moving average of the values in the series. Made this specifically to measure the drift of the VIX exchange traded funds VXX, UVXY and SVXY. The fact that they must drift can be strategic in trading.
In the chart example it shows that VXX drifts down usually between -$10 and -$20 over a 60 day period (eyeball) and that for a few days in February of 2017 it had drifted down -$75. To find a positive change (briefly) you can see you have to go back to November of 2016. If you use Heiken Ashi candles or ohlc bars or change between regular candles and these there is a set of variables in this code that lets you do that without changing your indicator results. Anyhow use it or any of the code if it helps you, good luck with your trading and keep smiling! (any feedback appreciated also :-) )

Daily Deviations (Lazy Edition)
Plots the standard deviation resistance/support lines.
Uses Previous days close and the VIX as the volatility factor.
credit to u/UberBotMan and u/Living_Granger for the idea and formulas


IVR = implied volatility rank for volatility productsuse this indicator on VOLATILITY products such as OVX, VIX, GVX .... (search for "volatility")


SPY/VXX/TLT RSI crisscrossAre treasuries moving with VIX or are they correlated with equities?
Who's changing faster, VXX or SPY?
The indicator displays the RSI's of SPY, VXX and TLT so you can see how they are moving relative to each other.

Humble Student OB/OS Trifecta indicatorAfter reading Cam Hui's blog post about his "Trifecta" bottom spotting model I thought I'd try my hand at scripting it as an indicator. The results are pretty close to what he describes. Though the data TradingView feeds me doesn't seem to be identical to what he's using on StockCharts.com the results are close enough that I will call the effort a success worth publishing.

CM_Laguerre PPO PercentileRank Mkt Tops & BottomsCustom Code that Finds Market Tops & Bottoms!!!
CM_Laguerre PPO PercentileRank V2 Mkt Tops & Bottoms
Original Laguerre PPO code was Created by TheLark.
Special Thanks to coondawg71 and ChartArt for Great Insights
This Is Version 2 Of This Indicator that now Finds Market Tops and Bottoms.
Coming Next…Upper Indicator Pinpointing Entries Based on Price Action!!!
See Original Post Below For Detailed Information.
Other Indicators That Show Market Bottoms Well.
CM ATR PERCENTILERANK - GREAT FOR SHOWING MARKET BOTTOMS!
GREAT CONFIRMING INDICATOR FOR THE WILLIAMS VIX FIX
TWO TRADING SYSTEMS - BASED ON EXTREME MOVES!!!

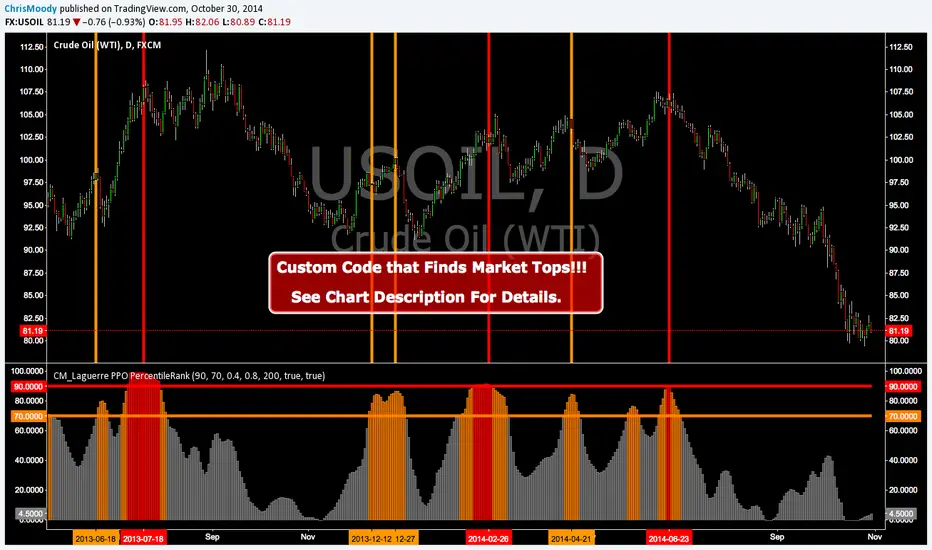
CM_Laguerre PPO PercentileRank - Markets ToppingCustom Code that Finds Market Tops!!!
CM_Laguerre PPO PercentileRank - Markets Topping
Original Laguerre PPO code was Created by TheLark.
I found if I applied a Percent Rank of the PPO to view Extreme Moves in the PPO it was great at showing Market Tops.
Features via Inputs Tab:
Ability to set all PPO Indicator Values.
Ability to set Warning Threshold Line Value and Extreme Percentile Threshold Line Values.
Ability to turn On/Off Warning and Extreme Percentile Rank Lines.
***I’ve found this Indicator to be Valid…However, I have NOT Extensively tested the Settings. Initially setting the LookBack Period to 200 on A Daily chart with a 90 Extreme Percentile Rank Value works Good. Some charts changing the Lookback period to 50 an draisisng the Extreme Percentile Rank Line to 95 Works Great.
***To Be Blunt…When I look at the underlying Indicator…I don’t know why this Shows Us What It Does When the Percentile Rank Function is applied to it…But For Whatever Reason…It Just Works.
***If you Find Very Useful Settings Please Post Below
Other Indicators That Show Market Bottoms Well.
CM ATR PERCENTILERANK - GREAT FOR SHOWING MARKET BOTTOMS!
GREAT CONFIRMING INDICATOR FOR THE WILLIAMS VIX FIX
TWO TRADING SYSTEMS - BASED ON EXTREME MOVES!!!
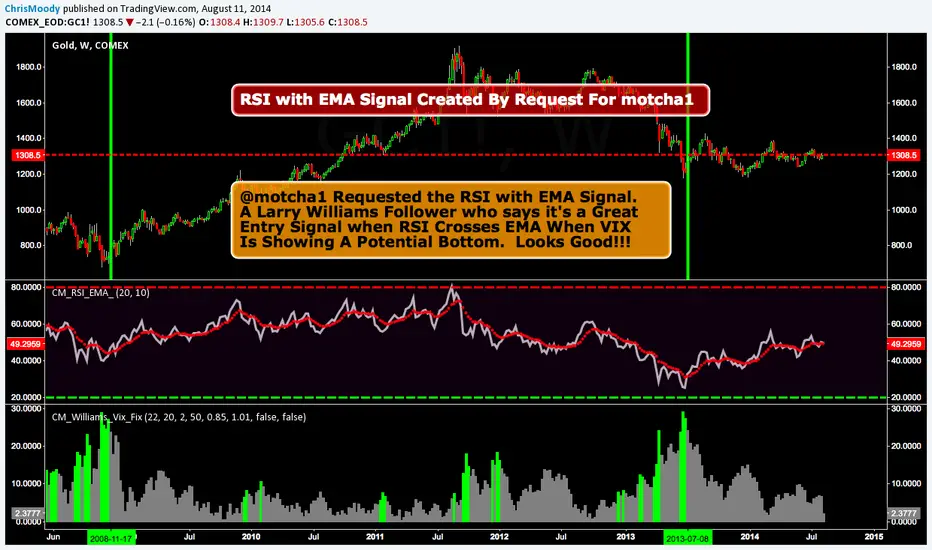
CM_RSI Plus EMARSI with EMA Signal Created By Request For @motcha1
@motcha1 Requested the RSI with EMA Signal.
A Larry Williams Follower who says it's a Great
Entry Signal when RSI Crosses EMA When VIX
Is Showing A Potential Bottom. Looks Good!!!
Link to Lower Indicator CM_Williams_Vix_Fix
CM_Williams_Vix_Fix Finds Market BottomsLarry Williams Developed This Incredible Indicator. It Gives The Same Readings The VIX does for Stock Index’s…But This Indicator Works on All Asset Classes.
I Customized The Settings Slightly To Create “Percentile” Based Highlight Bars…So You May Need To Adjust Slightly For Your Asset Class. These Are The Standard Settings Shown Here. Designed For Daily Charts…But Works GREAT On Intra-Day Charts!!!
