Volume Indicators PackageCONTAINS 3 OF MY BEST VOLUME INDICATORS ALL FOR THE PRICE OF ONE!
CONTAINS:
Average Dollar Volume in RED
Up/Down Volume Ratio in Green
Volume Buzz/Volume Run Rate in BLUE
If you would like to get these individually, I also have scripts for that too.
Below is information about all three of these indicators, what they do, and why they are important.
---------------------------------------------------------------------------------------------AVERAGE DOLLAR VOLUME----------------------------------------------------------------------------------------
Dollar volume is simply the volume traded multiplied times the cost of the stock.
Dollar volume is an extremely important metric for finding stocks with enough liquidity for market makers to position themselves in. Market Liquidity is defined as market's feature whereby an individual or firm can quickly purchase or sell an asset without causing a drastic change in the asset's price. The key concept you want to understand is that these big instructions with billions of dollars need liquidity in a stock in order to even think about buying it, and therefore these institutions will demand a large dollar volume . A good dollar volume amount, that represents a pretty liquid name, is typically above 100 million $ average. Why are institutions important? Simple because they are the ones who make stocks move, and I mean really move. If you want to see large growth from a stock in a short amount of time, you need institutions wielding billions of dollars to be fighting one another to buy more shares. Institutions are the ones who make or break a stock, this is why we call them market makers.
My script calculates average dollar volume using four averages: the 50, the 30, the 20, and the 10 period. I use multiple averages in order to provide the accurate and up to date information to you. It then selects the minimum of these averages and divides this value by 1 million and displays this number to you.
TL;DR? If you want monster moves from your stocks, you need to pick names with average high liquidity(dollar volume >= $100 million). The number presented to you is in millions of whatever currency the name is traded in.
---------------------------------------------------------------------------------------------UP/DOWN VOLUME RATIO-----------------------------------------------------------------------------------------
Up/Down Volume Ratio is calculated by summing volume on days when it closes up and divide that total by the volume on days when the stock closed down.
High volume up days are typically a sign of accumulation(buying) by big players, while down days are signs of distribution(selling) by big market players. The Up Down volume ratio takes this assumption and turns it into a tangible number that's easier for the trader to understand. My formula is calculated using the past 50 periods, be warned it will not display a value for stocks with under 50 periods of trading history. This indicator is great for identify accumulation of growth stocks early on in their moves, most of the time you would like a growth stocks U/D value to be above 2, showing institutional sponsorship of a stock.
Up/Down Volume value interpretation:
U/D < 1 -> Bearish outlook, as sellers are in control
U/D = 1 -> Sellers and Buyers are equal
U/D > 1 -> Bullish outlook, as buyers are in control
U/D > 2 -> Bullish outlook, significant accumulation underway by market makers
U/D >= 3 -> MONSTER STOCK ALERT, market makers can not get enough of this stock and are ravenous to buy more
U/D values greater than 2 are rare and typically do not last very long, and U/D >= 3 are extremely rare one example I kind find of a stock's U/D peaking above 3 was Google back in 2005.
-----------------------------------------------------------------------------------------------------VOLUME BUZZ-----------------------------------------------------------------------------------------------
Volume Buzz/ Volume Run Rate as seen on TC2000 and MarketSmith respectively.
Basically, the volume buzz tells you what percentage over average(100 time period moving average) the volume traded was. You can use this indicator to more readily identify above-average trading volume and accumulation days on charts. The percentage will show up in the top left corner, make sure to click the settings button and uncheck the second box(left of plot) in order to get rid of the chart line.
Cerca negli script per "volume indicator"

Volume Indicator wih EOD volume predictionThis indicator displays the volume of each session in a similar manner of the default volume indicator
However it add on the last bar a green bar that shows the expected volume for the end of the session
One might use it to anticipate the end of day volume and decide if the current price action is strong or not
This might also be used to anticipate the appearance of a pocket pivot signal or buyable gap up
This indicator is designed to be used on daily chart exclusively
Indicator: Relative Volume Indicator & Freedom Of MovementRelative Volume Indicator
------------------------------
RVI is a support-resistance technical indicator developed by Melvin E. Dickover. Unlike many conventional support and resistance indicators, the Relative Volume Indicator takes into account price-volume behavior in order to detect the supply and demand pools. These pools are marked by "Defended Price Lines" (DPLs), also introduced by the author.
RVI is usually plotted as a histogram; its bars are highlighted (black, by default) when the volume is unusually large. According to the author, this happens if the indicator value exceeds 2.0, thus signifying that a possible DPL is present.
DPLs are horizontal lines that run across the chart at levels defined by following conditions:
* Overlapping bars: If the indicator spike (i.e., indicator is above 2.0 or a custom value)
corresponds to a price bar overlapping the previous one, the previous close can be used as the
DPL value.
* Very large bars: If the indicator spike corresponds to a price bar of a large size, use its
close price as the DPL value.
* Gapping bars: If the indicator spike corresponds to a price bar gapping from the previous bar,
the DPL value will depend on the gap size. Small gaps can be ignored: the author suggests using
the previous close as the DPL value. When the gap is big, the close of the latter bar is used
instead.
* Clustering spikes: If the indicator spikes come in clusters, use the extreme close or open
price of the bar corresponding to the last or next to last spike in cluster.
DPLs can be used as support and resistance levels. In order confirm and refine them, RVI is used along with the FreedomOfMovement indicator discussed next.
Freedom of Movement Indicator
------------------------------
FOM is a support-resistance technical indicator, also by Melvin E. Dickover. FOM is the ratio of relative effect (relative price change) to the relative effort (normalized volume), expressed in standard deviations. This value is plotted as a histogram; its bars are highlighted (black, by default( when this ratio is unusually high. These highlighted bars, or "spikes", define the positioning of the DPLs.
Suggestions for placing DPLs are the same as for the Relative Volume Indicator discussed above.
Note that clustering spikes provide the strongest DPLs while isolated spikes can be used to confirm and refine those provided by the Relative Volume Indicator. Coincidence of spikes of the two indicator can be considered a sign of greater strength of the DPL.
More info:
S&C magazine, April 2014.
I am still trying these on various instruments to understand the workings more. Don't forget to share what you learn -- any use cases / ideal scenarios / gotchas, would love to hear them all.

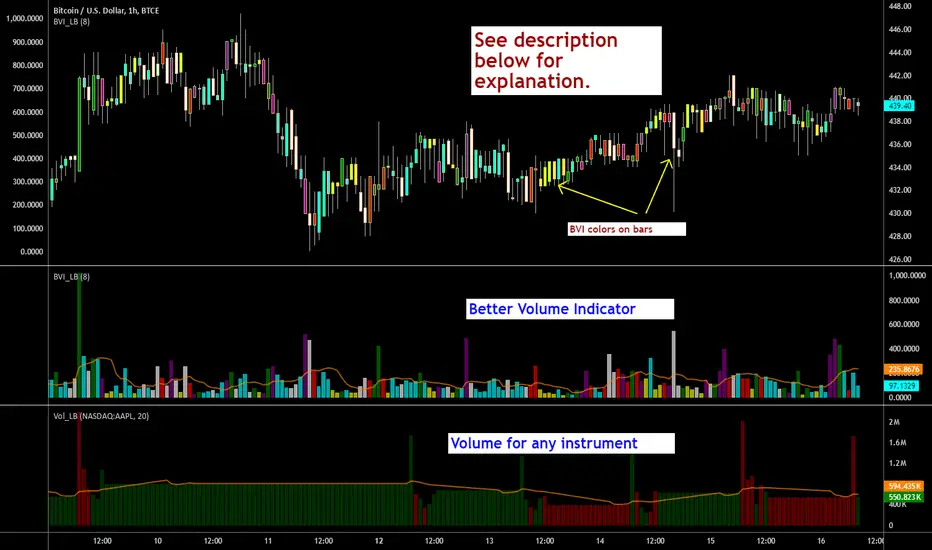
Indicators: Better Volume Indicator & InstrumentVolumeBetter Volume Indicator
-----------------------------------------
This is a direct port of a famous indicator from Tradestation platform.
BVI improves on your typical volume histogram by coloring the bars based on 5 criteria:
* Volume Climax Up – high volume, high range, up bars (red)
* Volume Climax Down – high volume, high range, down bars (white)
* High Volume Churn – high volume, low range bars (green, barcolor= blue)
* Low Volume – low volume bars (yellow)
* Volume Climax plus High Volume Churn – both the above conditions (magenta)
When there are no volume signals the default histogram bar coloring is cyan.
Bars can also be colored to match volume color. Enable "Change BarColors?" in the options page.
Volume Climax Up bars are typically seen at:
* The start of up trends
* The end of up trends, and
* Pullbacks during down trends.
Volume Climax Down bars are typically seen at:
* The start of down trends
* The end of down trends, and
* Pullbacks during up trends.
High Volume Churn bars are typically seen at:
* The end of up trends
* The end of down trends, and
* Profit taking mid-trend.
Low Volume bars are typically seen at:
* The end of up trends
* The end of down trends, and
* Pullbacks mid-trend.
More info:
emini-watch.com
Instrument Volume
-----------------------------------------
This is a simple script that allows you to plot volume for any instrument.
Very handy when you want to compare volumes. Just add multiple instances and select the symbol you want via Options page.
This script also gets close/open for the selected symbol. If you are itching to get started on Pinescripting (scripting language used at TV), I suggest trying out the following, using this script as the template:
- Show RSI for any instrument
(hint: "close" for the selected symbol is already in script. Do a "plot(rsi(c, 14))")
- MACD / CCI / ....
- Plot the difference (not correlation). This may be of interest in some instruments.
For ex. BTC in BTCE exchange mostly lags BITSTAMP.
Hope this piques your interest in Pine. Feel free to post in the Pinescript room if you have any queries.
TechniTrend: Trend and Volume Indicator🟪 Overview
The "TechniTrend: Trend and Volume Indicator" is designed to assist traders in identifying optimal entry and exit points in the market by combining trend detection and volume analysis. This indicator integrates moving average-based trend recognition with volume threshold analysis to provide clear buy and sell signals. Additionally, it includes divergence filtering and correlation analysis to enhance the accuracy of signals, making it suitable for traders who want to identify strong trends and high-probability trading opportunities.
🟪 Indicator Components
🔹Trend Moving Average (MA):
The indicator calculates a moving average based on the closing prices to identify the overall trend. Various moving average types are available for customization:
Simple Moving Average (SMA)
Exponential Moving Average (EMA)
Weighted Moving Average (WMA)
Hull Moving Average (HMA)
The length of the moving average can be adjusted via the Trend MA Length input to adapt to different market conditions.
🔹Volume Analysis:
A volume moving average is calculated over a specified period (Volume MA Length), with a volume threshold derived by multiplying this average by a user-defined Volume Threshold Factor.
This threshold helps to classify volume as either high or low, which plays a crucial role in signal generation.
🔹Divergence Detection:
The indicator can filter out signals when there is a divergence between the price movement and volume changes. Divergence occurs when the price moves in one direction while the volume moves in the opposite direction, indicating a potential weakening of the trend.
🔹Correlation Analysis:
The correlation between price and volume changes is calculated over the same length as the trend moving average. The user can enable this filter to ensure that buy or sell signals are only generated when the correlation exceeds a specified threshold (Correlation Threshold).
🟪 Signals and Alerts
🔹Buy Signal: Generated when the price is above the trend moving average (indicating an uptrend), and the current volume exceeds the volume threshold (indicating high volume). The signal can be filtered based on divergence or correlation settings.
🔹Sell Signal: Triggered when the price is below the trend moving average (indicating a downtrend), and the volume is above the threshold. Similarly, the signal is affected by divergence and correlation filters.
🔹Visual Indicators:
The trend line is plotted on the chart for easy trend identification.
Buy and sell signals are displayed using green and red labels, respectively.
Background highlighting is used to mark areas of high volume on the chart.
🟪 Customizable Inputs
🔹Trend MA Length: Adjusts the moving average length used to detect trends.
🔹Volume MA Length: Sets the length for the volume moving average calculation.
🔹MA Type for Trend: Select the type of moving average for trend detection (SMA, EMA, WMA, HMA).
🔹Volume Threshold Factor: Multiplier used to define high-volume conditions based on the volume moving average.
🔹Enable Divergence Filter: Allows the user to filter out signals where divergence between price and volume is detected.
🔹Enable Correlation Filter: Enables filtering of signals based on the correlation between price and volume changes.
🔹Correlation Threshold: Sets the minimum correlation value required for a signal to be considered valid.
🟪 Alerts
The indicator provides alert conditions for buy and sell signals, allowing traders to receive notifications when new trading opportunities arise.
🟪 Usage Tips
🔹Adjust Moving Average Lengths: Shorter lengths can make the indicator more sensitive to recent market changes, while longer lengths provide a smoother, more reliable trend signal.
🔹Volume Threshold Factor: Increasing this factor raises the volume required to generate high-volume signals, which can help filter.
🟪 Disclaimer:
The "TechniTrend: Trend and Volume Indicator" is a technical analysis tool intended for educational and informational purposes only. It is not a guarantee of future performance or a recommendation to buy, sell, or hold any financial instrument. Trading involves significant risk, and past performance is not indicative of future results. Users should conduct their own research and seek advice from a qualified financial professional before making any investment decisions. The creators of this indicator are not liable for any financial losses or damages incurred through its use.

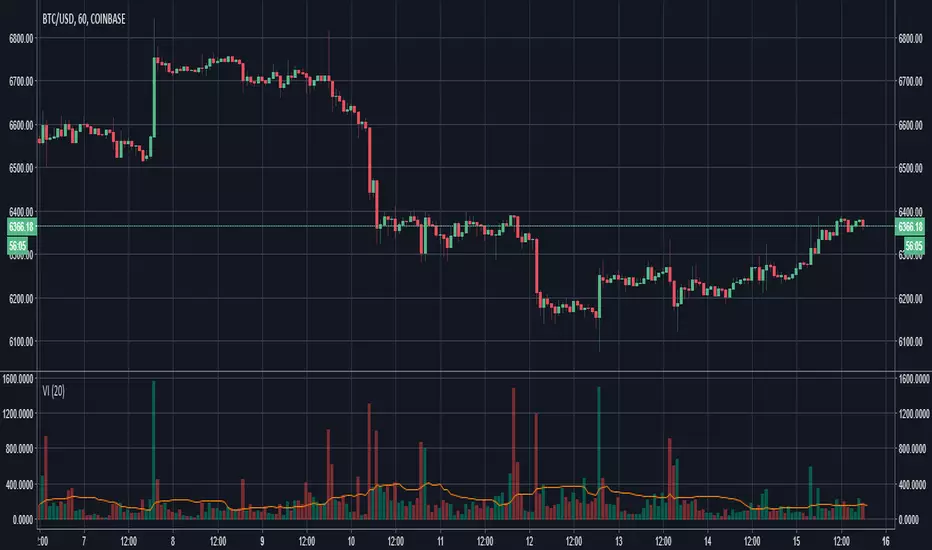
Relative Strength of Volume Indicators by DGTThe Relative Strength Index (RSI) , developed by J. Welles Wilder, is a momentum oscillator that measures the speed and change of price movements.
• Traditionally the RSI is considered overbought when above 70 and may be primed for a trend reversal or corrective pullback in price, and oversold or undervalued condition when below 30. During strong trends, the RSI may remain in overbought or oversold for extended periods.
• Signals can be generated by looking for divergences and failure swings. If underlying prices make a new high or low that isn't confirmed by the RSI, this divergence can signal a price reversal. If the RSI makes a lower high and then follows with a downside move below a previous low, a Top Swing Failure has occurred. If the RSI makes a higher low and then follows with an upside move above a previous high, a Bottom Swing Failure has occurred
• RSI can also be used to identify the general trend. In an uptrend or bull market, the RSI tends to remain in the 40 to 90 range with the 40-50 zone acting as support. During a downtrend or bear market the RSI tends to stay between the 10 to 60 range with the 50-60 zone acting as resistance
This study aim to implement Relative Strength concept on most common Volume indicators, such as
• Accumulation Distribution is a volume based indicator designed to measure underlying supply and demand
• Elder's Force Index (EFI) measures the power behind a price movement using price and volume
• Money Flow Index (MFI) measures buying and selling pressure through analyzing both price and volume (used as it is)
• On Balance Volume (OBV) , created by Joe Granville, is a momentum indicator that measures positive and negative volume flow
• Price Volume Trend (PVT) is a momentum based indicator used to measure money flow
Plotting will be performed for regular RSI and RSI of Volume indicator (RSI(VOLX)) selected from the dialog box, where the possibility to apply smoothing is provided as option. Additionally, labels can be added optionally to display the value and name of selected volume indicator
Secondly, ability to present Volume Histogram within the same study along with its Moving Average or Volume Oscillator based on selection
Finally, Volume Based Colored Bars , a study of Kıvanç Özbilgiç is added to emphasis volume changes on top of the bars
Nothing excessively new, the study combines RSI with;
- RSI concept applied to some of the common Volume indicators presented with a highlighted over/under valued threshold area, optional labeling and smoothing,
- added Volume data with additional information and
- colored bars based on volume
Thanks @Vishant_Meshram for the inspiration 🙏
Disclaimer:
Trading success is all about following your trading strategy and the indicators should fit within your trading strategy, and not to be traded upon solely
The script is for informational and educational purposes only. Use of the script does not constitute professional and/or financial advice. You alone have the sole responsibility of evaluating the script output and risks associated with the use of the script. In exchange for using the script, you agree not to hold dgtrd TradingView user liable for any possible claim for damages arising from any decision you make based on use of the script

Relative Directional Volume Indicator# Relative Directional Volume Indicator (RelDirVol)
## Overview
The Relative Directional Volume Indicator (RelDirVol) is a powerful volume analysis tool that measures current trading volume relative to historical volume while differentiating between bullish and bearish volume flows. This indicator helps traders identify unusual volume activity and determine whether it's coming from buyers or sellers, providing deeper insights into market participation and potential trend strength.
## Features
- **Relative Volume Calculation**: Compares current volume to historical averages
- **Directional Volume Analysis**: Separates and visualizes bullish vs bearish volume
- **Multiple Moving Average Options**: Customize smoothing with various MA types (SMA, EMA, WMA, HMA, VWMA)
- **Split Moving Averages**: View distinct moving averages for bullish and bearish volume flows
- **Reference Lines**: Visual guides for normal volume (1.0x) and key deviation levels (0.5x, 2.0x, 3.0x)
- **Customizable Colors**: Adjust visual appearance for improved chart readability
## How It Works
The indicator calculates the relative volume by dividing the current bar's volume by the average volume over a specified lookback period. It then categorizes this volume as either bullish (when price closes above the open) or bearish (when price closes below or equal to the open).
1. **Relative Volume**: Current volume ÷ Average volume from previous N bars
2. **Directional Classification**: Assigns volume to bullish or bearish categories based on price action
3. **Moving Averages**: Applies user-selected moving average to smooth the data
The result is displayed as color-coded histogram bars showing the relative volume magnitude, with optional moving average lines for both overall and direction-specific volume trends.
## Interpretation
### Volume Magnitude
- **Above 1.0**: Higher than average volume (more participation than normal)
- **Below 1.0**: Lower than average volume (less participation than normal)
- **2.0+**: Volume twice the normal level (significant participation)
- **3.0+**: Volume three times normal (exceptional participation, often at key events)
### Directional Analysis
- **Strong Green Bars**: Heavy bullish participation driving prices up
- **Strong Red Bars**: Heavy bearish participation driving prices down
- **Bullish MA > Bearish MA**: Overall buying pressure dominating
- **Bearish MA > Bullish MA**: Overall selling pressure dominating
### Key Signals
- **Volume Spikes with Price Breakouts**: Confirms strength of the move
- **Divergence Between MAs**: Early warning of potential shift in market control
- **Sustained Above-Average Volume**: Strong trend continuation likely
- **Volume Decline After Spike**: Potential exhaustion of trend
## Settings
- **Relative Volume Lookback**: Comparison period for average volume (default: 20)
- **Moving Average Type**: Method used for smoothing (default: SMA)
- **Moving Average Length**: Smoothing period (default: 5)
- **Show Moving Average**: Toggle overall volume MA visibility
- **Show Baseline**: Toggle 1.0 reference line visibility
- **Show Bullish/Bearish MAs**: Toggle direction-specific MA visibility
## Best Practices
This indicator performs best when combined with price action analysis and other indicators. Look for:
1. Volume confirmation of breakouts and trend changes
2. Divergence between price movement and volume direction
3. Shifts in the relationship between bullish and bearish MAs
4. Unusual volume patterns during consolidation phases
Particularly effective for swing trading, day trading, and identifying institutional participation in market moves across multiple timeframes.
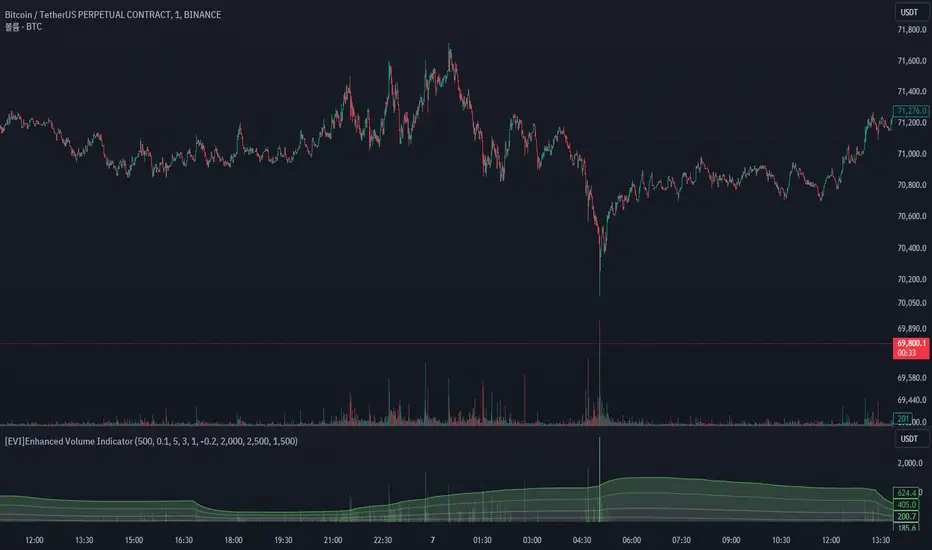
[EVI]Enhanced Volume IndicatorEnglish Version
Enhanced Volume Indicator (EVI)
The Enhanced Volume Indicator (EVI) is an advanced yet user-friendly tool designed to measure and visualize the strength of market volume using the statistical power of standard deviation. By offering a clear and dynamic representation of volume fluctuations, the EVI enables traders to effortlessly identify significant market movements and potential trading opportunities.
Key Features:
Sophisticated Volume Strength Assessment: The EVI leverages the standard deviation of historical candle volumes to evaluate and categorize the current volume intensity. This sophisticated methodology allows for the precise detection of when current volume levels significantly deviate from their historical norms.
Intuitive Visual Cues: Volume bars are color-coded to represent varying levels of volume intensity, ranging from very weak to very strong. This intuitive visual differentiation aids traders in quickly grasping the market's underlying volume dynamics at a glance.
Proactive Threshold Alerts: Stay ahead of the market with the EVI’s built-in alert functionality. Receive real-time notifications of critical volume changes, ensuring that you remain informed of significant market developments even while away from your trading desk.
How It Works:
The EVI calculates the Simple Moving Average (SMA) and Standard Deviation (STDEV) of volume over a user-defined period (default set to 500 candles). Utilizing these statistical measures, the indicator establishes various volume thresholds by applying predefined multipliers for extreme, high, medium, and low volume levels. The volume bars are then color-coded based on these thresholds, providing traders with a clear visual representation of volume intensity. Additionally, horizontal lines indicating these thresholds are plotted on the chart for easy reference, further enhancing the indicator’s usability.
This version of the EVI is particularly suited for traders who prefer simplicity and efficiency over complexity, making it an excellent alternative to the more intricate Volume Delta Divergence (VDD) indicator. The EVI delivers powerful volume insights in a straightforward and accessible manner, ensuring that even those who favor less complexity can benefit from robust volume analysis.
Ideal for traders seeking to capture major market moves or pinpoint potential reversals, the Enhanced Volume Indicator (EVI) is a must-have tool. Elevate your trading strategy with the EVI and ensure you never miss out on significant volume breakouts again.
Korean Version
Enhanced Volume Indicator (EVI)
Enhanced Volume Indicator (EVI)는 시장 볼륨의 강도를 표준편차의 통계적 힘을 사용하여 측정하고 시각화하는 고급적이면서도 사용하기 쉬운 도구입니다. EVI는 볼륨 변동의 명확하고 동적인 표현을 제공하여 트레이더가 중요한 시장 움직임과 잠재적인 거래 기회를 쉽게 식별할 수 있도록 합니다.
주요 기능:
정교한 볼륨 강도 평가: EVI는 이전 캔들의 볼륨 표준편차를 활용하여 현재 볼륨 강도를 평가하고 분류합니다. 이 정교한 방법론은 현재 볼륨 수준이 과거 평균에서 크게 벗어날 때를 정확하게 감지할 수 있도록 합니다.
직관적인 시각적 신호: 볼륨 바는 매우 약한 것부터 매우 강한 것까지 다양한 볼륨 강도를 나타내는 색상으로 코딩됩니다. 이 직관적인 시각적 차별화는 트레이더가 시장의 기본적인 볼륨 동향을 한눈에 쉽게 파악할 수 있도록 돕습니다.
선제적 임계값 알림: EVI의 내장 알림 기능으로 시장을 앞서가십시오. 중요한 볼륨 변화에 대한 실시간 알림을 받아 거래 데스크를 떠나 있는 동안에도 중요한 시장 발전에 대해 계속 정보를 얻을 수 있습니다.
작동 원리:
EVI는 사용자가 정의한 기간(기본값은 500 캔들)의 볼륨에 대한 단순 이동평균(SMA)과 표준편차(STDEV)를 계산합니다. 이러한 통계적 측정을 활용하여, 인디케이터는 극단적, 높은, 중간 및 낮은 볼륨 수준에 대한 사전 정의된 배수를 적용하여 다양한 볼륨 임계값을 설정합니다. 그런 다음, 볼륨 바는 이러한 임계값을 기반으로 색상 코딩되어 트레이더에게 볼륨 강도의 명확한 시각적 표현을 제공합니다. 또한, 이러한 임계값을 나타내는 수평선이 차트에 참조용으로 표시되어 인디케이터의 사용성을 더욱 향상시킵니다.
이 버전의 EVI는 복잡함보다는 단순함과 효율성을 선호하는 트레이더에게 특히 적합하여, 더 복잡한 Volume Delta Divergence (VDD) 인디케이터에 대한 훌륭한 대안이 됩니다. EVI는 강력한 볼륨 정보를 간단하고 접근 가능한 방식으로 제공하여, 복잡함을 싫어하는 사용자도 강력한 볼륨 분석의 혜택을 누릴 수 있도록 합니다.
주요 시장 움직임을 포착하거나 잠재적인 반전을 식별하려는 트레이더에게 이상적인 Enhanced Volume Indicator (EVI)는 반드시 갖추어야 할 도구입니다. EVI로 트레이딩 전략을 강화하고 중요한 볼륨 돌파를 절대 놓치지 마세요.
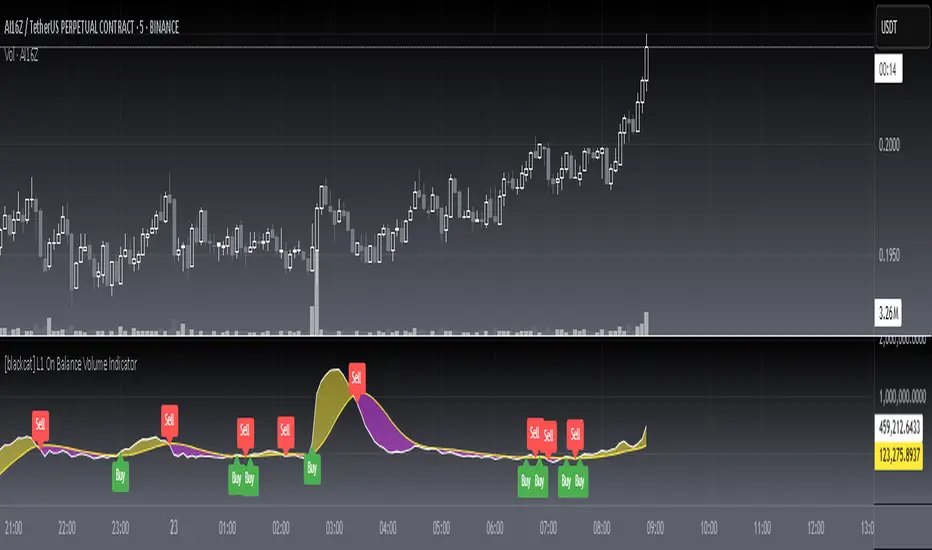
L1 On Balance Volume IndicatorLevel: 1
Background
On Balance Volume (OBV) is a simple indicator that uses volume and price to measure buying and selling pressure. The buying pressure is evident when the positive volume exceeds the negative volume and the OBV line rises.
Function
L1 On Balance Volume Indicator is a simple but improved OBV by using alma and more input parameters
Key Signal
OBV and its ALMA
Pros and Cons
Pros:
1. More freedom to tune with more input parameters
2. ALMA can make better tradeoff between response and smooth
Cons:
1. No details of volume generation can be disclosed
2. It may help to judge trend but not the short-term price movements.
Remarks
NA
Readme
In real life, I am a prolific inventor. I have successfully applied for more than 60 international and regional patents in the past 12 years. But in the past two years or so, I have tried to transfer my creativity to the development of trading strategies. Tradingview is the ideal platform for me. I am selecting and contributing some of the hundreds of scripts to publish in Tradingview community. Welcome everyone to interact with me to discuss these interesting pine scripts.
The scripts posted are categorized into 5 levels according to my efforts or manhours put into these works.
Level 1 : interesting script snippets or distinctive improvement from classic indicators or strategy. Level 1 scripts can usually appear in more complex indicators as a function module or element.
Level 2 : composite indicator/strategy. By selecting or combining several independent or dependent functions or sub indicators in proper way, the composite script exhibits a resonance phenomenon which can filter out noise or fake trading signal to enhance trading confidence level.
Level 3 : comprehensive indicator/strategy. They are simple trading systems based on my strategies. They are commonly containing several or all of entry signal, close signal, stop loss, take profit, re-entry, risk management, and position sizing techniques. Even some interesting fundamental and mass psychological aspects are incorporated.
Level 4 : script snippets or functions that do not disclose source code. Interesting element that can reveal market laws and work as raw material for indicators and strategies. If you find Level 1~2 scripts are helpful, Level 4 is a private version that took me far more efforts to develop.
Level 5 : indicator/strategy that do not disclose source code. private version of Level 3 script with my accumulated script processing skills or a large number of custom functions. I had a private function library built in past two years. Level 5 scripts use many of them to achieve private trading strategy.
Separate Volume IndicatorFor those that want the volume indicator in a separate view, this is for you. Now you can apply drawing tools, scale, hide, whatever you wish to the volume graph.
This is very similar to "Unmerge down" when applying the volume graph, but the idea being you can add more customization to the pine script rather than applying separate indicators.
RVol+ Enhanced Relative Volume Indicator📊 RVol+ Enhanced Relative Volume Indicator
Overview
RVol+ (Relative Volume Plus) is an advanced time-based relative volume indicator designed specifically for swing traders and breakout detection. Unlike simple volume comparisons, RVol+ analyzes volume at the same time of day across multiple sessions, providing statistically significant insights into institutional activity and breakout potential.
🎯 Key Features
Core Volume Analysis
Time-Based RVol Calculation - Compares current cumulative volume to the average volume at this exact time over the past N days
Statistical Z-Score - Measures volume in standard deviations from the mean for true anomaly detection
Volume Percentile - Shows where current volume ranks historically (0-100%)
Sustained Volume Filter - 3-bar moving average prevents false signals from single-bar spikes
Breakout Detection
🚀 Confirmed Breakouts - Identifies price breakouts validated by high volume (RVol > 1.5x)
⚠️ False Breakout Warnings - Alerts when price breaks key levels on low volume (high failure risk)
Multi-Timeframe Context - Weekly volume overlay prevents chasing daily noise
Advanced Metrics
OBV Divergence Detection - Spots bullish/bearish accumulation/distribution patterns
Volume Profile Integration - Identifies institutional positioning
Money Flow Analysis - Tracks smart money vs retail activity
Extreme Volume Alerts - 🔥 Labels mark unusual spikes beyond the display cap
Visual Intelligence
Smart Color Coding:
🟢 Bright Teal = High activity (RVol ≥ 1.5x)
🟡 Medium Teal = Caution zone (RVol ≥ 1.2x)
⚪ Light Teal = Normal activity
🟠 Orange = Breakout confirmed
🔴 Red = False breakout risk
Comprehensive Stats Table:
Current Volume (formatted as M/K/B)
RVol ratio
Z-Score with significance
Volume percentile
Historical average and standard deviation
Sustained volume confirmation
📈 How to Use
For Swing Trading (1D - 3W Holds)
Perfect Setup:
✓ RVol > 1.5x (bright teal)
✓ Z-Score > 2.0 (⚡ alert)
✓ Percentile > 90%
✓ Sustained = ✓
✓ 🚀 Breakout label appears
Avoid:
✗ Red "Low Vol" warning during breakouts
✗ RVol < 1.0 at key levels
✗ Sustained volume not confirmed
Signal Interpretation
⚡ Z>2 Labels - Statistically significant volume (95th+ percentile) - highest probability moves
↗️ OBV+ Labels - Bullish accumulation (OBV rising while price consolidates)
↘️ OBV- Labels - Bearish distribution (OBV falling while price rises)
🔵 Blue Background - Weekly volume elevated (confirms daily strength)
⚙️ Customization
Basic Settings
N Day Average - Number of historical days for comparison (default: 5)
RVol Thresholds - Customize highlight levels (default: 1.2x, 1.5x)
Visual Display Cap - Prevent extreme spikes from compressing view (default: 4.0x)
Advanced Metrics (Toggle On/Off)
Z-Score analysis
Weekly RVol context
OBV divergence detection
Volume percentile ranking
Breakout signal generation
Table Customization
Position - 9 placement options to avoid chart overlap
Size - Tiny to Huge
Colors - Full customization of positive/negative/neutral values
Transparency - Adjustable background
Debug Mode
Enable Pine Logs for calculation transparency
Adjustable log frequency
Real-time calculation breakdown
🔬 Technical Details
Algorithm:
Binary search for historical lookups (O(log n) performance)
Time-zone aware session detection
DST-safe timestamp calculations
Exponentially weighted standard deviation
Anti-repainting architecture
Performance:
Optimized for max_bars_back = 5000
Efficient array management
Built-in function optimization
Memory-conscious data structures
📊 What Makes RVol+ Different?
vs. Standard Volume:
Context-aware (time-of-day matters)
Statistical significance testing
False breakout filtering
vs. Basic RVol:
Z-Score normalization (2-3 sigma detection)
Multi-timeframe confirmation
OBV divergence integration
Sustained volume filtering
Smart visual scaling
vs. Professional Tools:
Free and open-source
Fully customizable
No black-box algorithms
Educational debug logs
💡 Best Practices
Wait for Confirmation - Don't enter on first bar; wait for sustained volume ✓
Combine with Price Action - RVol validates, price structure determines entry
Weekly Context Matters - Blue background = institutional interest
Z-Score is King - Focus on ⚡ alerts for highest probability
Avoid Low Volume Breakouts - Red ⚠️ labels = high failure risk
🎓 Trading Psychology
Volume precedes price. When RVol+ shows:
High RVol + Rising OBV = Accumulation before breakout
High RVol at Resistance = Test of conviction
Low RVol on Breakout = Retail-driven (fade candidate)
Z-Score > 3 = Potential "whale" positioning
📝 Credits
Based on the time-based RVol concept from /u/HurlTeaInTheSea, enhanced with:
Statistical analysis (z-scores, percentiles)
Multi-timeframe integration
OBV divergence detection
Professional-grade visualization
Swing trading optimization
🔧 Version History
v2.0 - Enhanced Edition
Added Z-Score analysis
Multi-timeframe volume context
OBV divergence detection
Breakout confirmation system
Smart color coding
Customizable stats table
Debug logging mode
Performance optimizations
📚 Learn More
For optimal use with swing trading:
Combine with support/resistance levels
Watch for volume clusters in consolidation
Use weekly timeframe for trend confirmation
Monitor OBV divergence for early warnings
⚠️ Disclaimer
This indicator is for educational purposes. Volume analysis is one component of trading decisions. Always use proper risk management, consider multiple timeframes, and validate signals with price structure. Past performance does not guarantee future results.
🚀 Getting Started
Add indicator to chart
Adjust "N Day Average" to your preference (5-10 days typical)
Position stats table to avoid overlap
Enable features you want to monitor
Watch for 🚀 breakout confirmations!
Happy Trading! 📈

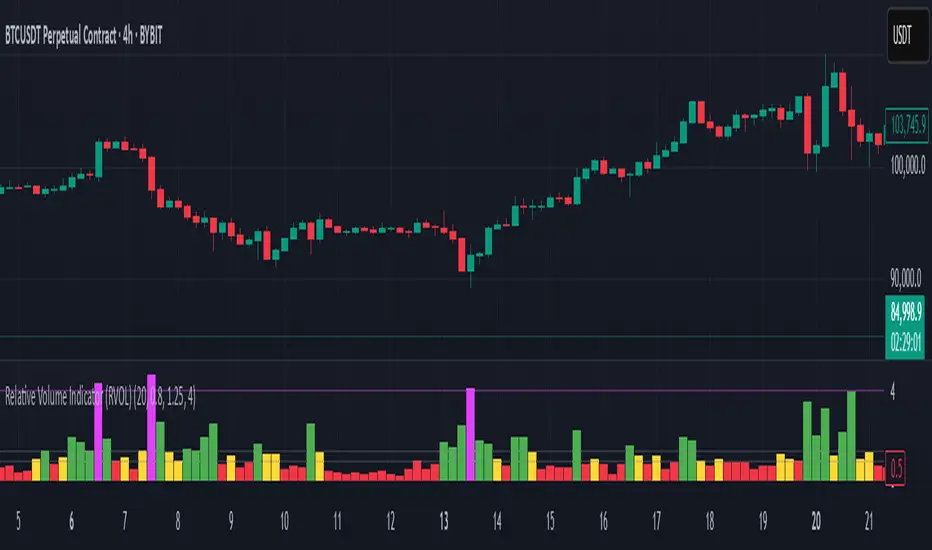
Relative Volume Indicator (RVOL)Relative Volume Indicator (RVOL)
The Relative Volume Indicator (RVOL) helps traders identify unusual volume activity by comparing the current volume to the average historical volume. This makes it easier to spot potential breakouts, reversals, or significant market events that are accompanied by volume confirmation.
What This Indicator Shows
This indicator displays volume as a multiple of average volume, where:
- 1.0x means 100% of average volume
- 2.0x means 200% of average volume (twice the average)
- 0.5x means 50% of average volume (half the average)
Color Coding
The volume bars are color-coded based on configurable thresholds:
- Red: Below average volume (< Average Volume Threshold)
- Yellow: Average volume (between Average Volume and Above Average thresholds)
- Green: Above average volume (between Above Average and Extreme thresholds)
- Magenta: Extreme volume (> Extreme Volume Threshold)
Horizontal Reference Lines
Three dotted horizontal reference lines help you visualize the thresholds:
- Lower gray line: Average Volume Threshold (default: 0.8x)
- Upper gray line: Above Average Threshold (default: 1.25x)
- Magenta line: Extreme Volume Threshold (default: 4.0x)
How To Use This Indicator
1. Volume Confirmation: Use green bars to confirm breakouts or trend changes - stronger moves often come with above-average volume.
2. Low Volume Warning: Red bars during price movements may indicate weak conviction and potential reversals.
3. Extreme Volume Events: Magenta bars (extreme volume) often signal major market events or potential exhaustion points that could lead to reversals.
4. Volume Divergence: Look for divergences between price and volume - for example, if price makes new highs but volume is decreasing (more yellow/red bars), the move may be losing strength.
Settings Configuration
- Average Volume Lookback Period: Number of bars used to calculate the average volume (default: 20)
- Average Volume Threshold: Volume below this level is considered below average (default: 0.8x)
- Above Average Threshold: Volume above this level is considered above average (default: 1.25x)
- Extreme Volume Threshold: Volume above this level is considered extreme (default: 4.0x)
- Colors: Customize colors for each volume category
Important Note: Adjust threshold values only through the indicator settings (not in the Style tab). Changing values in the Style tab will not adjust the coloring of the volume bars.
Adjust these settings based on the specific asset being analyzed and your trading timeframe. More volatile assets may require higher thresholds, while less volatile ones might need lower thresholds.
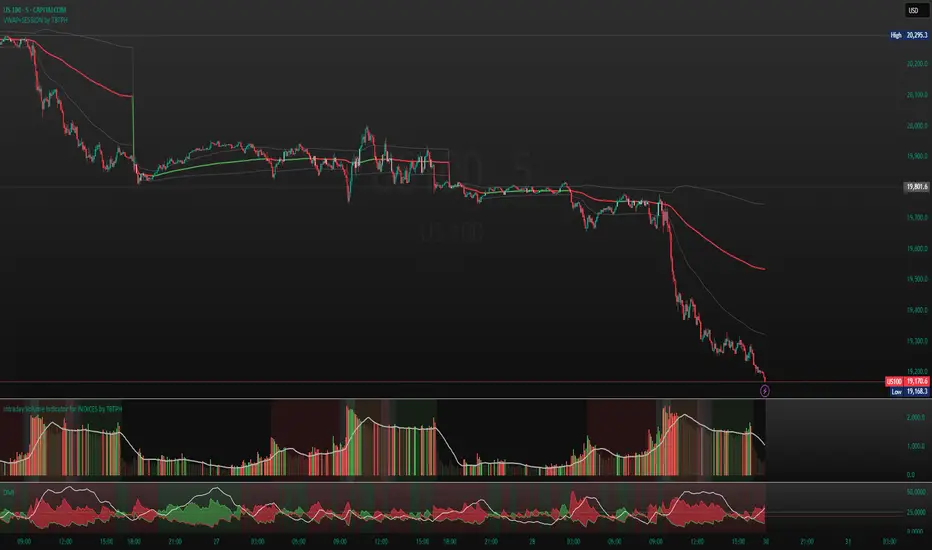
Intraday Volume Indicator for INDICES by TBTPH Pine Script code for an intraday volume indicator with session and lunch break highlights looks great! Here’s a summary of what each part of the script does:
Indicator Settings:
The indicator is set to show on a separate pane (overlay=false).
The SMA Length is adjustable with an input box (default of 20).
Volume and SMA Calculation:
You calculate the Simple Moving Average (SMA) of the volume over the selected length.
The volume color is determined based on whether the close price is higher or lower than the previous close and if the volume is above or below the SMA.
Volume Plot:
Volume is plotted as a histogram with different colors to indicate if the volume is higher or lower than the SMA.
You plot the SMA of the volume with an orange line for easier comparison.
Background Color:
You set a light gray background color to give a subtle contrast.
NYSE and LSE trading sessions are highlighted with green and blue, respectively.
Lunch break periods are highlighted with a white background for both exchanges.
Here are a couple of improvements or suggestions you might consider:
Session Time Overlap Handling:
If the script is applied to a chart where both NYSE and LSE data is visible, they may overlap depending on the time zone of your chart. Ensure the session times align with the active market's timezone, especially if you are using a chart with a different timezone setting.
Color Customization:
The color scheme for bullish/bearish volume could be enhanced further. For example, you could introduce more transparency for low-volume periods to make the histogram appear more subtle during less active trading times.
Handling Different Time Zones:
If your chart is not in the "America/New_York" or "GMT" time zone, be mindful of the session times. The timestamp function depends on the chart’s time zone, so ensuring you're adjusting for different markets is key.
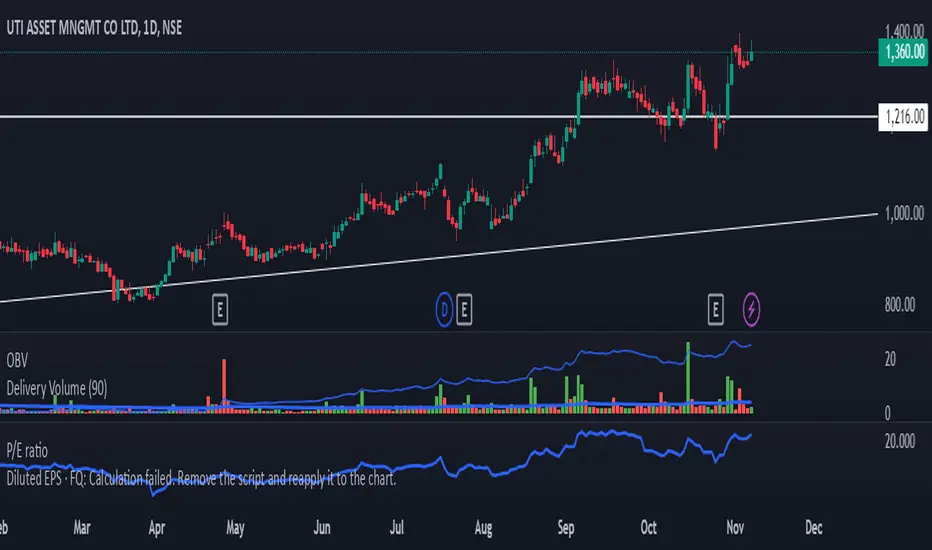
Delivery Volume IndicatorDelivery Volume Indicator
The Delivery Volume Indicator is designed to provide insights into trading volume specifically delivered on a daily basis, scaled in lakhs (hundreds of thousands) for ease of interpretation. This tool can be especially useful for traders looking to monitor delivery-based volume changes and trends, as it helps to distinguish between bullish and bearish volume flows.
Key Features:
Daily Volume in Lakhs: The indicator pulls daily volume data and scales it to lakhs for more readable values.
Bullish/Bearish Color Coding: The indicator color-codes volume columns to reflect market sentiment. Columns are displayed in green when the price closes higher than it opens (bullish) and in red when the price closes lower than it opens (bearish).
Adjustable EMA: A customizable Exponential Moving Average (EMA) is applied to the scaled delivery volume. The EMA line, displayed in blue, helps smooth out volume trends and allows traders to adjust the period for personal strategy alignment.
How to Use:
Observe the delivery volume changes to track market sentiment over time. Increased bullish delivery volume could indicate accumulating interest, while increased bearish delivery volume might suggest distribution.
Utilize the EMA to identify longer-term trends in delivery volume, with shorter EMA periods for quick volume shifts and longer periods for gradual trend changes.
This indicator is ideal for traders seeking volume-based insights that align closely with price action.
Multi Exchange Relative Volume IndicatorThe Multi Exchange Relative Volume indicator is a powerful tool designed to visualize the relative volume across different exchanges. This is particularly useful for decentralized securities like forex and crypto, where volume data is spread across multiple markets. By aggregating volume data from various exchanges, this indicator helps traders identify trends, spot unusual volume spikes, and make informed trading decisions.
Key Features:
Multi-Exchange Volume Aggregation: Collects and sums the volume data from up to five different exchanges, offering a holistic view of the market activity.
Customizable Inputs: Easily select and configure up to five different exchanges of your choice to monitor their volume activity.
Relative Volume Visualization: Compares the aggregated volume against historical averages to highlight periods of high or low volume.
Color-Coded Volume Bars: Volume bars are color-coded based on the relative volume percentage, providing quick visual cues:
- Red for volume 1.0-1.5 times the average
- Orange for volume 1.5-2.0 times the average
- Green for volume 2.0-3.0 times the average
- Yellow for volume greater than 3.0 times the average
- Grey for below average volume
Dynamic Lookback Period: Adjust the lookback period to suit your trading style and timeframe, allowing for flexible analysis.
Exponential Moving Average (EMA): Includes an EMA of volume to smooth out short-term fluctuations and highlight longer-term trends.
Scalable Layout: The scaling factor allows you to zoom in or out, adjusting the visual representation of volume data to better fit your chart.
Usage:
Configure Exchanges: Select up to five exchanges you want to monitor from the input settings.
Set Lookback Period and Bars: Customize the lookback period and the number of bars to consider for calculating average volume.
Adjust Scaling: Use the scaling factor to zoom in or out on the volume data for better visualization.
Interpret Volume Bars: Analyze the color-coded volume bars to identify significant changes in volume and potential trading opportunities.
Monitor EMA: Use the EMA line to understand the trend and smooth out noise from the volume data.
The Multi Exchange Relative Volume indicator is an essential tool for traders who want to gain deeper insights into market activity across multiple exchanges. By visualizing relative volume, it helps in identifying potential breakout or breakdown points, enhancing your trading strategy.

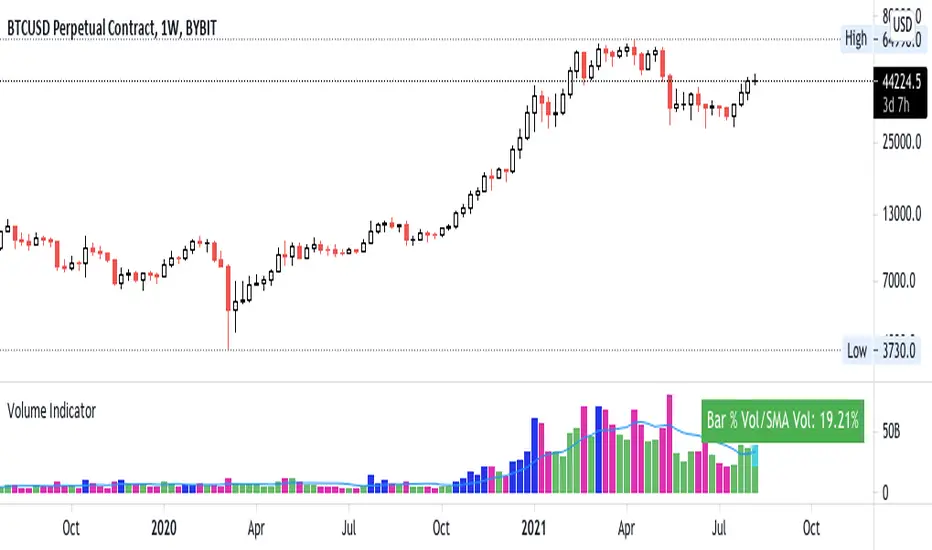
Best Volume Indicator - BTCIn order to make more sense of trading volume in crypto …
Based on the Better Volume Indicator (curtesy of Emini-Trading (emini-watch.com) and the TradingView Adaption by LazyBear ().
My tweaks/adaptations:
- altered the calculation of low volume (c11) in the LB adaptation since it represents the original code better (in my opinion)
- takes volume of multiple exchanges into consideration
- added standard-deviation bands in order to identify peak amount of trading volume
- added three EMA's in order to assess the amount of trading volume even better
- changed the color coding of the original Better Volume Indicator (my preference)
volume climax up = green (instead of red)
volume climax down = red (instead of white)
low volume = yellow
churn = blue (instead of green)
climax + churn = purple
"normal" volume = gray (instead of cyan)

S&P Merval Index Volume Indicator (Shares, ARS, U$S CCL GGAL)S&P Merval Index Volume Indicator (Shares, ARS, U$S CCL GGAL)
◾ This indicator reflects a close estimate of the traded volume in the S&P Merval Index BCBA:IMV for nominal shares, traded money in ARS & USD using a financial FX rate.
◾ The constituents of the index "must meet minimum size and liquidity requirements" as it is been declared by S&P Dow Jones Indexes. On this version of the indicator were reflected the current set of stocks for the Index as of Monday, July 27, 2020 for actual and historical sessions.
◾ Eventually, there could be changes in consitutents as per the S&P Dow Jones Indexes classification and re-balance that will be reflected on this script or a new one.
◾ Aggregated volume of nominal shares for each of the stocks constitutents is multiplied by their closing prices to estimates the effective volume in ARS & adjusted by the FX rate with "Contado con Liquidación" FX rate closing session price.
◾ It serves as a dynamical volume indicator available for standard and customized timeframes. Provides an assertive look over trading activity which allows the analyst to measure effectively either resistance or support zones in Bull / Flat or Bear markets.
◾ Output of 10 trading days of effective volume was cross-checked with "IAMC Informe diario" www.iamc.com.ar the official daily report by the exchange ByMA (Bolsas y Mercados de Argentina).
1) Trading Sessions Dates
7/27/20; 7/23/20; 7/22/20; 7/21/20; 7/20/20; 7/16/20; 7/15/20; 7/14/20; 7/13/20
2) IAMC Informe Diario S&P Merval Index Effective volume (ARS) for each of 1)
$1309.4M; $1999.3M; $1691.1M; $1585.6M; $949.7M; $818.6M; $1010.4M; $962.3M; $1515.7M
3) Pine indicator S&P Merval Index Effective volume (ARS) for each 1)
$1294.6M; $1911.7M; $1691.3M; $1526.6M; $901.4M; $796.7M; $961.9M; $939.7M; $1404.7 M
4) Variance 3) | 2)
-1%; -4%; 0%; -4%; -5%; -3%; -5%; -2%; -7%
Average Deviation: -4%
Standard Deviation: 2%
* This quick analysis depicts that effective volume displayed may (or not) have a non significance variance over the real data reported by the National Exchange due to the script calculation.
* Thanks to Alan who helped me a lot with the code!

Relative Volume Indicator (RVOL)Relative Volume Indicator (RVOL) is a powerful tool designed for intraday traders who want to quickly identify key areas of interest based on relative volume activity.
This indicator compares the current candle’s volume with the historical average volume over a customizable lookback period (default is 20). It highlights when volume is:
🔴 Below average
🟡 Average
🟢 Above average
🟣 Extremely high
⚙️ Customizable Settings:
Lookback period for average volume
Volume thresholds (average, above average, extreme)
Custom colors for each volume zone
🎯 Best suited for:
Scalping strategies
Breakout confirmation
Volume-based entries at key support/resistance levels
Spotting unusual or algorithmic trading activity
📈 Works across all timeframes.
🎨 Fully customizable from the settings panel.
🔔 Alerts coming in future versions.

Color Coded Volume IndicatorColor Coded Volume Indicator
Overview
Splits each bar’s total volume into estimated buy-side vs. sell-side components and displays them as stacked two-tone columns (red = sell, green = buy). Axis labels and tooltips use “K”/“M” formatting.
Features
Stacked Two-Tone Columns
Red Base : estimated sell volume (50% opacity)
Green Top : remaining buy volume (50% opacity)
Automatic K/M Formatting via format=format.volume
Zero Baseline for clean reference at zero
Positive-Only Bars (no negatives)
How It Works
True-Range Guard
Skips bars where high == low to avoid divide-by-zero.
Volume Split
BuyVol = Volume × (Close − Low) / (High − Low)
SellVol = Volume × (High − Close) / (High − Low)
Both series clamped ≥ 0.
Layered Plot
Draw semi-transparent green at full height, then overlay red sell portion.
Usage
Open TradingView’s Pine Editor
Paste in the full script
Click “Save & Add to Chart”
In the Publish dialog, title it “Color Coded Volume Indicator” and paste this description.
Interpretation
Green-dominant bars → strong buying pressure
Red-dominant bars → strong selling pressure
Equal halves → balanced activity

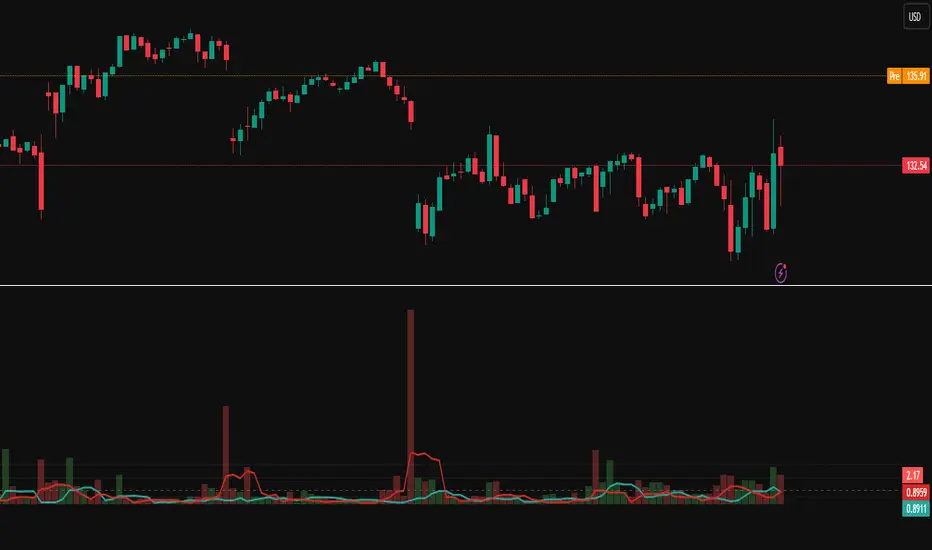
FeraTrading Relative Volume IndicatorThis FeraTrading Relative Volume Indicator measures relative volume pressure by comparing buying and selling activity, smoothed using a configurable average. It helps traders identify volume-driven momentum shifts, offering dynamic buy and sell signals based on weighted pressure values.
Key Features:
📈 Relative Volume (RV) Line: Measures net buying/selling pressure using volume-weighted price action.
🟢 Buy Signals: Triggered when RV crosses above a smoothed moving average (SMA 1).
🔴 Sell Signals (optional): Triggered when RV crosses below a separate SMA (SMA 2).
🔍 Customizable Inputs: Adjust smoothing length, weight, and signal sensitivity.
🕯️ Weighted Candles (optional): Visualizes custom OHLC based on volume-weighted volatility.
📊 Two SMAs: Use separate or combined moving averages to analyze trends in pressure.
🎨 Flexible Styling: Customize line and signal colors to match your chart setup.
Use Cases:
Spotting accumulation/distribution phases
Timing entries during volume surges
Confirming breakout momentum with underlying volume pressure
This indicator was developed by FeraTrading to visualize relative volume pressure.

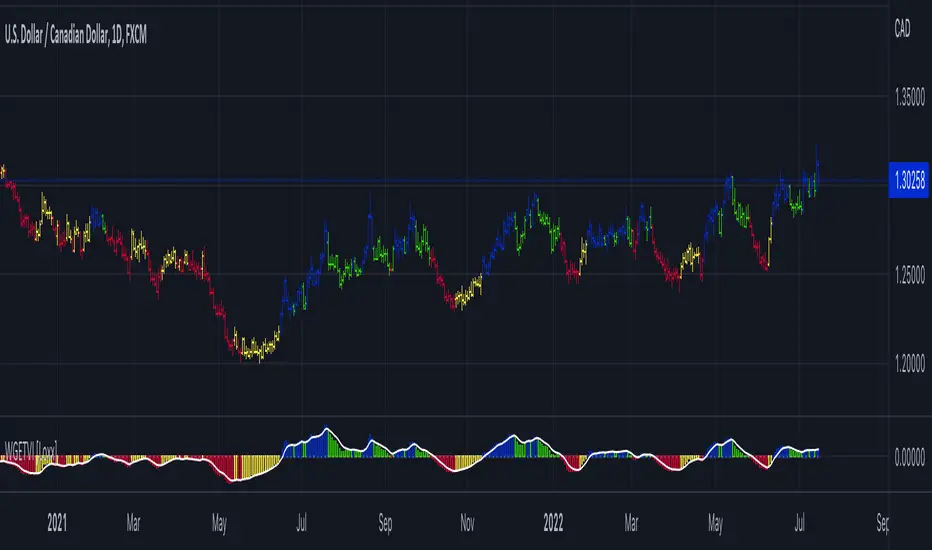
William Blau Ergodic Tick Volume Indicator (TVI) [Loxx]William Blau Ergodic Tick Volume Indicator (TVI) is a volume/volatility indicator that is used for finding reversals in price movement
What is William Blau Ergodic Tick Volume?
This is one of the techniques described by William Blau in his book "Momentum, Direction and Divergence" (1995). If you like to learn more, we advise you to read this book. His book focuses on three key aspects of trading: momentum, direction and divergence. Blau, who was an electrical engineer before becoming a trader, thoroughly examines the relationship between price and momentum in step-by-step examples. From this grounding, he then looks at the deficiencies in other oscillators and introduces some innovative techniques, including a fresh twist on Stochastics. On directional issues, he analyzes the intricacies of ADX and offers a unique approach to help define trending and non-trending periods.
William Blau's definition of TVI ergodicity is that the indictor is ergodic when periods are set to 32, 5, 1, and the signal is set to 5. Other combinations are not ergodic, according to Blau.
How to use TVI
TVI bar color change is a signal to enter the market. When the TVI changes from yellow to red, it is a signal to buy and if the TVI bar changes from blue to green, it is a signal to sell.
Just like the MACD and TRIX, the zero line on the indicator determines market sentiment and trend. If the TVI bars are above the zero line it's bullish and if the TVI bars are below the zero line the trend is bearish. Zero line crosses can be used to determine continuation and trend entries as well.
Included
Bar coloring
35+ moving averages for both TVI and the signal
Options Volume Indicator
Volume Indicator for Option Trading, it is a simple indicator based on Relative Strength Index. There are two horizontal lines are mention 10 and -10, if bar crossed above the (Line 10) then go for buy and when Bar cross under (Line -10) go for sell side.
If Bar Color changed to Respective color of the previous bar i.e. color gets darker then you can exit/ trail SL there because it overbought / Oversold position and vice versa for Sell Side.
this volume indicator works on any Script.
The Black Floating Line indicates the Average volume

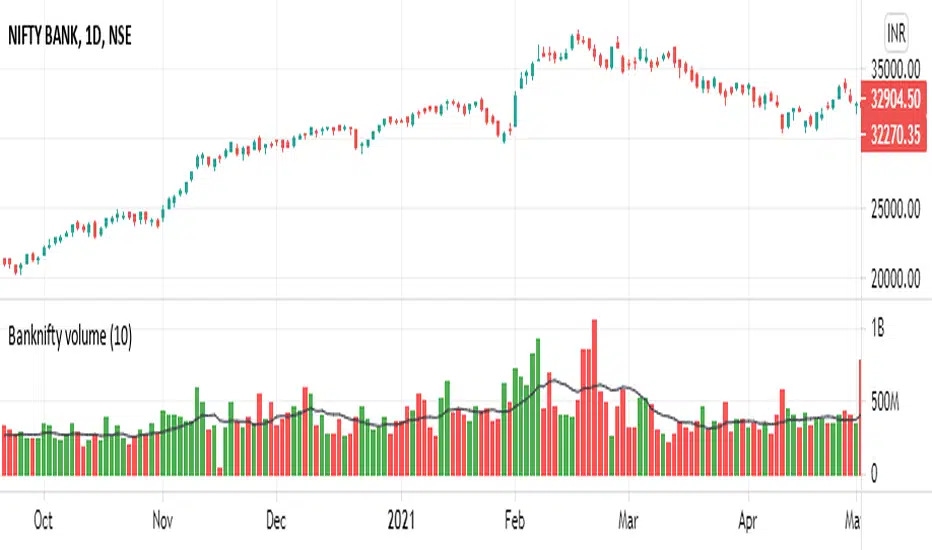
BankNifty Volume Indicator
KEY TAKEAWAYS
- Uses BankNifty Index Stocks Volume.
- BankNifty Volume Indicator is created by adding all BankNifty Stocks Volume together.
- BankNifty Volume will be an important indicator in BankNifty Index technical analysis because it is used to measure the relative significance of a market move.
- The higher the volume during a Banknifty index price move, the more significant the move and the lower the volume during a Banknifty index price move, the less significant the move.
- Moving Average is also added.
NSE:BANKNIFTY