Volume Pressure OscillatorThe Volume Pressure Oscillator (VPO) is a momentum-based indicator that measures the directional pressure of cumulative volume delta (CVD) combined with price efficiency. It oscillates between 0 and 100, with readings above 50 indicating net buying pressure and readings below 50 indicating net selling pressure.
The indicator is designed to identify the strength and sustainability of volume-driven trends while remaining responsive during consolidation periods.
How the Indicator Works
The VPO analyzes volume flow by examining price action at lower timeframes to build a Cumulative Volume Delta (CVD). For each chart bar, the indicator looks at intrabar price movements to classify volume as either buying volume or selling volume. These classifications are accumulated into a running total that tracks net directional volume.
The indicator then measures the momentum of this CVD over both short-term and longer-term periods, providing responsiveness to recent changes while maintaining awareness of the broader trend. These momentum readings are normalized using percentile ranking, which creates a stable 0-100 scale that works consistently across different instruments and market conditions.
A key feature is the extreme zone persistence mechanism. When the indicator enters extreme zones (above 80 or below 20), it maintains elevated readings as long as volume pressure continues in the same direction. This allows the VPO to stay in extreme zones during strong trends rather than quickly reverting to neutral, making it useful for identifying sustained volume pressure rather than just temporary spikes.
What Makes This Indicator Different
While many indicators measure volume or volume delta, the VPO specifically measures how aggressively CVD is currently changing and whether that pressure is being sustained. It's the difference between knowing "more volume has accumulated on the buy side" versus "buying pressure is intensifying right now and shows signs of continuation."
1. Focus on CVD Momentum, Not CVD Levels
Most CVD indicators display the cumulative volume delta as a line that trends up or down indefinitely. The VPO is fundamentally different - it measures the slope of CVD rather than the absolute level. This transforms CVD from an unbounded cumulative metric into a bounded 0-100 oscillator that shows the intensity and direction of current volume pressure, not just the historical accumulation.
2. Designed to Stay in Extremes During Trends
Unlike traditional oscillators that treat extreme readings (above 80 or below 20) as overbought/oversold reversal signals, the VPO is engineered to oscillate within extreme zones during strong trends. When sustained buying or selling pressure exists, the indicator remains elevated (e.g., 80-95 or 5-20) rather than quickly reverting to neutral. This makes it useful for trend continuation identification rather than exclusively for reversal trading.
3. Percentile-Based Normalization
The VPO uses percentile ranking over a lookback window, which provides consistent behavior across different instruments, timeframes, and volatility regimes without constant recalibration.
4. Dual-Timeframe Momentum Synthesis
The indicator simultaneously considers short-term CVD momentum (responsive to recent changes) and longer-term CVD momentum (tracking trend direction), weighted and combined with a slow-moving trend bias. This multi-timeframe approach helps it stay responsive in ranging markets while maintaining context during trends.
How to Use the Indicator
Understanding the Zones:
80-100 (Strong Buying Pressure): CVD momentum is strongly positive. In trending markets, the indicator oscillates within this zone rather than immediately reverting to neutral. This suggests sustained accumulation and trend continuation probability.
60-80 (Moderate Buying): Positive volume pressure but not extreme. Suitable for identifying pullback entry opportunities within uptrends.
40-60 (Neutral Zone): Volume pressure is balanced or unclear. No strong directional edge from volume. Often seen during consolidation or trend transitions.
20-40 (Moderate Selling): Negative volume pressure developing. May indicate distribution or downtrend continuation setups.
0-20 (Strong Selling Pressure): CVD momentum is strongly negative. During downtrends, sustained readings in this zone suggest continued distribution and downside follow-through probability.
Practical Applications:
Trend Confirmation: When price makes new highs/lows, check if VPO confirms with similarly elevated readings. Divergences (price making new highs while VPO fails to reach prior highs) may indicate weakening momentum.
Range Trading: During consolidation, the VPO typically oscillates between 30-70. Readings toward the low end of the range (30-40) may present accumulation opportunities, while readings at the high end (60-70) may indicate distribution zones.
Extreme Persistence: If VPO reaches 90+ or drops below 10, this indicates exceptional volume pressure. Rather than fading these extremes immediately, monitor whether the indicator stays elevated. Sustained extreme readings suggest strong trend continuation potential.
Context with Price Action: The VPO is most effective when combined with price action or other orderflow indicators. Use the indicator to gauge whether volume is confirming or contradicting.
What the Indicator Does NOT Do:
It does not provide specific entry or exit signals
It does not predict future price direction
It does not guarantee profitable trades
It should not be used as a standalone trading system
Settings Explanation
Momentum Period (Default: 14)
This parameter controls the lookback period for CVD rate-of-change calculations.
Lower values (5-10): Make the indicator more responsive to recent volume changes. Useful for shorter-term trading and more active oscillation. May produce more whipsaws in choppy markets.
Default value (14): Provides balanced responsiveness while filtering out most noise. Suitable for swing trading and daily timeframe analysis.
Higher values (20-50): Create smoother readings and focus on longer-term volume trends. Better for position trading and reducing false signals, but with slower reaction to genuine changes in volume pressure.
Important Notes:
This indicator requires intrabar data to function properly. On some instruments or timeframes where lower timeframe data is not available, the indicator may not display.
The indicator uses request.security_lower_tf() which has a limit of intrabars. On higher timeframes, this provides extensive history, but on very low timeframes (<1-minute charts), the indicator may only cover limited historical bars.
Volume data quality varies by exchange and instrument. The indicator's effectiveness depends on accurate volume reporting from the data feed.
Cerca negli script per "volume"

Volume Profile Area [BigBeluga]🔵 OVERVIEW
The Volume Profile Area is an advanced profiling tool that calculates and visualizes the value area within a chosen period’s volume distribution. It first builds a main profile of the entire range, then constructs a secondary profile inside the defined value area, allowing traders to examine market balance and key trading zones in greater detail.
🔵 CONCEPTS
Volume Profile – Distributes traded volume across price levels to highlight areas of market activity.
Value Area (VA) – The price range containing a chosen percentage of total volume (commonly 50–70%).
Point of Control (PoC) – The price level with the highest traded volume, often acting as a magnet for price.
Nested Profiles – A profile inside the VA adds a second layer of precision, showing where liquidity clusters within the “fair value” zone.
🔵 FEATURES
Main Profile – Full distribution of volume over the selected lookback period.
Secondary Profile – Built only inside the VA of the main profile, highlighting intrabalance structure.
Customizable PoC Selection – Choose between showing the PoC of the
Main Profile ,
the Area Profile ,
their Average ,
or None .
Dynamic Value Area Levels – Automatically plots VAL (Value Area Low) and VAH (Value Area High) with labels.
Overlay Toggles – Show/hide range extremes, VA lines, or PoCs for a cleaner chart view.
Visual Profiles – Main profile shaded in darker blue; the VA profile inside is lighter for clear separation.
Automatic Scaling – Profiles adapt to period highs/lows and auto-adjust bins for consistent resolution.
Volume Labels – PoCs can display traded volume, giving numeric confirmation of liquidity concentration.
🔵 HOW TO USE
Set the Period to define how many bars to include in the main profile.
Adjust the Value Area % to control how much volume defines the VA (e.g., 50% by default).
Pick your PoC option: Main , Area , or Average , depending on focus.
Use VAH/VAL lines as support/resistance levels where most trading occurred.
Compare reactions at Main vs VA PoC levels to spot potential breakouts or mean reversions.
🔵 CONCLUSION
The Volume Profile Area extends traditional profiling by nesting a secondary VA profile inside the main distribution. This dual-layer approach reveals not just where the market was active overall, but where liquidity concentrated within the “fair value” zone—powerful for refining entries, exits, and risk placement across intraday and swing horizons.

Volume Heat ZoneVolume Zones Indicator
This Pine Script creates a volume-based zone analysis tool for TradingView.
Function:
Divides the price range (high to low) into 20 levels over a 100-candle lookback period
Measures volume activity at each price level
Draws boxes at levels with above-average volume (1.5x threshold)
Key Settings:
Lookback Period (100): Number of candles analyzed
Price Levels (20): Price range subdivisions
Volume Threshold (1.5): Minimum volume multiplier for zones
Candle Offset (1): Excludes current candle from analysis
Projection Bars (10): Extends boxes 10 bars into the future
How it works:
The indicator identifies price levels where significant trading volume occurred historically, highlighting potential support/resistance zones. Boxes are redrawn on each confirmed candle, showing dynamic volume concentration areas that traders can use for entry/exit decisions.

Volumetric Tensegrity🧮 Volumetric Tensegrity unifies two of the Leading Indicator suite's critical engines — ZVOL ( volume anomaly detection ) and OBVX ( directional conviction ). Originally designed as a structural economizer for traders navigating strict indicator limits (e.g. < 10 slots per chart), it was forced to evolve beyond that constraint simply to fulfill it, albeit with a difference. The fatal flaw of traditional fusion, where two metrics are blended mathematically, is that they lose scale integrity (i.e. meaning). VTense encodes optical tensegrity to scale the amplitude of the ZVOL histogram and the slope of the OBVX spread independently, so that expansion and direction may coexist without either dominating the frame.
🧬 Tensegrity , by definition, is an intelligent design principle where elements in compression are suspended within a network of continuous tension, forming a stable, self-supporting structure . Originally conceived in esoteric biomorphology (c.f. Da Vinci, Snelson, Casteneda), tensegrity balances force through opposition, not rigidity. Applied to financial markets, Volumetric Tensegrity captures this same principle: price compresses, volume expands, conviction builds or fades — yet structure holds through the interplay. The result is not a prediction engine, but a pressure field — one that visualizes where structure might bend, break, or rebound based on how volume breathes.
🗜️ Rather than layering multiple indicators and consuming precious chart space, VTense frees up room for complementary overlays like momentum mapping, liquidity tiers, or volatility phase detection — making it ideal for modular traders operating in tight technical real estate.
🧠 Core Logic - VTense separates and preserves two essential structural forces:
• ZVOL Histogram : A Z-score-based expansion map that measures current volume deviation from its historical average. It reveals buildup zones, dormant stretches, and breakout pressure — regardless of price behavior.
• OBVX Spread : A directional conviction curve that tracks the difference between On-Balance Volume and its volume-weighted fast trend. It shows whether the crowd is leaning in (accumulation/distribution) or backing off.
🔊 ZVOL controls the amplitude of the histogram, while OBVX controls the curvature and slope of the spread. Without sacrificing breathing behavior or analytical depth, VTense provides a compact yet dynamic lens to track both expansion pressure and directional bias within a single footprint.
🌊 Volumetric Tensegrity forecasts breakout readiness, trend fatigue, and compression zones by measuring the volatility within volume . Unlike traditional tools that track volatility of price, this indicator reveals when effort becomes unstable — signaling inflection points before price reacts. Designed to decode rhythm shifts at the volume level, it operates as a pre-ignition scanner that thrives on low-timeframe charts (15m and under) while scaling effectively to 1H for validation.
🪖 From Generals to Scouts
👀 When used jointly, ZVOL + OBVX act as the general : deep-field analysts confirming stress, commitment, or exhaustion. VTense , by contrast, functions as a scout — capturing subtle buildup and alignment before structure fully reveals itself. The indicator aims to be a literal vanguard, establishing a position that can be confirmed or flexibly abandoned when the higher authority arrives to evaluate.
🥂 Use the ZVOL + OBVX pair when :
• You need independent axis control and manual dissection
• You’re building long-form confluence setups
• You have more indicator slots than you need
🔎 Use VTense when :
• You need compact clarity across multiple instruments
• You’re prioritizing confluence _detection_ over granular separation
• You’re building efficient multi-layered systems under slot constraints
🏗️ Structural Behavior and Interpretation
🫁 Z VOL Respiration Histogram : Structural Effort vs Baseline
🔵 Compression Coil – volume volatility is low and stable; the market is coiling
🟢 Steady Rhythm – volume is healthy but unremarkable; balanced participation
🟡 Passive/Absorbed Effort – expansion failing to manifest; watch for reversal
🟠 Clean Expansion – actionable volatility rise backed by structure
🔴 Volatile Blowout – chaos, climax; likely end-phase or fakeout
⚖️ ZVOL Respiration measures how hard the crowd is pressing — not just that volume is rising, but how statistically abnormal the surge is. Because it is rescaled proportionally to OBVX, the amplitude of the histogram reflects structural urgency without overwhelming the visual field.
🖐️ OBVX Spread : Real-Time Directional Conviction Behind Price Moves
🔑 The curvature of the spread reveals not just directional bias but crowd temp o: sharp slopes = urgent transitions; gradual slopes = building structural shifts. Curvature is key: sharp OBVX slope = urgency; gentle arcs = controlled drift or indecision.
• Green Rising : Accumulation — upward pressure from real buyers
• Red Falling : Distribution — sell pressure, downward slope
• Flat Curves : Transitional → uncertainty, microstructure digestion
🎭 Synchronized vs Divergent Behavior
⏱️ Synchronized (high-confluence) : often precedes structural breakouts, with internal conviction clearly visible before price resolves.
• ZVOL expands (yellow/orange/red) and OBVX climbs steeply green = strong bullish pressure
• ZVOL expands while OBVX steepens red = growing sell-side intent
🪤 Divergent (conflict tension) : flags potential traps, fakeouts, and liquidity sweeps.
• ZVOL expands sharply, but OBVX flattens or opposes → reactive expansion without crowd commitment
⛔️ Latent Drift + Structural Holding Patterns : tensegrity in action — the market holds tension without directional release.
• ZVOL compresses (blue) + OBVX meanders near zero → structure is resting, building up energy
• After prolonged drift, expect violent asymmetry when balance finally breaks
📚 Phase Interpretation: Dynamic Structural Read
• 1️⃣ Quiet Coil : Histogram flat, OBVX flat → no urgency
• 2️⃣ Initial Pulse : Yellow bars, OBVX slope builds → actionable tension
• 3️⃣ Structural Breath : Synchronized expansion and slope → directional commitment
• 4️⃣ Disagreement : Spike in ZVOL, flattening OBVX → exhaustion risk or false signal
💡 Suggested Use
• Run on 15m charts for breakout anticipation and 1H for validation
• Pair with ZVOL + OBVX to confirm crowd conviction behind the tension phase
• Use as a rhythm filter for the suite's trend indicators (e.g., RDI , SUPeR TReND 2.718 , et. al.)
• Ideal during low-volume regimes to detect pressure buildup before triggers
🧏🏻 Volumetric Tensegrity doesn’t signal. It breathes , and listens to pressure shifts before they speak in price. As a scout, it lets you see structural posture before signals align — helping you front-run resolution with clarity, not prediction.

Volume Profile & Smart Money Explorer🔍 Volume Profile & Smart Money Explorer: Decode Institutional Footprints
Master the art of institutional trading with this sophisticated volume analysis tool. Track smart money movements, identify peak liquidity windows, and align your trades with major market participants.
🌟 Key Features:
📊 Triple-Layer Volume Analysis
• Total Volume Patterns
• Directional Volume Split (Up/Down)
• Institutional Flow Detection
• Real-time Smart Money Tracking
• Historical Pattern Recognition
⚡ Smart Money Detection
• Institutional Trade Identification
• Large Block Order Tracking
• Smart Money Concentration Periods
• Whale Activity Alerts
• Volume Threshold Analysis
📈 Advanced Profiling
• Hourly Volume Distribution
• Directional Bias Analysis
• Liquidity Heat Maps
• Volume Pattern Recognition
• Custom Threshold Settings
🎯 Strategic Applications:
Institutional Trading:
• Track Big Player Movements
• Identify Accumulation/Distribution
• Follow Smart Money Flow
• Detect Institutional Trading Windows
• Monitor Block Orders
Risk Management:
• Identify High Liquidity Windows
• Avoid Thin Market Periods
• Optimize Position Sizing
• Track Market Participation
• Monitor Volume Quality
Market Analysis:
• Volume Pattern Recognition
• Smart Money Flow Analysis
• Liquidity Window Identification
• Institutional Activity Cycles
• Market Depth Analysis
💡 Perfect For:
• Professional Traders
• Volume Profile Traders
• Institutional Traders
• Risk Managers
• Algorithmic Traders
• Smart Money Followers
• Day Traders
• Swing Traders
📊 Key Metrics:
• Normalized Volume Profiles
• Institutional Thresholds
• Directional Volume Split
• Smart Money Concentration
• Historical Patterns
• Real-time Analysis
⚡ Trading Edge:
• Trade with Institution Flow
• Identify Optimal Entry Points
• Recognize Distribution Patterns
• Follow Smart Money Positioning
• Avoid Thin Markets
• Capitalize on Peak Liquidity
🎓 Educational Value:
• Understand Market Structure
• Learn Volume Analysis
• Master Institutional Patterns
• Develop Market Intuition
• Track Smart Money Flow
🛠️ Customization:
• Adjustable Time Windows
• Flexible Volume Thresholds
• Multiple Timeframe Analysis
• Custom Alert Settings
• Visual Preference Options
Whether you're tracking institutional flows in crypto markets or following smart money in traditional markets, the Volume Profile & Smart Money Explorer provides the deep insights needed to trade alongside the biggest players.
Transform your trading from retail guesswork to institutional precision. Know exactly when and where smart money moves, and position yourself ahead of major market shifts.
#VolumeProfile #SmartMoney #InstitutionalTrading #MarketAnalysis #TradingView #VolumeAnalysis #CryptoTrading #ForexTrading #TechnicalAnalysis #Trading #PriceAction #MarketStructure #OrderFlow #Liquidity #RiskManagement #TradingStrategy #DayTrading #SwingTrading #AlgoTrading #QuantitativeTrading

Volume with EMA and Coloring RulesSummary
This indicator plots the market’s volume as a histogram in a separate panel (not overlaid on the main price chart). An EMA (Exponential Moving Average) is then calculated based on the volume. The color of each volume bar switches dynamically:
• Blue when the bar’s volume is higher than the EMA
• White when the bar’s volume is lower than or equal to the EMA
This simple visual cue allows you to quickly see if the market’s current volume is above or below its average trend.
How to Use
1. Add to Chart
Apply the indicator to your TradingView chart, and it will open in a separate panel beneath the price.
2. Adjust EMA Length
Modify the “EMA Length” to control how quickly the average volume adapts to changes.
3. Interpretation
• Blue bars may indicate stronger-than-usual participation.
• White bars indicate volume is relatively lower compared to its recent average.
This indicator provides an at-a-glance way to see if trading activity is intensifying or easing, which can be paired with other technical or fundamental tools to help confirm market shifts or potential opportunities.

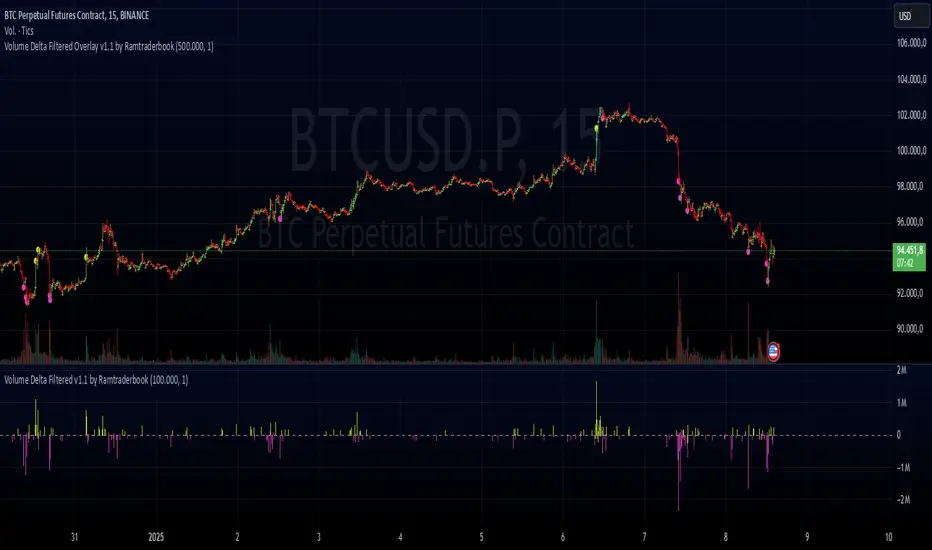
Volume Delta Filtered Overlay v1.1 by RamtraderbookVolume Delta Filtered Overlay v1.1 by Ramtraderbook
This indicator visually displays the volume delta directly on the price chart using colored circles. Its main goal is to highlight significant changes in the volume delta, categorizing them by direction and magnitude.
How It Works
1. Volume Delta Calculation
- Measures the difference between buying and selling volume on a lower time frame.
2. Threshold Filter
- Only displays data if the delta exceeds a minimum threshold set by the user.
3. Colors by Direction
- Bullish color: If the delta is positive (more buying).
- Bearish color: If the delta is negative (more selling).
4. Circle Placement
- Circles are placed above the candle for a positive delta and below the candle for a negative delta.
Customizable Inputs
- Delta Threshold: Defines the minimum delta value that will be plotted.
- Customizable Colors: Allows you to set different colors for positive and negative delta circles.
- **Lower Time Frame**: Scans data on a lower time frame for greater accuracy.
Important Note on Data
TradingView does not handle market depth data such as order book information. The volume delta calculation is an approximation based on the asset’s volume and price behavior. This means it does not precisely reflect the actual flow of buy or sell orders in the market, but rather an estimate derived from available data.
Conclusion
The **Volume Delta Filtered Overlay v1.1 by Ramtraderbook** is a visual tool that helps quickly identify significant buy or sell volume movements, making it ideal for strategies that rely on order flow analysis. However, it is recommended to combine it with other tools for a more comprehensive analysis.

Volume Delta Filtered v1.1 by RamtraderbookIndicator Explanation: Volume Delta_RTB (Filtered)
General Description
The Volume Delta_RTB (Filtered) indicator is designed to analyze the volume delta of a financial asset and highlight only significant changes based on a configured threshold. This indicator is useful for detecting moments when buying volume exceeds selling volume (or vice versa), providing a clear view of market pressure.
What is Volume Delta?
Volume delta measures the difference between buying and selling volume over a given time period. A positive delta indicates that buying prevails over selling, while a negative delta indicates the opposite.
Indicator Inputs
The indicator has several customizable parameters to suit the user’s needs:
1. Volume Delta Threshold
- Allows you to set a minimum volume delta value.
- Only indicator values that exceed this absolute delta threshold will be displayed.
- Default value: 100,000.
2. Use of a Lower Time Frame
- Option to analyze data from a lower time frame than the main chart.
Operating Logic
1. Selection of the Lower Time Frame
- The indicator scans data from a lower time frame to accurately calculate the volume delta.
- By default, it automatically selects an appropriate lower time frame, though it can be set manually.
2. Calculation of Volume Delta
- Using the `ta.requestVolumeDelta` function, the indicator calculates:
- Volume delta at the start of the period (`openVolume`).
- Maximum delta (`maxVolume`).
- Minimum delta (`minVolume`).
- Last recorded delta (`lastVolume`).
3. Filtering Values
- If the absolute value of `lastVolume` (the last volume delta) is below the configured threshold (`deltaThreshold`), the data will not be displayed on the chart.
- This allows the indicator to highlight only significant movements, avoiding unnecessary noise.
4. Visualization
- Volume delta is represented by candles to facilitate interpretation:
- Yellow candles for positive delta (buying prevails).
- Pink candles for negative delta (selling prevails).
- A horizontal line at `0` serves as a reference.
- Colors can be configured as needed.
5. Data Validation
- If the data provider does not provide volume information for the asset, the indicator will display an error message.
Indicator Advantages
- Efficient Filtering: Focus on the most relevant movements in terms of volume, ignoring small or insignificant values.
- Adaptable: Offers customization options for both the delta threshold and the time frame.
- Clear Visualization: Colored candles make it easier to spot dominant buying or selling trends.
NOTE:
- Estimated Delta Data: Since TradingView does not have access to market depth data or an exact breakdown of buying and selling volume, the delta calculations are approximations based on price and volume behavior.
- Data Provider Dependency: Some assets or instruments may not have volume information available, limiting the indicator’s use.
Volume Volatility and Delta Indicator (HN)This Volume Volatility Indicator with Overall Average from Hossein.N helps you visualize the volatility of volume on different timeframes and compares it to the average volume over a given period. It includes several components:
Volume Volatility Indicator (Blue Line): This shows the volatility of volume relative to its moving average over a specified period. Higher values indicate more volatile trading conditions.
Long-Term Volatility Average (Orange Line): This line shows the moving average of the volume volatility indicator over a longer period. It acts as a benchmark for comparing the current volume volatility with historical trends.
Average Volume on Up Days (Green Line): Displays the average volume on days when the price is going up (green).
Average Volume on Down Days (Red Line): Displays the average volume on days when the price is going down (red).
Delta in Percentage (Blue Line): This shows the difference between the average volume of up days and down days, expressed as a percentage of the overall moving average of volume. It can be used to identify bullish or bearish volume imbalances. For example:
Positive values indicate that the volume on up days is stronger than on down days, which could suggest a bullish trend.
Negative values suggest that volume on down days is stronger than on up days, potentially indicating a bearish trend.
Zero Line (Gray Dotted Line): A reference line at 0 that helps you identify when the delta is positive or negative, and visualize the neutral point where volume is balanced between up and down days.
How to Use This Indicator:
Add to Your Chart: Copy the script above and paste it into TradingView's Pine Script editor. Click "Add to Chart" to visualize the indicator.
Interpret the Indicator:
Volume Volatility: A higher value suggests high market volatility. When volume is highly volatile, it may indicate more significant price movements or market uncertainty.
Long-Term Average of Volatility: Use this line as a reference to see whether current volatility is above or below average over a longer period.
Delta in Percentage: This is particularly useful to compare the strength of buying and selling volume. A positive delta percentage suggests strong buying pressure, while a negative delta suggests strong selling pressure. The closer the delta is to zero, the more balanced the volume between up and down days.
Use for Trend Confirmation: The indicator can help confirm trends. If the delta percentage is positive and increasing, and the volume volatility is above average, it could signal strong bullish momentum. Conversely, if the delta is negative and the volume volatility is rising, it may suggest bearish sentiment.
Risk Disclaimer:
Important: This indicator is a tool designed to help analyze market conditions. It does not guarantee success in trading and should not be used as the sole basis for making trading decisions. Always do your own research, consider other factors (e.g., price action, market news, fundamentals), and manage your risk appropriately. Trading involves significant risk, and you should only trade with money you can afford to lose. Always ensure you understand the risks involved in trading and use risk management strategies.
By using this tool, you accept full responsibility for any trading decisions and the outcomes thereof. The information presented is for educational and informational purposes only.

Volume Positive & Negative Levels [ChartPrime]Volume Positive & Negative Levels
Overview:
The Volume Positive & Negative Levels indicator by ChartPrime is designed to provide traders with a clear visualization of volume activity across different price levels. By plotting volume levels as histograms, this tool helps identify significant areas of buying (positive volume) and selling (negative volume) pressure, enhancing the ability to spot potential support and resistance zones.
Key Features:
⯁ Lookback Period:
- The `lookbackPeriod` parameter, set to 500 bars, determines the range over which the volume analysis is conducted, ensuring a comprehensive view of the market’s volume activity. The maximum lookback period is 500 bars or the bars currently visible on the chart, whichever is smaller.
⯁ Dynamic Volume Calculation:
- Volume is calculated dynamically based on the price action, with positive volume indicating buying pressure (close > open) and negative volume indicating selling pressure (close < open).
⯁ Color Coding for Clarity:
- Positive Volume: Represented with a distinct color (`#ad9a2c`), making it easy to identify areas of buying interest.
- Negative Volume: Highlighted with another color (`#ad2cad`), simplifying the detection of selling pressure.
Volume Threshold and Bins:
- The indicator allows users to set a volume threshold (`volume_level`) to highlight significant volume levels, with the default set at 70.
- The number of bins (`numBins`) defines the granularity of the volume profile, with a higher number providing more detail.
⯁ Volume Profile Visualization:
- The volume profile is plotted as a histogram, with the height of each bar proportional to the volume at that price level. This visualization helps in quickly assessing the strength of volume at various price points.
⯁ Interactive Labels and Threshold Indicators:
- Labels: The indicator uses labels to mark significant volume levels, providing quick reference points for traders.
- Threshold Lines: Lines are drawn at specified volume thresholds, with colors and widths dynamically adjusted based on the volume levels.
⯁ User Inputs:
- Volume Threshold (`volume_level`): Sets the minimum volume required to highlight significant levels.
- Number of Bins (`numBins`): Determines the resolution of the volume profile.
- Line Width (`line_withd`): Specifies the width of the lines used in the visualization.
The Volume Positive & Negative Levels indicator is a powerful tool for traders looking to gain deeper insights into market dynamics. By providing a clear visual representation of volume activity across different price levels, it helps traders identify key support and resistance zones, spot trends, and make more informed trading decisions. Whether you are a day trader or a swing trader, this indicator enhances your ability to analyze volume data effectively, improving your overall trading strategy.

Volume peak based zonesThis is a simple but effective indicator based on simple volume.
What does this indicator for you:
Zones are drawn on the basis of volume peaks. It is used for this purpose the closing price to the high or to the low depending on the direction of the candle.
How can this be used:
With volume peaks one assumes that a movement has reached your end for the time being or a new movement is initiated.
This cannot be verified by simple volume alone.
If a zone is displayed is now to pay attention to the following:
Narrow zone: indicate when creating mostly a continuation of the trend. Can later, however, be used as support or resistance.
Medium zones: The price is in an accumulation phase. Here is crucial, whether a candle with increased volume (preferably above the volume SMA) arises and the high or the low of the zone by closing price leaves. Accordingly, a short or long position can be taken. As SL, the high or low of the zone or the candle itself can be used.
Large zones: The high and low of the zone indicate a range in which the price will stay in the near future. The low or the high can be used as a once if the price does not leave the zone despite high volume at the close.
Otherwise, this can be interpreted as a breakout.
Principles of Volume:
Rising Volume at Rising Price = Intact Trend
Rising Volume at Falling Price = Intact Trend
Falling volume at rising price = correction movement
Falling volume at falling price = correction movement
Have Funn!!

Volume Profile Matrix [LuxAlgo]The Volume Profile Matrix indicator extends from regular volume profiles by also considering calculation intervals within the calculation window rather than only dividing the calculation window in rows.
Note that this indicator is subject to repainting & back-painting, however, treating the indicator as a tool for identifying frequent points of interest can still be very useful.
🔶 SETTINGS
Lookback: Number of most recent bars used to calculate the indicator.
Columns: Number of columns (intervals) used to calculate the volume profile matrix.
Rows: Number of rows (intervals) used to calculate the volume profile matrix.
🔶 USAGE
The Volume Profile Matrix indicator can be used to obtain more information regarding liquidity on specific time intervals. Instead of simply dividing the calculation window into equidistant rows, the calculation is done through a grid.
Grid cells with trading activity occurring inside them are colored. More activity is highlighted through a gradient and by default, cells with a color that are closer to red indicate that more trading activity took place within that cell. The cell with the highest amount of trading activity is always highlighted in yellow.
Each interval (column) includes a point of control which highlights an estimate of the price level with the highest traded volume on that interval. The level with the highest traded volume of the overall grid is extended to the most recent bar.

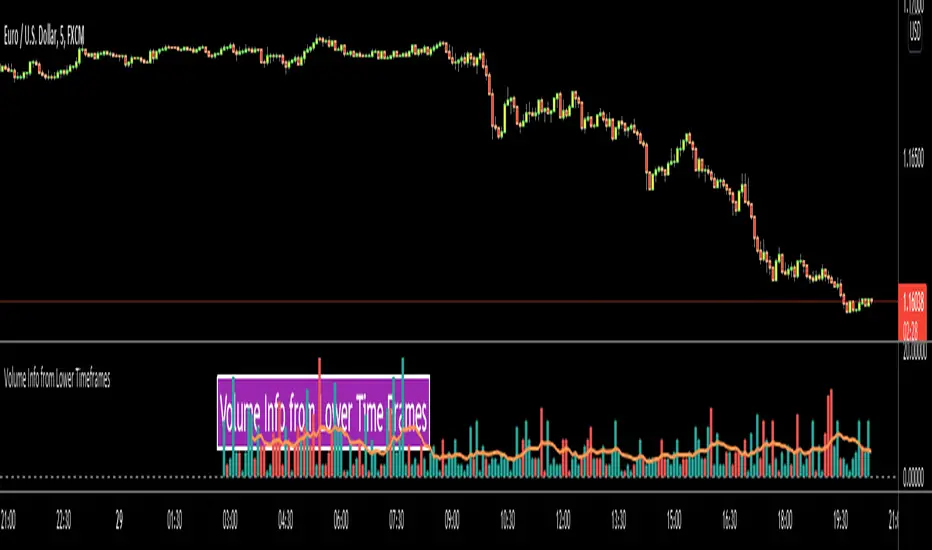
Volume Info from Lower Time FramesHello Traders,
We are now able to get info from lower time frames, Many Thanks to Pine Team .This script gets volume info from lower time frames and give alert if there is extreme volumes on last X lower time frame candles (if last X volumes are higher than volume moving average). so that if you set alerts on different securities then you will be able get alert if there is extreme volume moves and you can check the chart immediately.
The options:
Timeframe in Seconds : you can set lower time frames in seconds. by default it's 5 seconds. if you set it 60 then it will show 1min volumes, if you set it 1 then it will show 1 seconds volumes
MA Length : The script draws simple moving average using this length info. by default it's 20.
Number of Bars to Check for Alert : by default it's 5. meaning that if last 5 candles is greater than moving average and if you set alert then you get the alert "Extreme Volume"
Other options are for colors and line width.
As you can see in following example, chart time frame is 1 hour and the script shows volume info of 5 seconds candles:
Enjoy!
Volume Delta [BigBeluga]🔵 OVERVIEW
The Volume Delta indicator visualizes the dominance between buying and selling volume within a given period. It calculates the percentage of bullish (buy) versus bearish (sell) volume, then color-codes the candles and provides a real-time dashboard comparing delta values across multiple currency pairs. This makes it a powerful tool for monitoring order-flow strength and intermarket relationships in real time.
🔵 CONCEPTS
Each bar’s buy volume is counted when the close is higher than the open.
Each bar’s sell volume is counted when the close is lower than the open.
volumeBuy = 0.
volumeSell = 0.
for i = 0 to period
if close > open
volumeBuy += volume
else
volumeSell += volume
The indicator sums both over a chosen period to calculate the ratio of buy-to-sell pressure.
Delta (%) = (Buy Volume ÷ (Buy Volume + Sell Volume)) × 100.
Gradient colors highlight whether buying or selling pressure dominates.
🔵 FEATURES
Calculates real-time Volume Delta for the selected chart or for multiple assets.
Colors candles dynamically based on the delta intensity (green = buy pressure, red = sell pressure).
Displays a dashboard table showing volume delta % for up to five instruments.
The dashboard features visual progress bars for quick intermarket comparison.
An optional Delta Bar Panel shows the ratio of Buy/Sell volumes near the latest bar.
A floating label shows the exact Buy/Sell percentages.
Works across all symbols and timeframes for multi-asset delta tracking.
🔵 HOW TO USE
When Buy % > Sell % , it often signals bullish momentum or strong accumulation—but can also indicate over-excitement and a possible market top.
Market Tops
When Sell % > Buy % , it typically reflects bearish pressure or distribution—but may also occur near a market bottom where selling exhaustion forms.
Market Bottom
Use the Dashboard to compare volume flow across correlated assets (e.g., major Forex pairs or sector groups).
Combine readings with trend or volatility filters to confirm whether the imbalance aligns with broader directional conviction.
Treat the Delta Bar visualization as a real-time sentiment gauge—showing which side (buyers or sellers) dominates the current session.
🔵 CONCLUSION
Volume Delta transforms volume analysis into an intuitive directional signal.
By quantifying buy/sell pressure and displaying it as a percentage or color gradient, it provides traders with a clearer picture of real-time volume imbalance — whether within one market or across multiple correlated instruments.

Volume Bars - Shubhashish DixitThis helps you to identify volume based on your given period and it solves the issues which we are unable to see units in the main bar of Volume default chart

Volume Profile + Price Action Strategy (POC-based)This indicator combines volume dynamics, price action patterns, and a simplified Point of Control (POC) to highlight potential high-probability trade zones.
🔍 Key Features
POC-Based Logic
Plots the POC from the most recent closed 10-minute candle as a horizontal level for intraday structure.
Volume Spike Detection
Highlights unusual activity based on volume compared to the average of the last N candles.
Effort vs. Result Analysis
Based on Wyckoff-inspired logic:
Absorption: Large volume, small body → possible buyer/seller absorption
False Move: Small volume, large body → potential fakeout
Price Action Recognition Detects:
Inside Bars
Pin Bars
Engulfing Candles
Signal Highlights
🔺 Absorption Signals (below bar, teal triangle)
🔻 False Move Signals (above bar, orange triangle)
🔷 POC Line
⚙️ Customizable Inputs
You can control signal sensitivity with these inputs:
Volume Spike Multiplier
Raise to filter only extreme volume spikes
→ Recommended: 2.0 to 3.0 for cleaner setups
Absorption Body Ratio
Lower to detect only very small bodies (tight candles)
→ Try 0.3 to 0.4 for stricter absorption logic
False Move Body Ratio
Raise to catch only large candles on low volume
→ Use 2.0+ to filter weak moves
🧠 How to Use
Use in confluence with:
Support/Resistance
VWAP or moving averages
Session opens/closes
Best on 10-minute charts, but adjustable
✅ Signal Tuning Tips
Want fewer but cleaner signals?
Increase Volume Spike Multiplier: 2.5+
Decrease Absorption Body Ratio: 0.3
Increase False Move Ratio: 2.0+
Want more frequent signals?
Lower Volume Multiplier: 1.2–1.5
Raise Absorption Ratio: 0.6+
Lower False Move Ratio: 1.2–1.4
📊 Recommended Timeframe
Optimized for 10-minute charts
Works intraday, especially around session opens and POC re-tests
⚠️ Disclaimer
This script is for educational and informational purposes only. It does not constitute financial advice or a recommendation to buy or sell any asset. Past performance is not indicative of future results. Always do your own research and consult a licensed financial advisor before making trading decisions.
Use at your own risk.

Volume EquilibriumThe intent behind this indicator is to provide comprehensive information relating to volume compared to multiple timeframes. This indicator allows one to see what the market 'theoretically' sees as 'fair-value' whilst also allowing one to gauge where the price of a stock is headed.
Volume Equilibrium
The main indicator finds the difference between buying volume and selling volume, under the basic presumption that more buying volume indicates greater bullish sentiment and vice versa.
Buying Volume = volume when close price is higher than open price.
Selling Volume = volume when close price is lower than open price.
Volume Balance = Cumulative Buying Volume − Cumulative Selling Volume
Volume Balance is then expressed as a percentage by dividing by total volume
This indicator is composed of three different lengths of the same indicator. Short, Mid, and Long term representations of Volume Equilibrium. The difference between the mid and long term are highlighted so to make it easy to see where volume is going relative to a longer time frame.
HOW TO USE:
At 0 ---> Equilibrium ---> Equal Buying/Selling Volume
Above 0 ---> More buying Volume
Below 0 ---> More selling Volume
Using theory, it is assumed that the price is at a 'fair-value' when the buying/selling volume is at 0. This is of course relative to the respective timeframe of your choosing. More weight given to larger timeframes.
Volume Histogram
It is a basic volume chart that represents the total volume though has highlighted bars so to indicate buying(green) and selling(red) volume. This allows one to see what the indicator is based off of.
Open-Close Oscillator(not needed)
Calculates the average open-close for a selected timeframe and then provides the current closing price relative to that average open-close. Very simply put, values below 0 indicate bearish and values above 0 generally indicate bullishness. This indicator is for a quick reference of price action relative to volume.
Another way to use this indicator, though unique, is to analyze the separate open-close lines themselves. Using the open-close bands, bullishness is defined as increasing closing prices and bearish as decreasing closing prices. So, in regard to this indicator, bear sessions can be indicated by the opening line being below the closing line and bull sessions as the opening line being above. Use the 'flip' of these lines to your advantage, they are very helpful at capturing long continuous sentiment.
This indicator is composed of great information though I still think it best to use many different indicators to help you with your trades.
NOTE: Be aware of what we are trying to analyze, Volume. This means that one should also look out for divergences to capture early indications of reversals. This indicator can be leveraged greatly.

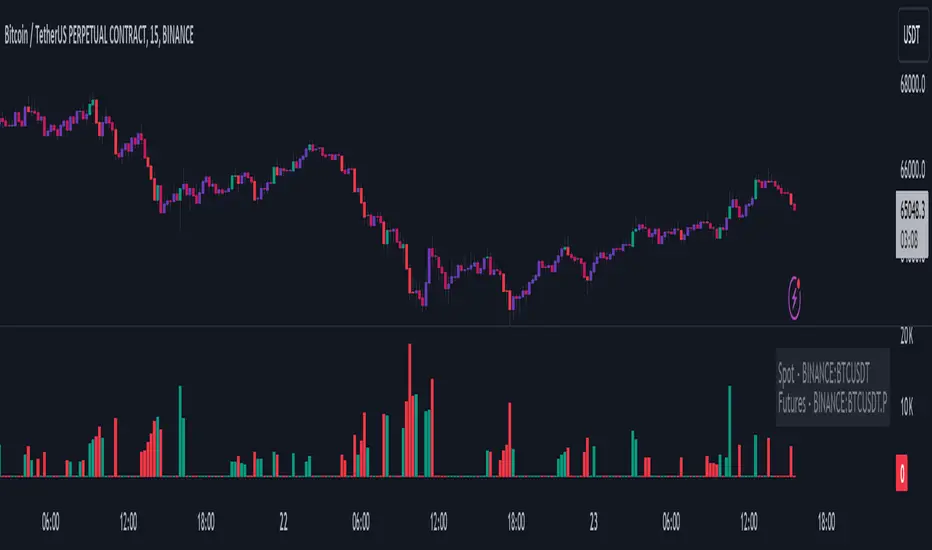
Volume Liqidations [EagleVSniper]The Volume Liquidations Indicator is designed for traders who want to spot significant liquidation events in the cryptocurrency markets, particularly between spot and futures volumes. This powerful tool auto-detects the trading asset and compares the volume data from both spot and futures markets to highlight potential high-volume liquidation points that can significantly impact price movement. Raw source code owner - tartigradia
Features:
Auto-Detect Functionality: Automatically identifies the current trading asset, providing an option for manual selection for both spot and futures symbols.
Volume Comparison: Calculates the difference between futures and spot volumes within a user-defined timeframe, helping to identify liquidation events.
Customizable Parameters: Offers customizable options for multipliers, lookback periods, and timeframe selection to tailor the indicator to your trading strategy.
Visual Indicators: Displays liquidation volumes as color-coded columns, with green indicating potential long liquidations and red for short liquidations. It also highlights bars that exceed the high-volume threshold, providing a clear visual cue for significant liquidation events.
Spot and Futures Volume MA: Includes optional moving average plots for both spot and futures volumes, allowing for a deeper analysis of market trends.
Highlighting High-Volatility Candles: The indicator uniquely colors candles that reach a predefined volatility threshold, determined by the user-set multiplier. This functionality aims to spotlight moments of significant market volatility, providing traders with immediate visual cues.
Dynamic Ticker Selection: Seamlessly switches between auto and manual ticker selection, providing flexibility for all types of traders.
How to Use:
Setup: Configure the indicator to your preferences. You can choose between automatic or manual ticker selection, set the multiplier for the high-volume threshold, and define the lookback period for the moving average calculation.
Analysis: The indicator plots differences in volume between futures and spot markets as columns on your chart, color-coded to indicate the direction of potential liquidations.
Decision Making: Use the indicator to identify potential liquidation events. High-volume thresholds are highlighted, suggesting significant market movements. Combine this information with other analysis tools to make informed trading decisions.
Volume Records + AlertContents
Overall Introduction
Settings menu parameters
Usage
How to use alerts
Limits
Overall Introduction
This indicator is a "volume analysis" tool for confirming the direction and strength of price trend and spotting trend reversals. This tool consists of two parts:
1- The colored graph is a custom volume oscillator which shows the relative changes in volume.
The darkening of the color of the bars is a sign of increasing volume.
2- Triangular labels that show trading volume records over different time periods based on the absolute values of the volume.
By creating an alert, you can be notified of new trading volume records. These records are:
Highest / lowest volume in one year,
Highest / lowest volume in six month
Highest / lowest volume in three month
Highest / lowest volume in one month
Highest / lowest volume in one week
Settings menu parameters
{Short Length} =>
The fast volume MA of the Volume Oscillator.
{Long Length} =>
The slow volume MA of the Volume Oscillator.
{Visual Parameters} =>
Parameters to personalize the appearance of the indicator.
{Alert Conditions Part 01: Highest Records ⏰ } =>
Parameters to customize the alert.
{Alert Conditions Part 02: Lowest Records ⏰ } =>
Parameters to customize the alert.
Usage
This indicator is a "volume analysis" tool for confirming the direction and strength of price trend and spotting trend reversals.
What Is Volume Analysis?
Volume analysis involves examining relative or absolute changes in an asset's trading volume in order to make inferences about future price movements.
A significant price increase along with a significant volume increase, for example, could be a credible sign of a continued bullish trend or a bullish reversal.
The gradual darkening of the bars is a sign of the strength of the trend.
Volume can be an indicator of market strength, as rising markets on increasing volume are typically viewed as strong and healthy.
How to use alerts
Note that by creating an alert, an instance of the indicator, with all your settings, will be activated on the site's server and alerts will be triggered by it.
After that, changing the indicator settings on the chart will no longer affect the alert.
Open the settings window and select the alert conditions as you wish
Click the Create Alert button (or press the A key while holding down the ALT key)
In the Condition section, select the name of the indicator.
Make the rest of the settings as you wish.
Finally, click on the Create button.
It's finished. After a few moments, your alert will be added to the Alerts menu.
Limits
The labels are displayed after the bars close.
Labels are displayed for the last 10,000 bars.

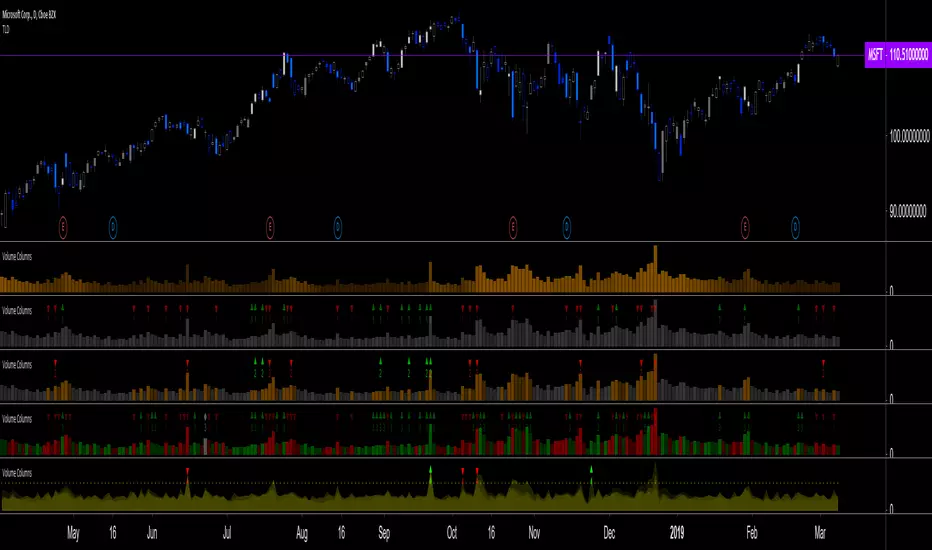
Volume Columns w. Alerts (V) [LucF]These are volume columns on steroids, for serious volume users. You can use the indicator to show volume columns or relative volume. You can define alerts using numerous conditions in both column and relative modes simultaneously. Multiple coloring schemes allow you to reveal volume columns in a much more useful light than the two-color standard.
Features
Seven Color Schemes
Plain gray.
Different color for columns above average MA.
Standard green and red.
Color gradient using the relative position of MA (default mode).
The first 3 schemes allow for highlighting increasing volume columns.
A gray column in an otherwise colored scheme indicates no change in price.
Two Modes
Column Mode: In this mode you can show the volume MA and mask the columns under it. The standard is an EMA because I think it better suits volume’s quick changes, but you can change it to the usual simple MA, as well as define its length.
Relative Volume: Calculations have been kept rudimentary. Current volume is simply compared to the previous bar’s volume. In order to compensate for this, a multiple area mode also compares current volume to 5, 15, 50 and 200 periods MAs. You can choose to view only the main relative volume value. Relative volume is capped in order to prevent the loss of detail caused by wild increases. The default cap is 10, but you can define your own. Spikes that are capped show a dot at their top. A separate threshold (its default value is the standard 2) is included for relative volume; it is used to generate relative volume markers.
Four Markers
Bumps (marker 1): A bump occurs when an increasing volume column is above its MA and the candle’s close is above/below the previous close.
Double Bumps (marker 2): A double bump occurs when 2 bumps are present in the last 3 bars.
Volume Over MA (marker 3): Triggers whenever volume is above MA. This is the noisiest of the markers.
Relative Volume (marker 4): This event occurs when relative volume crosses the pre-defined threshold.
You can choose to only show long or short markers.
Two Backgrounds
You can choose to highlight the background on bumps and double bumps.
Alerts
You can define alerts on any combination of markers you configure. After defining the markers you want the alert to trigger on, make sure you are on the interval you want the alert to be monitoring at, then create the alert, select V, use the default “Configured Markers” alert condition and choose your triggering window (usually “Once Per Bar Close”). Once the alert is created, you can change the indicator's inputs with no effect on the alert.
No worthwhile price movement exists without volume. It thus makes sense to define alerts on volume if you want to monitor markets. I use the markers to define two types of alerts. For general market scanning, I use markers 2 and 4 on high time frames. When I have identified a good opportunity for entry and am waiting for confirmation, I will often setup a custom alert for that market at a shorter time interval using markers 1 and 4.
Notes
Until we have access to delta volume information on TradingView, this indicator tries to get the most out of volume columns without using security calls at inside intervals to get more resolution on volume, because it slows things down considerably.
The chart shows different combinations of color schemes and markers, along with my TLD indicator on the chart.
Volume Profile: Intra-bar VolumeThis indicator was developed as part of a free blog post tutorial on the Backtest-Rookies website for detailed code commentary, head over there.
Scope
The indicator shall attempt to do the following:
Look at a lower time-frame. E.g 5 minutes when on a 1-hour chart.
Create a function to loop through through candles and make an assessment.
If the candle it closed up, the volume will be categorized as buying volume. Conversely, if it closed down, the volume will be categorized as selling volume
The function will then be passed to the security() function to run on a lower timeframe.
All buying volume and selling volume from the lower time-frame shall be summed and displayed on the main chart.
Important Note
This indicator will not give you genuine buying or selling volume. It simply follows the assumption that if price closed up, there must have been more buyers than sellers and if it closed down we assume the opposite.
Usage
In order to use this indicator, users will need to calculate how many lower time-frame bars are contained in the time-frame on the main chart. So for example, the default settings are configured for the indicator to be run on the 1H chart. As a result, we need to set the "Bars on Lower Timeframe" input to 12. This is because there are 12 x 5-minute bars in 60 minutes.

Volume Indicator VSidea take from Alexander Elder, author of: The New Trading for a Living: Psychology, Discipline, Trading Tools and Systems, Risk Control, Trade Management
Meaning of colouring:
- Green bar Volume: If we look back certain numbers of volume bars, higher close price and higher volume.
- Blue bar Volume: If we look back certain numbers of volume bars, higher close price and lower volume.
- Red bar Volume: If we look back certain numbers of volume bars, lower close price and higher volume.
- Orange bar Volume: If we look back certain numbers of volume bars, lower close prince and lower volume.
- Grey bar Volume: If we look back certain numbers of volume bars, same price and same volume.

Volume HeatMap Divergence [BigBeluga]🔵 OVERVIEW
The Volume HeatMap Divergence is a smart volume visualization tool that overlays normalized volume data directly on the chart. Using a color heatmap from aqua to red, it transforms raw volume into an intuitive scale — highlighting areas of weak to intense market participation. Additionally, it detects volume-based divergences from price to signal potential reversals or exhaustion zones. Combined with clear visual labeling, this tool empowers traders with actionable volume insights.
🔵 CONCEPTS
Normalized Volume Heatmap : Volume is normalized to a 0–100% scale and visually represented as candles below the chart.
float vol = volume / ta.percentile_nearest_rank(volume, 1000, 100) * 100
Bar Coloring : Price candles are dynamically colored based on volume intensity.
Volume Divergence Logic :
Bullish Divergence : Price forms a lower low, but volume forms a higher low.
Bearish Divergence : Price forms a higher high, but volume forms a lower high.
Dynamic Detection Range : Customizable range ensures divergence signals are meaningful and not random.
Volume Labels : Additional info on divergence bars shows both the actual volume and its normalized % score.
🔵 FEATURES
Volume Heatmap Plot : Normalized volume values colored using a smooth gradient from aqua (low) to red (high).
Price Bar Coloring : Candlesticks on the main chart adopt the same heatmap color based on volume.
Divergence Detection :
Bullish divergence with label and low marker
Bearish divergence with label and high marker
Dual Divergence Labels :
On the volume plot : Direction (Bull/Bear), raw volume, and normalized %
On the price chart : Shape labels showing "Bull" or "Bear" at local highs/lows
Custom Inputs :
Divergence range (min & max), pivot detection distance (left/right)
Toggle to show/hide divergence labels, volume, and % text
Clear Bull/Bear Coloring : Fully customizable label and line colors for both bullish and bearish signals.
🔵 HOW TO USE
Use the indicator as an overlay to monitor real-time volume strength using the heatmap color.
Watch for divergence markers:
Bullish divergence: Candle shows higher volume while price makes a new low
Bearish divergence: Candle shows lower volume while price makes a new high
Use the volume info labels to verify the context of divergence:
Actual volume at divergence candle
Normalized % of that volume compared to past 1000 bars
Adjust pivot sensitivity using "Pivot Left" and "Pivot Right" to tune signal frequency and lag with a right pivot length.
Use divergence zones as early warnings for potential reversals or trend shifts.
Disable or customize labels in settings depending on your charting preferences.
🔵 CONCLUSION
Volume HeatMap Divergence merges heatmap-style volume visualization with intelligent divergence detection — giving traders a clean yet powerful edge. By revealing hidden disconnections between price and participation, it helps users spot exhaustion moves or hidden accumulation zones before the market reacts. Whether you’re a scalper, swing trader, or intraday strategist, this tool offers real-time clarity on who’s in control behind the candles.
