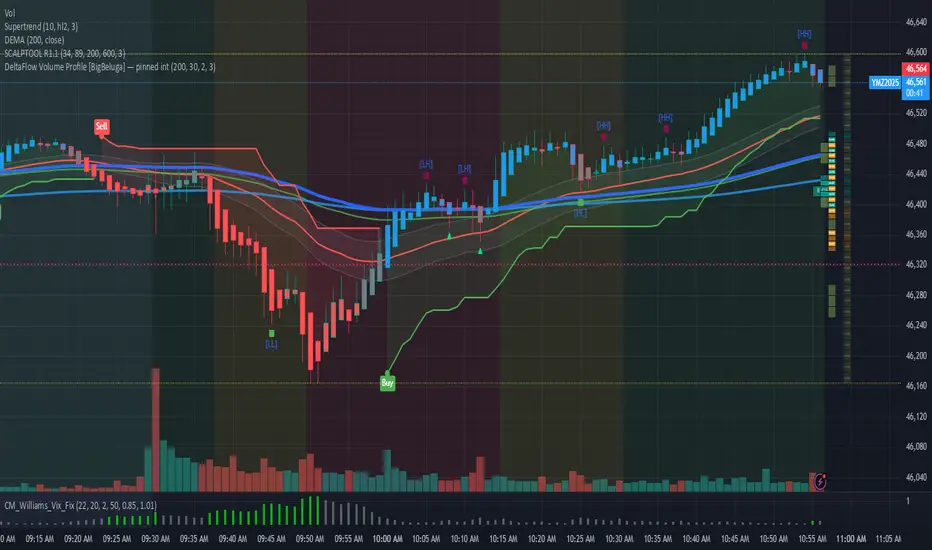
DeltaFlow Volume Dr.Ryan [Beluga Port]This is a delta volume profile copy I have made for tracking volume flow.
Cerca negli script per "volume"
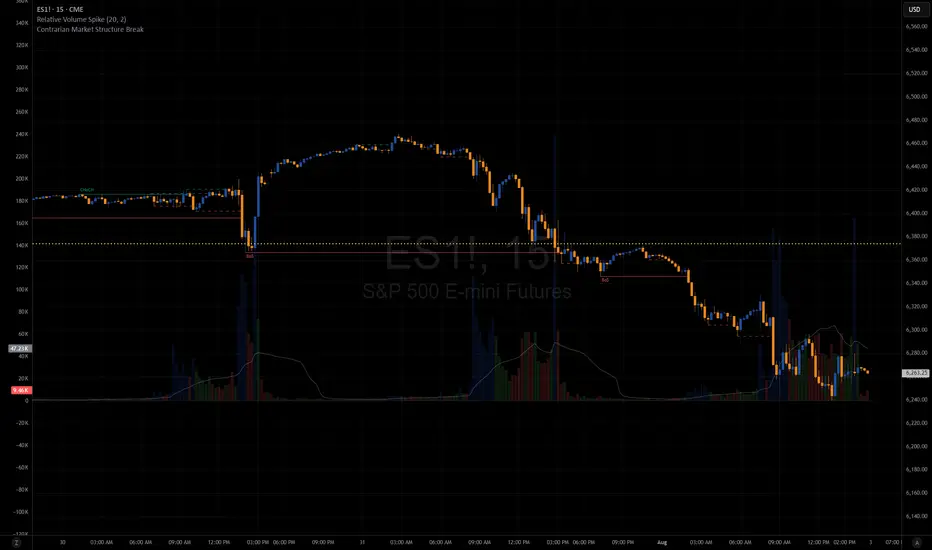
DMV Volume Volume Radar SIMPLEThis indicator helps identify early signs of accumulation, breakout, and distribution by analyzing relative volume and price action within defined ranges.
It detects:
🔵 ACCUM: High relative volume with buying pressure near support (early accumulation)
🟢 BRK: High relative volume near range high with bullish price action (potential breakout)
🔴 DIST: High relative volume with selling pressure near range high (distribution / potential reversal)
How it works:
Measures relative volume vs. a moving average
Builds a dynamic price range using recent swing highs/lows
Looks for wick behavior + location in range to validate signals
Color-codes candles and adds labels for quick visualization
Optional alert conditions are baked in for automated notifications
Perfect for:
Pre-breakout positioning
Spotting smart-money accumulation
Identifying distribution zones for exits or reversals
Works best on 15m–4h timeframes for crypto and alts

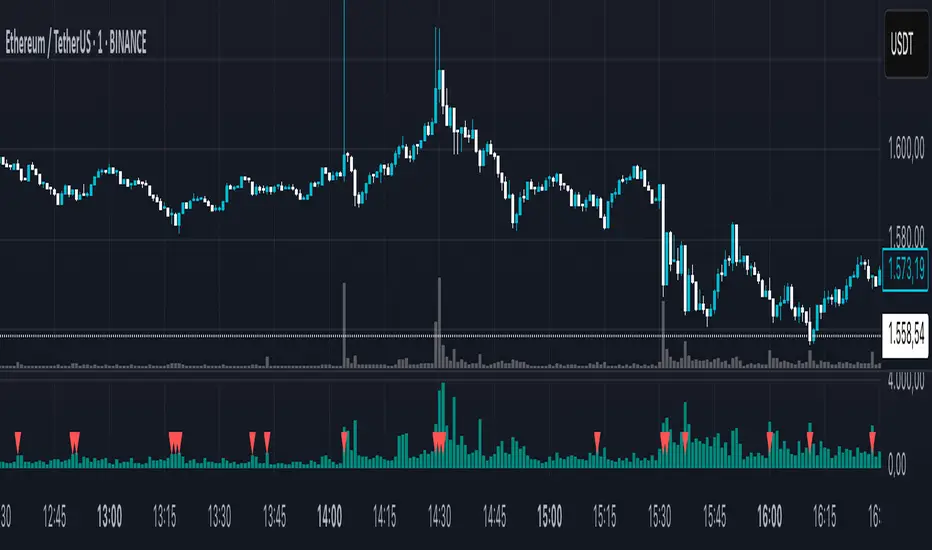
Advanced Volume indicator This indicator shows 4H volume on the 1H chart.
I am using this one for my swing trade system on the 1H chart, which I will also publish later.
My entry signal is a extraordinary volume candle, a red threshold line can mark “very high volume” zones (SMA × multiplier).

LTF Volume Bubbles on HTFLTFVB HTF plots lower-timeframe volume “bubbles” directly on your higher-timeframe chart, so you can see where and how strong real intrabar activity is without dropping down a timeframe.

High Volume AlertThis Pine Script monitors trading volume in real time and alerts you whenever current volume is unusually high — specifically, when it’s greater than a chosen multiple (for example, 1.5×) of the average volume over a recent period (for example, 20 bars).
It’s a quick way to detect volume spikes, which often precede breakouts or reversals.

NYSE FOMO Indicator (Up/Down Volume Ratio)This script plots the NYSE Sentiment Gauge, based on the daily Up/Down Volume Ratio (UVOL ÷ DVOL).
It measures crowd emotion in the overall market:
• ≥ 3 = Red: FOMO, extreme buying.
• 2–3 = Yellow: Cautious optimism.
• 0.5–2 = Grey: Neutral zone.
• 0.33–0.5 = Green: Emerging fear.
• ≤ 0.33 = Bright Green: Panic selling, potential bottom.
The line color and chart background change according to these zones, visually showing shifts in market sentiment.

Session Volume Spike DetectorSession Volume Spike Detector (Buy/Sell, Dual Windows, MTF + Edge/Cooldown)
What it does
Detects statistically significant buy/sell volume spikes inside two DST-aware Mountain Time sessions and projects 1m / 5m / 10m signals onto any chart timeframe (even 1s). Spikes are confirmed at the close of their native bar and are edge-triggered with optional cooldowns to prevent duplicate alerts.
How spikes are detected
Volume ≥ SMA × multiplier
Optional jump vs recent highest volume
Optional Z-Score gate for significance
Separate Buy/Sell logic using your Direction Mode (Prev Close or Candle Body)
Multi-Timeframe (MTF) display
Shows 1m, 5m, 10m arrows on your current chart
Each HTF fires once on its bar close (no repaint after close)
Sessions (DST-aware, MT)
Morning: 05:30–08:30
Midday: 11:00–13:30
Spikes only count inside these windows.
Inputs & styling
Thresholds: SMA length, multipliers, recent lookback, Z-Score toggle/level
Toggles for which TFs to display (chart TF, 1m, 5m, 10m)
Per-TF colors + cooldowns (seconds) for Any TF, 1m, 5m, 10m
Alerts (edge + cooldown)
MTF Volume Spike (Any TF) — fires on the first qualifying spike across enabled TFs
1m / 5m / 10m Volume Spike — per-TF alerts, Buy or Sell
Recommended: set alert Trigger = Once per bar close. Cooldowns tame “triggered too often” warnings.
Great with
FVG zones, bank/insto levels, session range breaks, and trend filters. Use the MTF arrows as a participation/pressure tell to confirm or fade moves.
Notes
Works on any symbol/timeframe; best viewed on 1m or sub-minute charts.
HTF spikes appear on the bar close of 1m/5m/10m respectively.
No dynamic plot titles; Pine v6-safe.
Short summary (≤250 chars):
MTF volume-spike detector for intraday sessions (DST-aware, MT). Projects 1m/5m/10m buy/sell spikes onto any chart, with edge-triggered alerts and per-TF cooldowns to prevent duplicates. Ideal for spotting institutional participation.

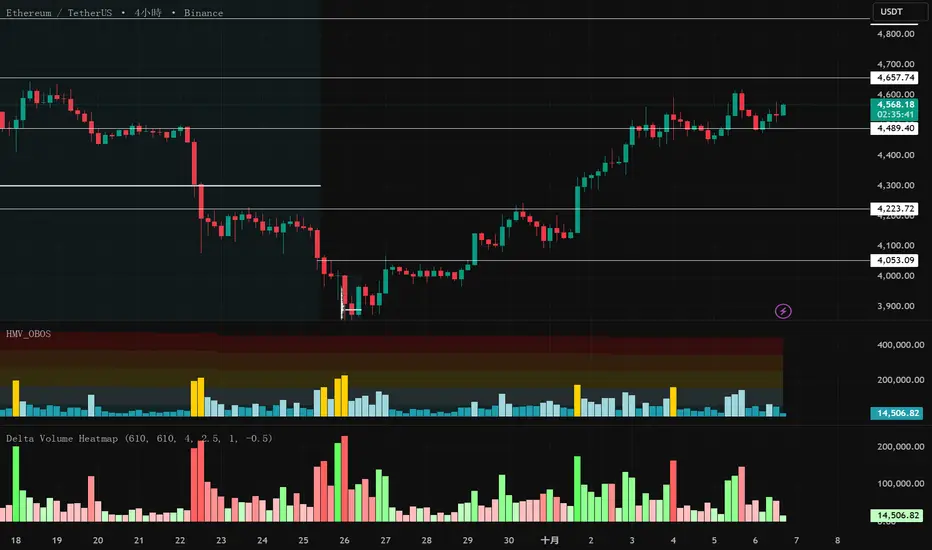
Delta Volume Heatmap Delta Volume Heatmap
The Delta Volume Heatmap visualizes the real-time strength of per-bar delta volume — highlighting the imbalance between buying and selling pressure.
Each column’s color intensity reflects how strong the delta volume deviates from its moving average and standard deviation.
🟩 Green tones = Buy-dominant activity (bullish imbalance)
🟥 Red tones = Sell-dominant activity (bearish imbalance)
This tool helps traders quickly identify:
Abnormal volume spikes
Absorption or exhaustion zones
Potential reversal or continuation signals

Delta Volume Heatmap Delta Volume Heatmap
The Delta Volume Heatmap visualizes the real-time strength of per-bar delta volume — highlighting the imbalance between buying and selling pressure.
Each column’s color intensity reflects how strong the delta volume deviates from its moving average and standard deviation.
Green tones = Buy-dominant activity (bullish imbalance)
Red tones = Sell-dominant activity (bearish imbalance)
This tool helps traders quickly identify:
Abnormal volume spikes
Absorption or exhaustion zones
Potential reversal or continuation signals
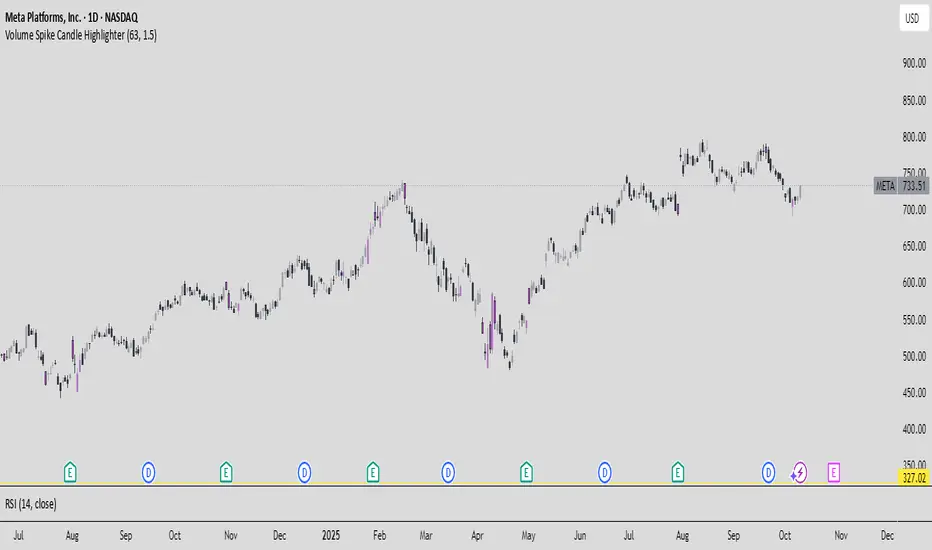
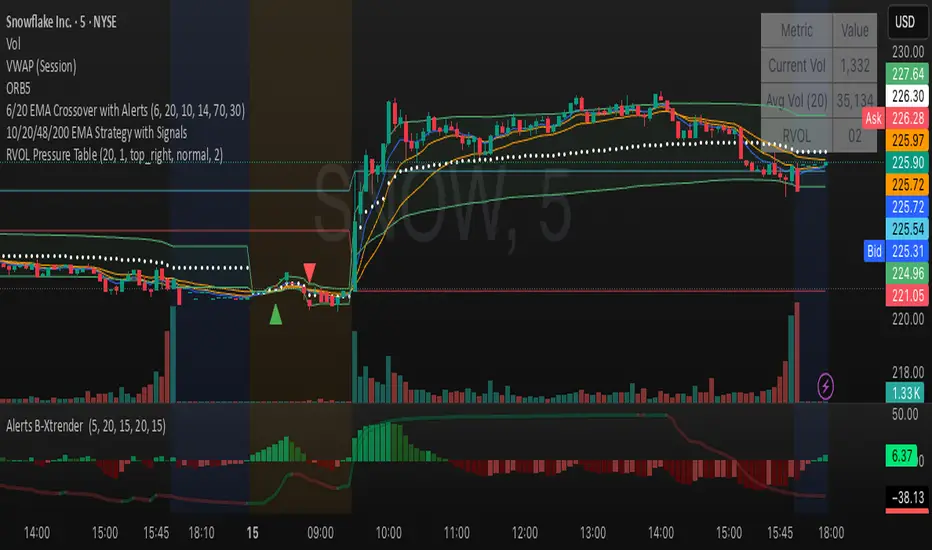
Relative Volume Table with PressureDisplay relative Volume as a table in the top right corner. Turns green when volume is high and price is increasing and red when volume is high and price is decreasing. I use this on D timeframe at the open to screen for stocks breaking out.
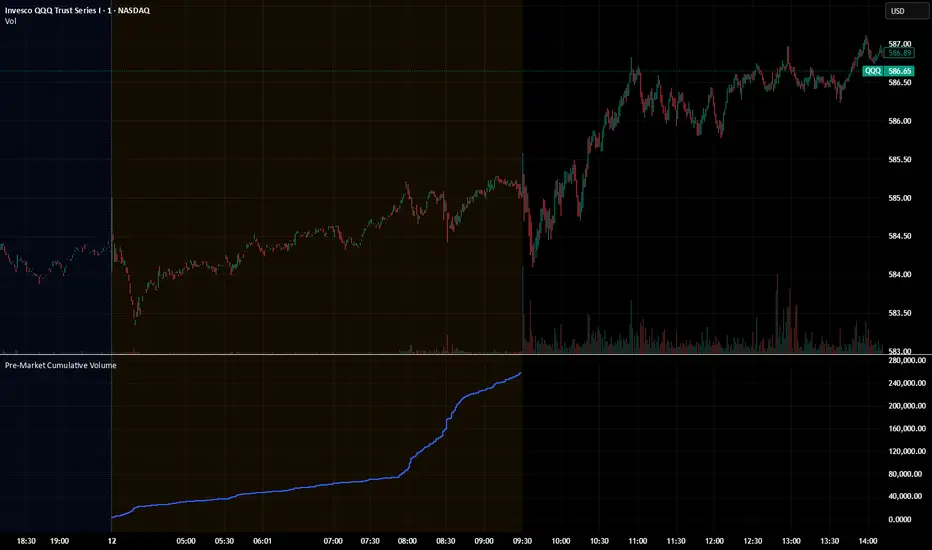
Pre‑Market Cumulative VolumeDescription:
This indicator plots the cumulative trading volume for the pre‑market session on intraday charts. It automatically detects when a bar is part of the extended pre‑market period using TradingView’s built‑in session variables, starts a new running total at the first pre‑market bar of each day, and resets at the beginning of regular trading hours. During regular market hours or the post‑market session, the indicator does not display values.
To use this script effectively, ensure extended‑hour data is enabled on the chart, and select an intraday timeframe where pre‑market data is available. The result is a simple yet powerful tool for monitoring cumulative pre‑market activity.
How to use
Add the script to a chart and make sure you are on an intraday timeframe (e.g., 1‑min, 5‑min). Extended‑hour data must be enabled; otherwise session.ispremarket will always be false.
During each pre‑market session, the indicator will reset at the first pre‑market bar and then accumulate the volume of subsequent pre‑market bars.
Outside the pre‑market (regular trading hours and post‑market), the plot outputs na, so it does not draw on those bars.
Customization (optional)
If you want to define your own pre‑market times instead of relying on TradingView’s built‑in session, you can replace the isPreMarket line with a time‑range check. For example, isPreMarket = not na(time(timeframe.period, "0400-0930")) detects bars between 04:00 and 09:30 (U.S. Eastern time). You can parameterize the session string with input.session("0400-0930", "Pre‑Market Session") to let users adjust it.

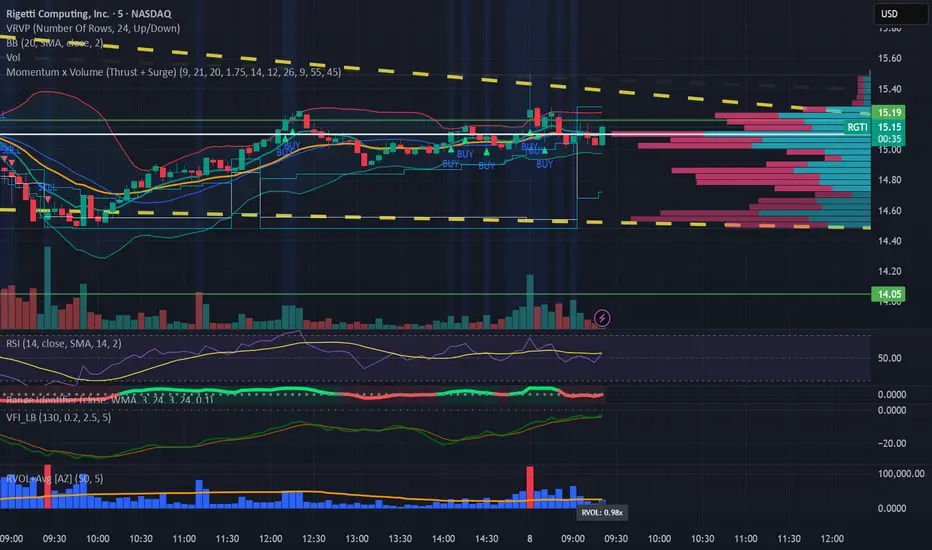
Relative Volume (RVOL) + Average Volume [AZ]The script helps you instantly see whether today’s volume is unusual compared to the past (relative volume). It’s built for breakout/fakeout filters, like the 15-minute ORB strategy you’re running.
VSA Volume OverlaySimple. When the VSA volume is above the average volume the line will draw orange. When below average volume plot , it will draw white.

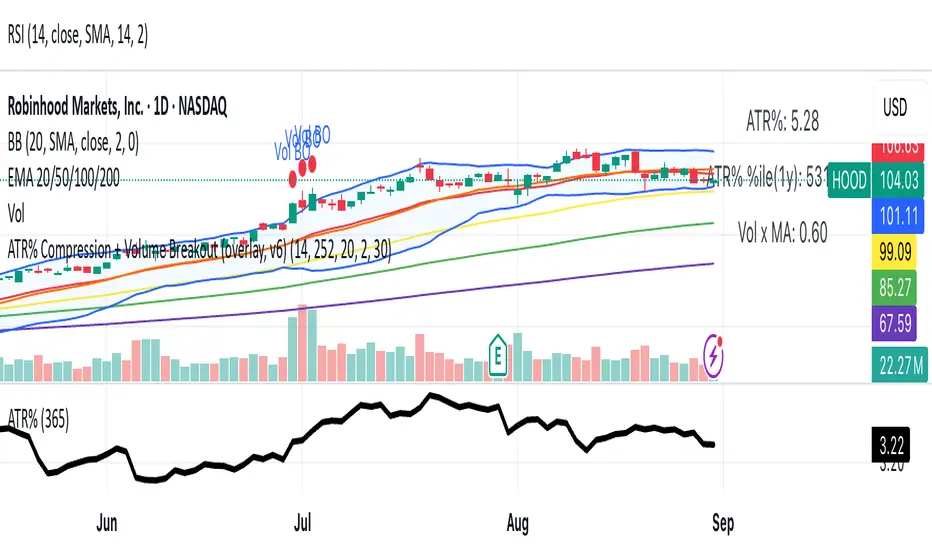
ATR% Compression + Volume Breakout (overlay price panel)this is your signal/alerts tool. It tints compression regimes, marks volume-breakout bars, and fires the two alerts (“Compression Detected” and “Volume Breakout + ATR% Rising”).
Momentum x Volume (Thrust + Surge)highlights bars where trend, momentum, and volume align. It filters for an uptrend (EMA pair or VWAP), confirms thrust with MACD histogram, measures momentum quality with volume-weighted RSI (vwRSI), and requires a volume surge vs a rolling average before signaling. The goal: surface higher-conviction breakouts and breakdowns while avoiding weak, low-volume moves.

Buy Sell Volume Dashboard (Conditional Colors)Display all data in the box (dashboard) on the top right chart.
✅ Data output:
Buy Volume
Sell Volume
Volume Difference (Buy – Sell)
Buy % / Sell % Dominance
✅ Auto according to the timeframe we open (for example if open 5m, data follows 5m; if daily, follow daily).

M3EDGE™ Relative Volume (RVOL)Relative Volume (RVOL) compares the current volume to its historical average.
🎯 Goal: Spot abnormal flows and anticipate impulsive moves.
🔍 M3EDGE™ Key Reading:
• RVOL > 2.0 → Likely institutional activity.
• RVOL > 1.5 → Heightened surveillance: potential move building.
• Price falling + high RVOL → Stealth accumulation / sell-side absorption.
• Price rising + high RVOL → Confirmed breakout with real flows.
💡 In the M3EDGE™ method, RVOL filters out false signals and validates setups by aligning flow + structure + momentum.
Applied to ETFs or stocks, it reveals what price action alone won’t show

Relative Volume SpikeThis indicator lets you know when a wick has 2x (default value) more volume than the average.
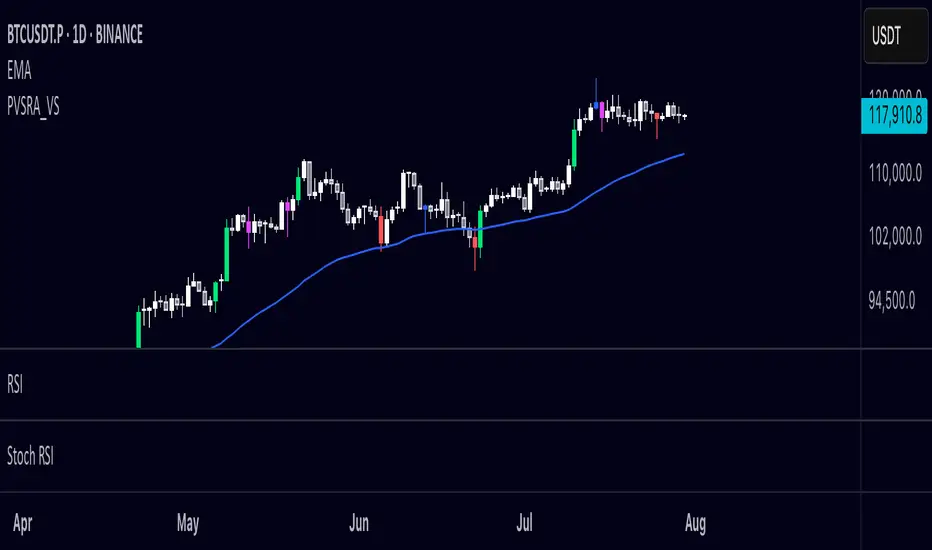
PVSRA Volume Suite OverlayPVSRA Volume Suite v5 is a volume-based candle coloring tool inspired by the original PVSRA system from MT4. It identifies and highlights Climax candles (extremely high volume/spread) and Above-Average volume candles relative to the last 10 bars. Bullish and bearish candles are colored differently based on their volume classification to help spot potential institutional activity or market reversals.
This script also includes a symbol override option, allowing volume analysis from another ticker (e.g., BTC volume on altcoin charts).
📌 Credit to creengrack for the open-source code that informed this TradingView version.
Thank you
Session VolumeThis script tracks and displays 30-minute volume segments during the Regular Trading Hours (RTH) session. It allows traders to visually compare each time block’s volume today vs. the same block from the previous day, helping spot early signs of strength, weakness, or divergence.
Features:
Tracks 13 blocks from 9:30 AM to 4:15 PM ET.
Compares today's volume against historical volume from the same time block yesterday.
Highlights percentage changes per block.
Summary row totals show overall volume trend today vs. yesterday.
This tool is useful for discretionary traders, auction market theorists, and anyone who incorporates market-generated information into their decision-making.

Climax Volume FilterThis script helps filter out volume spikes caused by sudden market events (e.g. CPI, FOMC), which can distort volume-based analysis.
It identifies and optionally smooths or excludes high “climax” candles to provide a clearer view of natural volume trends during pullbacks and consolidations.
Use it to:
• Avoid misreading volume during news events
• Improve your reading of exhaustion vs. continuation
• Support better entry timing during flag or FVG setups