Cycle strategy DEMO V1.0READ BEFORE USING:
This indicator includes the Cycle strategy and 2 bonus indicators ( pivot strategy & volume strategy). This is a DEMO version that doesn't show the signals after end of January 2022. This indicator only allows you the backtest/study previous results and give a general idea on the workings on the indicator.
Introduction
Cycle strategy works on the following timeframes, 1HR, 4HR, 12HR and 1D. Cycle strategy is mostly used by me on the 1D timeframe, however, if you prefer shorter timeframes you can select those. Indicator settings will automatically adjust based off the timeframe on your chart. I use this indicator mainly for BTC , however, altcoins such as ETH, LTC, DOGE, ADA, ETC, SOL and more have shown reasonable results in the past.
The theory behind cycle strategy
The cycle strategy is based off the theory that Bitcoin moves in cycles, each time followed by periods of sideways action. This strategy tries to breakout trade momentum out of a sideways range by calculating things such as momentum, volatility and average price. The indicators, based off calculations, tries to spot breakout trends. When a trend break up it gives a "long" signal on the chart and when the trend breaks down it gives a "short" signal.
Sometimes the price doesn't break out, this is called a fakeout. The bot will automatically reverse its previous signal and take a small loss.
Applications of it in my trading setup
I apply the wave strategy in my own trading enviroment as a tool to determine buy/sell moments and general trend.
Whenever Bitcoin reaches extreme overbought level I'll wait for the indicator to give me a "sell" signal in order to hedge myself against possible corrections. In the past I've seen many bearmarkets before, I tended to not have any fiat on the side to buy these dips. The indicator has be allowed in the past to almost perfectly sell the top multiple times allowing me to accumulate BTC on lower levels and therefor increase my BTC position. I also use this indicator to spot the current Bitcoin trend. If the indicator shows a "long" signal I'll generally be looking to long on dips and whenever there is a "sell" signal I tend to look for shorts.
Bonus indicators
There are 2 bonus indicators included in this strategy. These are "bonus" indicators as I haven't had a long enough time to backtest them. They are based off my own strategies that I apply when trading. The bonus indicators have been highly succesful in the past though they are a bit more experimental.
Bonus indicator 1: Pivot strategy
Pivot points is a powerful indicator that Bitcoin tends to be very reactive to. The pivot strategy tries to determine if Bitcoin is in a bulltrend/beartrend. If Bitcoin is inside a bulltrend it will look to buy on pivot points . If the price is in a beartend it'll be looking to sell on pivot points .
Pivot strategy only works on 1HR timeframe, optimized on BYBIT:BTCUSD
Bonus indicator 2: Volume strategy
Volume strategy tries to look for large spikes of volume , once price breaks under this volume spike it'll try to buy/sell. The theory is that large volume spikes are traders getting stopped out on their leverage positions. By buying under these spikes it tries to counter trade these small price sqeeuzes.
Volume strategy only works on 1HR timeframe, only works on BYBIT:USD
Cerca negli script per "volume"

Profit Harvester System
(1) Strategy Introduction
- This is a profit harvesting system, an optimized high frequency trading strategy, by invitation only
- It can achieve a stable average annual return and is suitable for most crypto-currency markets
- It is recommended that the initial capital of one crypto-currency pair is greater than 2000 USDT
- You need to bear some floating loss, but don't worry, the strategy will stop profit and reduce positions automatically
- Support leverage from 1 to 5 times, but note that there is a strong leveling risk when leverage is greater than 1 times
- Support strategy alerts. You can add alerts at the top of the trading panel
(2) Parameters
- Indicator Resolution
- Min Resolution (Minutes) : The resolution of the indicator, i.e. the interval for updating the indicator, default 240 minutes
- MA Trending Line
- Draw Trending Line? : Draw trend lines to determine the long/short direction
- Moving Average Type : Type of moving average, default is SMA
- Moving Average Period : The period of the moving average, SMA30 by default
- Normalized On Balance Volume
- Draw Normalized On Balance Volume? : Plot the normalized OBV to show the volume/price relationship
- Moving Average Type : Type of moving average, default is EMA
- Moving Average Period : The period of the moving average, EMA21 by default
- Sigma of Normalized On Balance Volume : Upper and lower range of normalized OBV for determining the energy of the volume/price relationship
- Trading settings
- What Trades Should Be Taken? : The trading direction, supports long only, short only or no trade
- Maximum Shares of Position : The maximum number of shares of the position, i.e. the initial capital (default is 2000) is divided into that number of shares equally
- First Shares on Entrying Position : The number of shares occupied when entrying position to avoid missing the trend market
- Profit Ratio for Average Entry Price : Close all positions and cancel all orders when the current price exceeds the average position price and the profit rate is reached
- Increase Ratio for Next Share : Equal proportion of the order price when adding position
- Trading Leverage (Risk Term) : Trading leverage supports from 1 to 5 times, 2 by default. However, there is a strong leveling risk when the leverage is greater than 1!
- Max Floating Loss of Equity (Risk Term) : How much do you wanna risk. When the max floating loss threshold is reached, the position will be closed and all orders will be canceled!
- Price Trail Stop : Whether enable price trail stop mode to obtain more profits
(3) About usage
- This strategy is by invitation only. If you are interested in this strategy or would like to use it, please leave a message
- The default parameters is suitable for VETUSDT, MATICUSDT, ATOMUSDT, XRPUSDT and so on
- It is highly recommended to use long-only direction rather than short-only direction because the market will not go down forever
(4) Exceptions
- When "Increase Ratio for Next Share" is too small and "Maximum Shares of Position" is too large, there may be an error that the number of orders exceeds 9000, which is caused by the limitation of tradingview itself
Happy trading and enjoy your life!
————————————————————————————————————————
(1) 策略简介
- 这是一个利润收割系统,一种优化的高频交易策略,仅限受邀请使用
- 可以达到稳定的平均年化收益率,且适用于大部分数字货币市场
- 建议单个数字货币交易对的基础资金大于2000USDT,避免单笔交易资金低于最低交易资金限制
- 需要您承受一定的浮亏,但是不用担心,本策略会自动执行止盈和解套
- 支持1至5倍的杠杆,但是需要注意,杠杆大于1倍时存在爆仓风险
- 支持策略提醒,在交易面板上方添加策略提醒即可
(2) 参数说明
- Indicator Resolution
- Min Resolution (Minutes) : 指标的分辨率,即更新指标的间隔,默认240分钟更新1次
- MA Trending Line
- Draw Trending Line? : 是否需要绘制趋势线,用于判断多空方向
- Moving Average Type : 移动平均线的类型,默认为SMA
- Moving Average Period : 移动平均线的周期,默认为240分钟下的30日均线
- Normalized On Balance Volume
- Draw Normalized On Balance Volume? : 是否需要绘制归一化OBV指标,该指标反应量价关系
- Moving Average Type : 移动平均线的类型,默认为EMA
- Moving Average Period : 移动平均线的周期,默认为240分钟下的21日均线
- Sigma of Normalized On Balance Volume : 归一化OBV的上下区间,用于判断量价关系的能量
- Trading settings
- What Trades Should Be Taken? : 代表可以交易的方向,支持仅多头、仅空头或不交易
- Maximum Shares of Position : 仓位的最大份数,即将初始资金(默认为2000)等分为该份数的资金
- First Shares on Entrying Position : 当开仓后,首仓占用的份数,以避免错过趋势行情
- Profit Ratio for Average Entry Price : 当前价格大于仓位均价,并达到该收益率时,关闭所有仓位并取消所有挂单
- Increase Ratio for Next Share : 等比加仓的价格比例
- Trading Leverage (Risk Term) : 交易杠杆,支持1-5倍杠杆,默认为2倍杠杆,但是杠杆大于1倍时存在爆仓风险!
- Max Floating Loss of Equity (Risk Term) : 自开仓开始,您愿意承受的最大浮亏,当达到该浮亏后,仓位全平并取消所有订单!
- Price Trail Stop : 是否启用尾单止盈模式,以收割更多的利润
(3) 使用说明
- 该策略仅限受邀请使用,如果您对该策略感兴趣或者想要使用我的脚本,请给我留言
- 默认参数适用于 VETUSDT MATICUSDT ATOMUSDT XRPUSDT 等交易对
- 强烈建议使用多头交易而不是空头交易,因为市场不会永远下跌
(4) 异常情况
- 当"Increase Ratio for Next Share"设置过小而"Maximum Shares of Position"设置过大时,可能会出现订单数量超过9000的错误,这是tradingview本身的限制导致的
祝大家交易愉快

Co-relation and St-deviation Strategy - BNB/USDT 15minThis indicator based on statistical analysis. it uses standard deviation and its co-relation to price action to generate signals. and following indicators has been used to calculate standard deviation and its co-relation values. finally it is capable to identify market changes in bottoms to pic most suitable points.
1. Parabolic SAR (parabolic stop and reverse)
2. Supertrend
3. Relative strength index (RSI)
4. Money flow index (MFI)
5. Balance of Power
6. Chande Momentum Oscillator
7. Center of Gravity (COG)
8. Directional Movement Index (DMI)
9. Stochastic
10. Symmetrically weighted moving average with fixed length
11. True strength index (TSI)
12. Williams %R
13. Accumulation/distribution index
14. Intraday Intensity Index
15. Negative Volume Index
16. Positive Volume Index
17. On Balance Volume
18. Price-Volume Trend
19. True range
20. Volume-weighted average price
21. Williams Accumulation/Distribution
22. Williams Variable Accumulation/Distribution
23. Simple Moving Average
24. Exponential Moving Average
25. CCI (commodity channel index)
26. Chop Zone
27. Ease of Movement
28. Detrended Price Oscillator
29. Advance Decline Line
30. Bull Bear Power

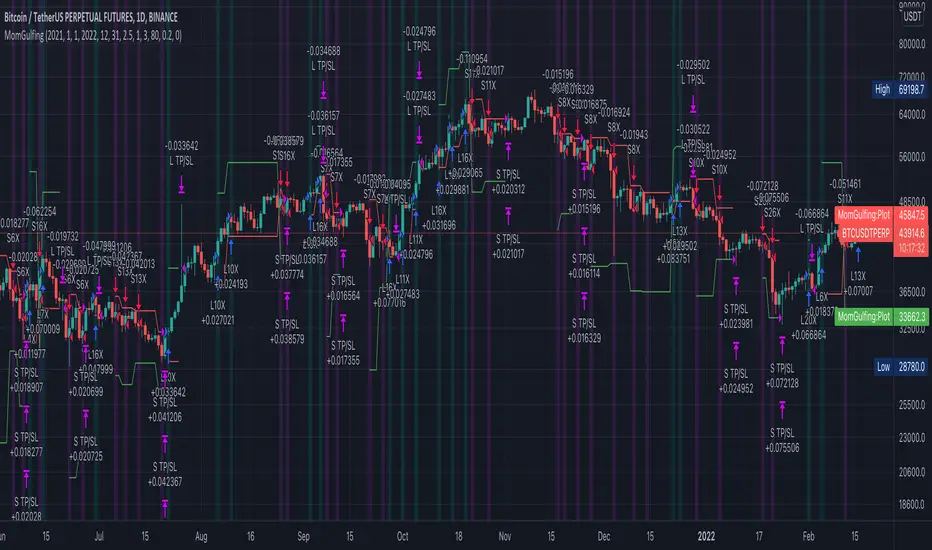
MomGulfingLong Position Rules:
RED -> GREEN,
Green close > previous red high,
Green candle volume > previous red candle volume
or
RED -> GREEN -> GREEN
First green close < previous red high,
Second green close > previous red high,
Second green candle volume > previous red candle volume
or
RED -> GREEN -> GREEN -> GREEN
First green close < previous red high,
Second green close < previous red high,
Third green close > previous red high,
Third green candle volume > previous red candle volume
Short Position Rules:
GREEN -> RED,
Red close < previous green low,
Red candle volume > previous green candle volume
or
GREEN -> RED -> RED
First red close > previous green low,
Second red close > previous green low,
Second red candle volume > previous green candle volume
or
GREEN -> RED -> RED -> RED
First red close > previous green low,
Second red close > previous green low,
Third red close < previous green low,
Third red candle volume > previous green candle volume
Risk Management:
First bar's low/high stop loss level
RR:2.5 take profit level
Leverage: 80/percent(stop level)
Pyramiding: 3
Update tp/sl at every signal
Alpha Candle Breakout Signal on Momentum from Support Resistance
Hello traders,
Let’s start with a brief description of what this strategy/indicator is and what it does and how we trade based on Alpha Candles.
The definition of an Alpha Candle is that it is mathematically calculated, and significantly bigger than the previous candles. This could be a green candle or a red candle, as long as the body is significantly bigger than the previous candles at the end of the calculation. All calculations are done in real time, we do NOT paint the candle sticks after the close of the candle and do not use offset values. This is extremely important. You will see the candle changing it's color as the body of the candle gets bigger with real time data feed. (Recalculate On Every Tick is ON by default). Now besides the mathematical calculations, an Alpha Candle also represents the emotion in the market for that stock in that moment. We can also say that an Alpha Candle is a change in the momentum.
Now that we’ve identified the Alpha candle, the second step is, to have a look at the chart and identify if the Alpha candle is breaking to a new high / low from a consolidation period, or from a good chart pattern (ascending / descending triangle , pennant , sideways consolidation) or a sudden direction change of the stock (bounce). Remember, the script will paint all Alpha candles regardless.
NVAX day trading example
Forex
Crypto
PLUG (Bounce example)
The script will identify the Alpha candles that are breaking to a new high / low from a user input look back period (default is 20 bars back, but this can be changed by the user input). An Alpha candle that breaks the look back period, will have a stop loss line below for Green Alpha or above for Red Alpha Candle and reward targets, like target1 or target2 (both are user input fields, can be adjusted to personal R values, default values are 2R and 3R)
A 2R means two times the reward (profit) of a 1-unit risk. If you are comfortable of loosing $50 per trade which will be considered 1-unit, then 2R means $100 reward (profit) target and a 3R is $150 reward (profit) target. Those R values will be plotted and/or labelled on the chart with dollar amounts if desired. You can change your R values from the user input area, even with decimal points, like 2.5R or 3.75R. If you shoot for at least 2R, you could be wrong 6 times out of 10, and still make 2R profit, as long as the other 4 trades give you a total of 8R. This is a basic trading concept. It will force the new traders to focus on risk/reward rather then a gambling attitude.
The script is meant to work with candle stick chart patterns only, it is NOT meant to work with ranges, line charts or point and figure charts. It will work with time frames like (seconds,1,2,3,5,10 minute or any minutes, daily, weekly). If you are trading IPOs , there might not be enough data for the script to do the calculation, so just be aware.
The script will identify the candles if they are Green Alpha (going up, bullish ) or Red Alpha (going down, bearish ). In order to see them clearly, we’ve greyed out the rest of the candles, and made Green Alpha candles white, and Red Alphas are left as red. You can change the colors from the user input area.
There is also a look back period, between 1-55 and the initial value is 20 for Green Alpha and 10 for Red Alpha. So, if the Alpha Candle breaks this look back period, it will be considered as an opportunity to take the trade. The code will put the stop loss area, possible target1 and target2 areas with a blue diamond and will draw the resistance/support lines for that Alpha candle. Depending on the individual’s risk tolerance, a label on the right side of the screen will show the risk tolerance (user input value) and the number of shares to be traded based on the risk tolerance (# of shares will be for the last Alpha Candle that is formed, it will constantly update itself with the new Alpha Candle)
For those who might be familiar with the three-bar play, we implemented something similar, so the code will find them in real time. Once an Alpha Candle is formed, if the following candle is a very small candle, also called pin bar , it will be painted to orange, so you can see it clearly. This pin bar is significantly smaller than the previous candles and formed right after an Alpha Candle.
Like anything in life, nothing is free. Meaning you have to work for it. So if you are looking to buy/sell blindly based on some indicators and signals, please do not consider this script. However, once you start using it, you will see how patterns repeat, when they repeat and how they repeat. It will identify the action, but you have to check the validity from the charts, so user discretionary is advised. As an example, if the Alpha candle is breaking from a consolidation period at $10. Let’s assume stop loss is at $9 so the 2R target will be $12, but if there is a possible resistance at $11, then the trader has to decide to take the trade for a possible 1R return, or skip the trade.
We try to approach the trading as a set of rules and processing the trades one by one, with a calculated risk and reward. This script will give you the Candle stick formation that is worth consideration and will draw the Stop Loss area (you can tweak this to your liking), will draw the 2-3R Targets, and will calculate the number of shares to be purchased based on the Risk Tolerance user entered in the user input area. The rest is to let the trade take care of it self.
Charts and patterns work better, when there is enough volume in a particular stock. If the stock is trading very low in volume , things will not work as expected. So, we must focus on the abnormal stocks, like gap gainers, volume gainer stocks, or heavily traded stocks (for intraday trading). For swing or long-term traders, one could look for a Green Alpha candle, assess the risk and possible return and trade the plan on a daily chart pattern (long term), or 15,30,60 min charts for swing trades.
If you are looking to short a stock, look for stocks that are weak (gap downs), so look for Red Alpha formations in that stock.
Once the back testing is turned on, code will generate buy/sell signals, otherwise it will work as an indicator. But please keep in mind….. For day trading, the stock has to be abnormally trading, so the chart patterns and the Alpha Candles work correctly. Volume has to be more than usual. It is the best way to have predictable results for day trading. If the volume of the stock is 2-5 times or more than the average of 20 days period (early in the morning), and even more later in the day, it is a good indication that the stock is trading on an abnormal volume with some news (pre-market abnormality is a good sign for possible abnormality for that stock).
For back testing, user can select from the user input area :
• Long or Short Trades or both or use the script as an indicator
• Close any open position if an Alpha candle forms in the opposite direction
• Pyramid the trades up to 4 levels (allow to buy/sell 4 times in the same direction every time another Alpha Candle forms)
• Breakout/breakdown look back period (every time an Alpha Candle forms and breaks this look back period, it will be a trade opportunity)
• Target Reward areas
• Stop Loss area
• Time frame (change the time frame and observe which time frame made good profit. Test the plan for future trades. Test it in as many abnormal stocks for the day they were behaving abnormal as possible). Time frame is not a user input field, just the time frame of the chart, 2,5,10 min, 1 hour etc.
• Selective date testing (between two dates/times). This is very important as most of the good opportunities comes from abnormal price action with volume . If you back test with the maximum amount of data for that abnormal stock on that day, it will produce unrealistic results, because the stock will have a normal course of trend before the news. Remember, we are looking for stocks that are trading abnormal in both price and volume or stocks like AAPL , TSLA which are trading heavily on each day. It is also a good way to learn, how and when to buy/sell, where to put stop losses by observing the chart with the Alpha Candles showing the results.
• All the above values will have an impact on the total profit / loss.
F (Ford Motors)
Now that we’ve covered what the script does, let’s plan the trade and trade the plan.
Side Note:
-------------
We started coding this as an indicator to show the Alpha Candles to find opportunities in the market. Later in the development, we implemented it as a Strategy, to be able to back test the ideas, to tweak some rules for entry/exit and see the effects on our profit/loss percentages in general. We kept the original idea being an Indicator, to show us the Alpha Candles in real time. This requires the option “Indicator Mode” is to be selected from the User Input area, and leaving the “Recalculate On Every Tick” is selected from the Properties tab of the strategy (as of Pine Script v5). Strategy is turning this “On” by default.
Disclaimer: This script is an educational and personal use only tool and should be used accordingly. User can not publish any images created with this code. Do your own due diligence, do not buy / sell stocks based on any indicator, always use stop losses. We do not make any promises as this indicator or any indicator will make you a profitable trader. Trading and technical analysis is difficult, it takes time to build confidence and experience. Study the charts and candlestick formations. Study support/resistance areas and how to identify them. This will help you to tweak the script’s stop loss areas and 2R-3R targets. Do not invest any money you are not comfortable loosing.
This is an invite only strategy. We will give ample time to test it out. After that you will need to subscribe. To get access to this strategy trader can send me an email from the links below.
All the Best
Happy Trading

3Commas DCA Bot Strategy v1.0Introduction
The strategy attempts to implement a majority all of the settings found on the 3Commas DCA Bot setting page that can be implemented within a TradingView indicator. Specifically, it will implement the "Open new trade ASAP" and "Trading View Custom Signal" deal start conditions. In this way, you can leverage the power of TradingView's backtester to model your settings and analysis past performance as well as leverage TradingView's alert notification subsystem to send Deal Start and Close signals to 3Commas using almost any of the thousands of scripts found in the Public Library (see "What does it do and how does it do it?" section below for more information on how to do this using the RSI indicator as an example).
How is it original and useful?
This strategy is unique in that it's the only one (as of the initial publications) that can handle 28 out of 32 bot settings (88% coverage) that are found on the 3Commas bot settings page. In addition, because it is a TradingView script, you will benefit from the following:
Model your bot's configuration using the backtester on any timeframe and evaluate its performance using the chart's history.
View a table of detailed statistics pertaining to deals started and completed, win/loss rates, daily P&L, true max drawdown, and detailed statistics on bars in deal along with safety orders filled.
View a table of "Used amount for each step" as presented in 3Commas as well.
Ability to link to almost any TradingView chart indicator that provides a single data point for buy/sell signals.
Make use of the 3Commas TA Start Conditions indicator to emulate the 3Commas built-in indicators for further performance evaluation with the backtester.
How does it compare to other scripts in the Public Library?
This strategy offers a very detailed, comprehensive settings and maybe the only one (as of the initial publication) that can handle 28 out of the 32 bot settings that are found on the 3Commas bot settings page (that can be handled within TradingView, because some cannot be modeled due to chart and language constraints). Specifically, the following 3Commas bot settings and inputs are addressed with asterisks denoting specific limitation due to TradingView's platform architecture and/or constraints:
Main settings
✅ Name
❌ Exchange* (Not handled since it is inherited from chart)
⚠ Bot type* (Only Single-pair because you simply apply the indicator to as many pairs you desire in separate charts to simulate a Multi-pair setting)
Pairs
❌ Pairs* (Not handled since it is inheriting the symbol from the chart)
Strategy
✅ Strategy
❌ Profit currency* (Not handled since there is no equivalence in TradingView)
✅ Base order size / unit
✅ Safety order size / unit
✅ Start order type
Deal start condition
⚠ TradingView* (You can modify the "Technical Rating" indicator by TradingView to output a signal yourself like @TheTradingParrot has done in the TV signal for DCA backtest script)
⚠ QFL* (See Quickfingers Luc's Base Breaking Strategy v2.5 - 3Commas Edition for an alternative)
❌ Manually/API* (Not handled since there is no equivalence in TradingView)
✅ Trading View custom signal
✅ Open new trade asap
Take profit
✅ Take profit (%)
✅ Take profit type
✅ Trailing
⚠ Trailing deviation* (modified to handle TradingView's broker emulator properly)
Stop loss
✅ Stop Loss (%)
✅ Stop Loss action
⚠ Stop Loss timeout* (modified to use "bars" as the unit of measure)
Safety orders
✅ Max safety trades count (a total of 100 safety orders are supported!)
⚠ Max active safety trades count* (Not handled since there is no equivalence in TradingView)
✅ Price deviation to open safety orders (% from initial order)
✅ Safety order volume scale
✅ Safety order step scale
Advanced settings
✅ Don't start deal(s) if the daily volume is less than
✅ Minimum price to open deal
✅ Maximum price to open deal
⚠ Deal start delay (QFL and standard TV signals only)* (modified to use "bars" as the unit of measure)
✅ Cooldown between deals
✅ Open deals & stop
Close deal after timeout
⚠ The time after which, deal will be closed automatically* (modified to use "bars" as the unit of measure)
In addition to the above inputs, the script will also support the same output data points that are found on the bot settings page, which are:
Assistant
✅ Balance
✅ Max amount for bot usage (Based on current rate)
✅ Max safety order price deviation
✅ % of available balance to be used by the bot
Table (Used amount for each step)
✅ Order No.
✅ Deviation %
✅ Order Size (Base currency)
✅ Order Volume (Quote currency)
✅ Price
✅ Average price
✅ Required price
✅ Required change
✅ Total Size (Base currency)
✅ Total Volume (Quote currency)
What does it do and how does it do it?
When applied to the chart for the first time, the default settings will work to execute the "Open new trade asap" deal start condition using a take profit of 4%, a base order size of 1.335% of equity (initial capital + net profit), a safety order size of 2.003% of equity (initial capital + net profit), a safety order volume scale of 1.5, a safety order step scale of 1.21, and a max safety trades count of 8. With these settings, as you scroll through the chart's history you should see price action crossing the DCA layers (denoted with blue triangles), and a green take-profit price line will render (with green triangle denoting the crossings). Lastly, in the upper-right corner of the chart the table of DCA statistics will render showing you all the gathered data that took place since the chart's starting history until the current time.
Using the "TV Custom Signal" section will allow you to "link" other chart indicators to supply "Start" and "Close" signals for the script. For example, here's how you can use the standard RSI indicator to generate an entry signal:
1) Add the stock RSI indicator and configure it to your desire.
2) Select the "RSI" indicator in the "Chart/Indicator Data Point" input.
3) Select "Chart/Indicator Data Point" in the "Start Deal When" input.
4) Select "Less Than" in the "Is" input.
5) Select "Custom Value(s)" in the "The Value Of" input.
6) Enter "25" in the "Custom Value 1 (Single or Lower Bound)" input.
7) Select "Trading View Custom Signal" in the "Open new trade" input (in the DEAL START CONDITION section).
8) Lastly, check the checkbox with a horizontal straight line above the "Start Deal When" input.
This means that the indicator will start a deal when the "RSI indicator" is "Less Than" the value of "25".
Strategy Results
The default settings are designed to ensure that the indicator will render chart elements when first loaded as well as to allow the backtester to gather order executions and display performance summary. The chart above is is using $10,000 initial capital, a commission rate of 0.1% for both entries and exits, and a 1 tick slippage setting. It is also using 3.22581% of the equity for the Base Order Size, 6.45161% of equity for the first Safety Order Size. The Maximum Safety Trade Count is 4 with a Safety Order Volume Scale of 2, a Safety Order Step Scale of 1.53, Price Deviation To Option Safety Orders at 5.3, and a take profit of 4.5% with Trailing turned on at a deviation of 1.5%. All other settings are defaults.
It is recommended that the indicator be "tuned" for your specific market in order to best implement the strategy and obtain better desirable results. You do so by using the backtester and statistics table and observe the output values and learn how the indicator is performing in the chart history. Using this information, you can adjust the settings accordingly until you find the settings acceptable to your trading goals and risk tolerance.
Always keep in mind that past performance may not be indicative of future results. Settings that seem favorable for one market may be found to be disastrous in another. Therefore, do take the time needed to understand how the settings will behave with the given chart symbol.
Enjoy! 😊👍
How to obtain access to the script?
You have two choices:
Use the "Website" link below to obtain access to this indicator, or
Send us a private message (PM) in TradingView itself.

Quickfingers Luc's Base Breaking Strategy v2.5 - 3Commas EditionIntroduction
The strategy attempts to implement a popular price action strategy by Luc Thomas (a.k.a. Quickfingers Luc) typically referred to as a QFL base-breaking strategy specifically for the 3Commas platform. The Input settings have been redesigned to match the same inputs as the 3Commas My Bot Settings page. Only the "Deal Start Condition" section will echo the required QFL-related settings found in the original Quickfingers Luc's Base Breaking Strategy v2.5 to successfully implement the strategy.
The strategy revolves around price action movements that reveal “bases”, which are price levels of support that have a significant, rapid price surges called “bounces”. Once a base is revealed, the base price level is used as reference to implement multiple entries below the base using a layering technique of dollar-cost averaging to place multiple limit orders at various price levels below the base price. As price action breaks below the base price, the limit orders will be filled, and the take profit, breakeven and stop loss prices will be recalculated.
How is it original and useful?
This strategy is unique in that the strategy version fully supports the TradingView backtester, which will enable you to perform experiments with various settings to evaluate performance using the historical chart data. The study version implements the "Start Deal" and "Close Deal" alerts for you to integrate with 3Comma's "Trading View Custom Signal" start condition. Both script versions will provide the same configuration abilities. The following list is a brief description of its usefulness:
The ability to define the QFL base confirmation settings, including volume analysis.
The ability to define your preferred layering strategy of either dollar-cost averaging (DCA) or grid-like layers along with precise layer placement.
The ability to define your trading parameters like take profit and stop loss offsets, exchange commission rates, trading start time, and position size multiplication for each layer.
The ability to define flexible trade eligibility rules that can use other chart indicators, like RSI or EMA, to exclude the selection of base prices for trading.
The ability to set the visibility & color theme of the detailed statistics from the chart history pertaining to trading sessions started and closed, session durations, win rate, price action drops and bounces, as well as layer utilization.
How does it compare to other scripts in the Public Library?
The strategy offers a very detailed, comprehensive settings to implement the QFL base-breaking strategy ion 3Commas. The strategy version leverages the full features of the TradingView backtester to provide informative, detailed performance measurements surrounding this unique trading strategy. The study version will implement the latest alert framework called "Any Alert() Function" where you can create a single alert to handle multiple events, which include:
Deal Start
Deal Close
What does it do and how does it do it?
The strategy can be applied to any chart at any time frame, but the minimum should be no lower than 10 minutes. When applied to the chart for the first time, the default settings will work to render base price levels in orange and 8 DCA layers in thin blue lines. As you scroll through the chart's history you should see price action crossing the DCA layers, denoted with blue triangles, and a green take-profit line will render with green triangle denoting the crossing. Lastly, when a deal session begins upon the crossing of the first layer, the indicator will continue to identify base price levels, but the color of the price lines will be gray. When the trade session concludes upon the crossing of the take profit line, the indicator will switch the most recent base price line from gray to orange to make it active and eligible for trading.
As price action develops, the indicator will use the "Base Confirmation Settings" to look back by counting the number of bars to the left and right of a pivot low point, measure the price drops and bounces, and volume amounts to validate that they are within the specified values. If so, the indicator will draw an orange triangle beneath the candle bar to denote it as the pivot low point and begin rendering the orange line as the base price. The DCA layers will be calculated and offset relative to the base price using thin blue lines.
Optionally, the breakeven price line will be drawn to help visualize the true breakeven price which takes into consideration the exchange fees being applied. Base line, take profit, stop loss and DCA layer crossings will be denoted with colorful shapes to help visually recognize the events on the chart.
The volume is validated only at the pivot low candle. It will measure the volume against the moving average to determine base confirmation. A volume factor of 1 will mean that the volume must be at least the same value as the moving average value. A volume factor of 2 means it must be twice the moving average value.
Lastly, a table of statistics is positioned to the upper-right corner of the chart that summarize all the events that have taken place since the indicator began simulating deal sessions from the chart's history.
Strategy Results
The default settings are designed to define a "weak" QFL base to ensure that the indicator will render chart elements when first loaded as well as to allow the backtester to gather order executions and display performance summary. The strategy version is using $10,000 initial capital, a commission rate of 0.1% for both entries and exits, and a 1 tick slippage setting. It is also using 3.4881% of the equity for the Base Order Size, 4.7097% of equity for the first Safety Order Size. The Maximum Safety Trade Count is 7 with a Safety Order Volume Scale of 1.35, and a take profit of 5% with no stop loss. All other settings are defaults.
It is recommended that the indicator be "tuned" for your specific market in order to best implement the QFL trading strategy and obtain better desirable results. You do so by using the statistics table and observe the Mean Price Drop and Bounce values to learn what the indicator is detecting when it measures from the pivot low points. Using this information, you can adjust the Base Confirmation Settings accordingly, along with any volume specifications you require, to configure the indicator for the chart.
Always keep in mind that past performance may not be indicative of future results. Settings that seem favorable for one market may be found to be disastrous in another. Therefore, do take the time needed to understand how the settings will behave with the given chart symbol.
Enjoy! 😊👍
How to obtain access to the script?
You have two choices:
Use the "Website" link below to obtain access to this indicator, or
Send us a private message (PM) in TradingView itself.

Quickfingers Luc's Base Breaking Strategy v2.5Introduction
The strategy attempts to implement a popular price action strategy by Luc Thomas (a.k.a. Quickfingers Luc) typically referred to as a QFL base-breaking strategy. The strategy revolves around price action movements that reveal “bases”, which are price levels of support that have a significant, rapid price surges called “bounces”. Once a base is revealed, the base price level is used as reference to implement multiple entries below the base using a layering technique of dollar-cost averaging to place multiple limit orders at various price levels below the base price. As price action breaks below the base price, the limit orders will be filled, and the take profit, breakeven and stop loss prices will be recalculated.
How is it original and useful?
This strategy is unique in that the strategy version fully supports the TradingView backtester, which will enable you to perform experiments with various settings to evaluate performance using the historical chart data. The study version implements numerous custom alerts for you to build TradingView notifications around specific price action events and stay informed with market activity in real-time. Both script versions will provide the same configuration abilities where you can define:
Base confirmation settings, including volume analysis.
Your preferred layering strategy of either Dollar-cost averaging (DCA) or grid-like layers along with precise layer placement.
Your trading parameters like take profit and stop loss offsets, exchange commission rates, trading start time, and position size multiplication for each layer.
Flexible trade eligibility rules that can use other chart indicators, like RSI or EMA, to exclude the selection of base prices for trading.
The visibility of detailed statistics from the chart history pertaining to trading sessions started and closed, session durations, win rate, price action drops and bounces, as well as layer utilization.
How does it compare to other scripts in the Public Library?
The strategy offers a very detailed, comprehensive settings to address all types of markets found on TradingView where you can implement the QFL base-breaking strategy. The strategy version can be considered the first of its kind on TradingView to leverage the backtester to provide informative, detailed performance measurements surrounding this unique trading strategy. The study version will contain numerous custom alerts to aid in your notification preferences and stay informed on the indicator's activities:
Base Created
Base Cracked
Base Respected
Any Layer Cracked
Layer 1 Cracked
Layer 2 Cracked
Layer 3 Cracked
Layer 4 Cracked
Layer 5 Cracked
Layer 6 Cracked
Layer 7 Cracked
Layer 8 Cracked
Layer 9 Cracked
Layer 1 Respected
Layer 2 Respected
Layer 3 Respected
Layer 4 Respected
Layer 5 Respected
Layer 6 Respected
Layer 7 Respected
Layer 8 Respected
Take Profit Crossed
Stop Loss Crossed
What does it do and how does it do it?
It is recommended that you start with a chart that is on an hourly timeframe with the "Scale Price Chart Only" chart setting enabled. When applied to the chart for the first time, the default settings will work to render base price levels in orange and 8 DCA layers in blue using a Fibonacci-like sequence for the deviation offset relative to the base price. As you scroll through the chart's history you should see price action crossing the DCA layers, denoted with blue triangles, and a green take-profit line will render with green triangle denoting the crossing. Lastly, when a trade session begins upon the crossing of the first layer, the indicator will continue to identify base price levels, but the color of the price lines will be gray. When the trade session concludes upon the crossing of the take profit line, the indicator will switch the most recent base price line from gray to orange to make it active and eligible for trading.
As price action develops, the indicator will use the "Base Confirmation Settings" to look back by counting the number of bars to the left and right of a pivot low point, measure the price drops and bounces, and volume amounts to validate that they are within the specified values. If so, the indicator will draw an orange triangle beneath the candle bar to denote it as the pivot low point and begin rendering the orange line as the base price. The DCA layers will be calculated and offset relative to the base price using thin blue lines.
Optionally, the breakeven price line will be drawn to help visualize the true breakeven price which takes into consideration the exchange fees being applied. Base line, take profit, stop loss and DCA layer crossings will be denoted with colorful shapes to help visually recognize the events on the chart.
The volume is validated only at the pivot low candle. It will measure the volume against the moving average to determine base confirmation. A volume factor of 1 will mean that the volume must be at least the same value as the moving average value. A volume factor of 2 means it must be twice the moving average value.
Lastly, the very last bar will render a table of statistics that summarize all the events that have taken place since the indicator began simulating trading sessions from the chart's history.
Strategy Results
The default settings are designed to define a "weak" QFL base to ensure that the indicator will render chart elements when first loaded as well as to allow the backtester to gather order executions and display performance summary. The strategy version is using $10,000 initial capital, a commission rate of 0.1% for both entries and exits, and a 1 tick slippage setting. It is also using 3.4887% of the equity with a Position Size Multiplier of 1.35, using 8 total DCA layers, and a take profit of 5% with no stop loss. All other settings are defaults.
It is recommended that the indicator be "tuned" for your specific market in order to best implement the QFL trading strategy and obtain better desirable results. You do so by using the statistics table and observe the Mean Price Drop and Bounce values to learn what the indicator is detecting when it measures from the pivot low points. Using this information, you can adjust the Base Confirmation Settings accordingly, along with any volume specifications you require, to configure the indicator for the chart.
Always keep in mind that past performance may not be indicative of future results. Settings that seem favorable for one market may be found to be disastrous in another. Therefore, do take the time needed to understand how the settings will behave with the given chart symbol.
Enjoy! 😊👍
How to obtain access to the script?
You have two choices:
Use the "Website" link below to obtain access to this indicator, or
Send us a private message (PM) in TradingView itself.

Zendog V2 backtest DCA bot 3commasHi everyone,
After a few iterations and additional implemented features this version of the Backtester is now open source.
The Strategy is a Backtester for 3commas DCA bots. The main usage scenario is to plugin your external indicator, and backtest it using different DCA settings.
Before using this script please make sure you read these explanations and make sure you understand how it works.
Features:
- Because of Tradingview limitations on how orders are grouped into Trades, this Strategy statistics are calculated by the script, so please ignore the Strategy Tester statistics completely
Statistics Table explained:
- Status: either all deals are closed or there is a deal still running, in which case additional info
is provided below, as when the deal started, current PnL, current SO
- Finished deals: Total number of closed deals both Winning and Losing.
A deal is comprised as the Base Order (BO) + all Safety Orders (SO) related to that deal, so this number
will be different than the Strategy Tester List of Trades
- Winning Deals: Deal ended in profit
- Losing deals: Deals ended with loss due to Stop Loss. In the future I might add a Deal Stop condition to
the script, so that will count towards this number as well.
- Total days ( Max / Avg days in Deal ):
Total Days in the Backtest given by either Tradingview limitation on the number of candles or by the
config of the script regarding "Limit Date Range".
Max Days spent in a deal + which period this happened.
Avg days spent in a deal.
- Required capital: This is the total capital required to run the Backtester and it is automatically calculated by
the script taking into consideration BO size, SO size, SO volume scale. This should be the same as 3commas.
This number overwrites strategy.initial_capital and is used to calculate Profit and other stats, so you don't need
to update strategy.initial_capital every time you change BO/SO settings
- Profit after commission
- Buy and Hold return: The PnL that could have been obtained by buying at the close of the first candle of the
backtester and selling at the last.
- Covered deviation: The % of price move from initial BO order covered by SO settings
- Max Deviation: Biggest market % price move vs BO price, in the other direction (for long
is down, for short it is up)
- Max Drawdown: Biggest market % price move vs Avg price of the whole Trade (BO + any SO), in the other
direction (for long price goes down, for short it goes up)
This is calculated for the whole Trade so it is different than List of Trades
- Max / Avg bars in deal
- Total volume / Commission calculated by the strategy. For correct commission please set Commission in the
Inputs Tab and you may ignore Properties Tab
- Close stats for deals: This is a list of how many Trades were closed at each step, including Stop Loss (if
configured), together with covered deviation for that step, the number of deals, and the percentage of this
number from all the deals
TODO: Might add deal avg value for each step
- Settings Table that can be enabled / disabled just to have an overview of your configs on the chart, this is a
drawn on bottom left
- Steps Table similar to 3commas, this is also drawn on bottom left, so please disable Settings table if you want
to see this one
TODO: Might add extra stats here
- Deal start condition: built in RSI-7 or plugin any external indicator and compare with any value the indicator plots
(main purpose of this strategy is to connect your own studies, so using external indicator is recommended)
- Base order and safety orders configs similar to 3commas (order size, percent deviation, safety orders,
percent scale and volume scale)
- Long and Short
- Stop Loss
- Support for Take profit from base order or from Total volume of the deal
- Configs help (besides self explanatory):
- Chart theme: Adjust according to the theme you run on. There is no way to detect theme at the moment.
This adjust different colors
- Deal Start Type: Either a builtin RSI7 or "External indicator"
- Indicator Source an value: If using External Indicator then select source, comparison and value.
For example you could start a deal when Volume is greater than xxxx, or code a custom indicator that plots
different values based on your conditions and test those values
- Visuals / Decimals for display: Adjust according to your symbol
- BO Entry Price for steps table: This is the BO start deal price used to calculate the steps in the table

Companion::DivergentCompanion::Divergent is a combined indicators strategy optimized for Bitcoin Markets and tested on Bitfinex.
Mainly, it is an Ichimoku based strategy.
Used indicators:
- Ichimoku (displayed on chart): trendline analysis;
- Double Hull MA (displayed on chart): trendline analysis;
- MACD (not displayed): confirmative/momentum detection;
- CCI (not displayed): confirmative/momentum detection;
- ATR: used toghether with Ichimoku to determine Stop Loss/Take Profit levels;
- VWMA: For implementing trailing stop orders based on volumes.
What the script does:
- determines trendlines combining mulitple indicators;
- automaticlally calculates Take profit and Stop Loss levels;
- permits automation generating Autoview signals;
- supports for margin trading. Spot trading will be added in the future.
It can be used on 1D or 1H timeframes but it can be adapted for other time frames tweaking the parameters. I used it a lot on Bitfinex on 1H timeframes. Please check parameters: if you will use the strategy on D or higher timeframes, the "Legacy Chikou analysis" option should be checked.
BACKTESTING
Backtest is not leveraged. Defaults are set as follow:
Capital: 10000
Percent of equity used for trades: 10%
Commission: 0.18% this is Bitfinex commission on orders
Change them accordingly on how you trade to get a more realistic backtest results.

RePaNoCHa [Backtest]This is a very long script and adjusting the settings can be a bit slow so I share some settings. (these may be even better)
It has no security() and no Heikin Ashi so no repaint and Backtest is real.
It's important to adjust correctly the tics/pips correction.
All timeframes but good results at 2H
Default settings for ETHUSD (BITMEX) 2H
Alerts version coming soon...
Enjoy!!!
"Este script es la repanocha"
XBTUSD (BITMEX)
Timeframe = 2H
Position Side = BOTH
Source = hlc3
T3 == true
T3 Length = 8
T3 Volume Factor = 0.9
Range Filter+ADX == true
Sampling Period = 16
Range Multiplier = 1.3
Flat Market Trades == true
ADX lenght = 10
ADX Threshold = 20
Parabolic SAR == true
SAR start = 0.03
SAR inc = 0.02
SAR max = 0.3
Pyramiding = 15
Trailing Stop Activation % = 0.5
Trailing Stop Offset % (when profit=0.5 %) = 0.2
Trailing Stop Offset % (when profit=10 %) = 1.2
Stop Loss = 3.2
Tics/Pips Correction = 10
Initial Capital = 1000
Quantity = 100 %
Commission value = 0.075 %
ETHUSD (BITMEX)
Timeframe = 2H
Position Side = BOTH
Source = hlc3
T3 == true
T3 Length = 6
T3 Volume Factor = 0.7
Range Filter+ADX == true
Sampling Period = 10
Range Multiplier = 0.9
Flat Market Trades == true
ADX lenght = 11
ADX Threshold = 19
Parabolic SAR == true
SAR start = 0.06
SAR inc = 0.07
SAR max = 0.15
Pyramiding = 15
Trailing Stop Activation % = 0.5
Trailing Stop Offset % (when profit=0.5 %) = 0.25
Trailing Stop Offset % (when profit=10 %) = 1.5
Stop Loss = 3.2
Tics/Pips Correction = 100
Initial Capital = 1000
Quantity = 100 %
Commission value = 0.075 %
BNBUSDT (BINANCE)
Timeframe = 2H
Position Side = LONG
Source = hlc3
T3 == true
T3 Length = 6
T3 Volume Factor = 0.7
Range Filter+ADX == true
Sampling Period = 17
Range Multiplier = 1.3
Flat Market Trades == true
ADX lenght = 5
ADX Threshold = 18
Parabolic SAR == true
SAR start = 0.04
SAR inc = 0.03
SAR max = 0.25
Pyramiding = 15
Trailing Stop Activation % = 0.5
Trailing Stop Offset % (when profit=0.5 %) = 0.25
Trailing Stop Offset % (when profit=10 %) = 1.5
Stop Loss == false
Tics/Pips Correction = 10000
Initial Capital = 1000
Quantity = 100 %
Commission value = 0.075 %
LTCUSDT (BINANCE)
Timeframe = 2H
Position Side = LONG
Source = hlc3
T3 == true
T3 Length = 3
T3 Volume Factor = 1
Range Filter+ADX == true
Sampling Period = 11
Range Multiplier = 1.1
Flat Market Trades == true
ADX lenght = 6
ADX Threshold = 22
Parabolic SAR == true
SAR start = 0.07
SAR inc = 0.04
SAR max = 0.15
Pyramiding = 15
Trailing Stop Activation % = 0.5
Trailing Stop Offset % (when profit=0.5 %) = 0.25
Trailing Stop Offset % (when profit=10 %) = 1.5
Stop Loss == false
Tics/Pips Correction = 100
Initial Capital = 1000
Quantity = 100 %
Commission value = 0.075 %
TRXUSDT (BINANCE)
Timeframe = 2H
Position Side = LONG
Source = hlc3
T3 == true
T3 Length = 7
T3 Volume Factor = 1
Range Filter+ADX == true
Sampling Period = 8
Range Multiplier = 1.1
Flat Market Trades == true
ADX lenght = 4
ADX Threshold = 22
Parabolic SAR == true
SAR start = 0.07
SAR inc = 0.04
SAR max = 0.15
Pyramiding = 15
Trailing Stop Activation % = 0.5
Trailing Stop Offset % (when profit=0.5 %) = 0.25
Trailing Stop Offset % (when profit=10 %) = 1.5
Stop Loss == false
Tics/Pips Correction = 100000
Initial Capital = 1000
Quantity = 100 %
Commission value = 0.075 %
NAS100 (OANDA)
Timeframe = 2H
Position Side = BOTH
Source = hlc3
T3 == true
T3 Length = 3
T3 Volume Factor = 1
Range Filter+ADX == true
Sampling Period = 12
Range Multiplier = 1.3
Flat Market Trades == true
ADX lenght = 18
ADX Threshold = 21
Parabolic SAR == true
SAR start = 0.08
SAR inc = 0.06
SAR max = 0.25
Pyramiding = 15
Trailing Stop Activation % = 0.2
Trailing Stop Offset % (when profit=0.5 %) = 0.15
Trailing Stop Offset % (when profit=10 %) = 1
Stop Loss == false
Tics/Pips Correction = 10
Initial Capital = 1000
Quantity = 3 contracts
Commission value = 0.2 USD per contract
NATGAS(OANDA)
Timeframe = 2H
Position Side = BOTH
Source = hlc3
T3 == true
T3 Length = 3
T3 Volume Factor = 1
Range Filter+ADX == true
Sampling Period = 15
Range Multiplier = 1.3
Flat Market Trades == true
ADX lenght = 12
ADX Threshold = 21
Parabolic SAR == true
SAR start = 0.08
SAR inc = 0.06
SAR max = 0.4
Pyramiding = 15
Trailing Stop Activation % = 0.2
Trailing Stop Offset % (when profit=0.5 %) = 0.15
Trailing Stop Offset % (when profit=10 %) = 1
Stop Loss == false
Tics/Pips Correction = 1000
Initial Capital = 1000
Quantity = 4500 contracts
Commission value = 0.002 USD per contract
SPX500 (OANDA)
Timeframe = 2H
Position Side = BOTH
Source = hlc3
T3 == true
T3 Length = 4
T3 Volume Factor = 0.8
Range Filter+ADX == true
Sampling Period = 14
Range Multiplier = 1.3
Flat Market Trades == true
ADX lenght = 12
ADX Threshold = 17
Parabolic SAR == true
SAR start = 0.09
SAR inc = 0.04
SAR max = 0.2
Pyramiding = 15
Trailing Stop Activation % = 0.15
Trailing Stop Offset % (when profit=0.5 %) = 0.1
Trailing Stop Offset % (when profit=10 %) = 0.5
Stop Loss = 1.5
Tics/Pips Correction = 10
Initial Capital = 1000
Quantity = 8 contracts
Commission value = 0.2 USD per contract
US30 (OANDA)
Timeframe = 2H
Position Side = BOTH
Source = hlc3
T3 == true
T3 Length = 4
T3 Volume Factor = 0.9
Range Filter+ADX == true
Sampling Period = 11
Range Multiplier = 1.1
Flat Market Trades == true
ADX lenght = 16
ADX Threshold = 24
Parabolic SAR == true
SAR start = 0.08
SAR inc = 0.03
SAR max = 0.05
Pyramiding = 15
Trailing Stop Activation % = 0.15
Trailing Stop Offset % (when profit=0.5 %) = 0.075
Trailing Stop Offset % (when profit=10 %) = 0.5
Stop Loss = 1.5
Tics/Pips Correction = 10
Initial Capital = 1000
Quantity = 1 contracts
Commission value = 1.5 USD per contract
WHEAT (OANDA)
Timeframe = 2H
Position Side = BOTH
Source = hlc3
T3 == true
T3 Length = 3
T3 Volume Factor = 1.1
Range Filter+ADX == true
Sampling Period = 12
Range Multiplier = 0.9
Flat Market Trades == true
ADX lenght = 13
ADX Threshold = 21
Parabolic SAR == true
SAR start = 0.1
SAR inc = 0.05
SAR max = 0.15
Pyramiding = 15
Trailing Stop Activation % = 0.2
Trailing Stop Offset % (when profit=0.5 %) = 0.1
Trailing Stop Offset % (when profit=10 %) = 1
Stop Loss = 2.5
Tics/Pips Correction = 1000
Initial Capital = 1000
Quantity = 2500 contracts
Commission value = 0.003 USD per contract

PPSignal System Algorithm Introduction
System Algorithm based on historical price probabilities and volumes. We recommend use financial stock, bond, crypts, indices, futures and Forex market (GBPUSD, EURUSD, USDJPY, USDCAD, AUDUSD, USOIL, XAUUSD, SOYUSD, DXY, SPY, SP1!, bitcoin) with defined trends above 50 or 100 and 200 simple moving averages idem if you want trade downtrend financial assets.
Use projections and retracements Fibonacci, MACD and RSI or Stoch oscillator and figures charters Head and shoulder, triangles and double bottom, double top, etc.
This system will notify you of the probability of success. The profit will be defined for yourself and according to your investor profile.
There are stocks and other assets with high returns but the system does not know exactly. Check in the Strategy tester section and then net profit.
We have other tools that support to PPsignal system, we will publish them shortly.
Define system parameters
As it is a system that is based on past data we recommend using the most historical data weekly (W) but you an use day historical data or 3 o 2 hs.
Candle color: you can choose if you want a trend color for candles or not, in the chart propieties menu detach the border option.
PPsignal it's a very simple system with which you will have a great support when it is a good time for enter in the marker and out.
we await your comments.
Eng. Oscar Alejandro Peruchena
Quants Mathematical and Market Analyst
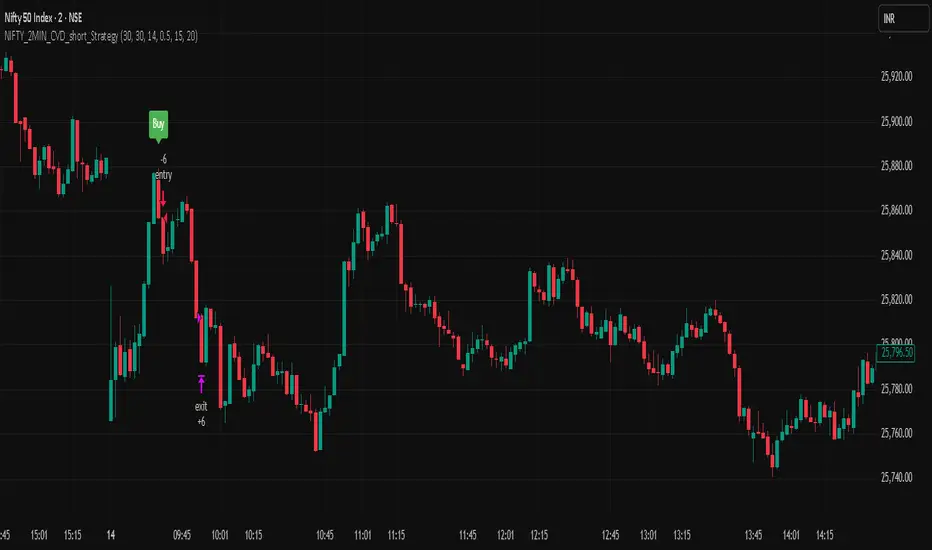
NIFTY_2MIN_CVD_short_StrategySummary
This strategy is an intraday system designed for the Nifty index on a 2-minute timeframe, focusing exclusively on identifying high-probability short (sell) entries. It utilizes a combination of rapid price action and Cumulative Volume Delta (CVD) to detect "Buying Absorption" at local peaks.
Concept & Core Logic
The strategy is engineered to identify "Inverted V-shaped" reversals where aggressive buying pressure is exhausted and absorbed by large-scale limit orders from sellers.
Price Action Trigger: The strategy looks for a specific two-part sequence:
Sudden Bullish Movement: A rapid upward move that often traps late buyers or triggers short-covering.
Sudden Reversal: Immediately followed by a strong, high-momentum bearish (red) candle, signaling a swift rejection of the higher prices.
CVD Absorption Filter: To confirm the validity of the reversal, the strategy analyzes the Cumulative Volume Delta (CVD). It identifies instances where the relative movement of the CVD is significantly higher than the corresponding price movement. This specific divergence highlights "Buying Absorption"—a market condition where aggressive market buy orders are being filled by passive limit sell orders, preventing further price appreciation and creating a heavy ceiling for the reversal.
Risk Management
To maintain a disciplined approach, the strategy employs fixed exit parameters based on the underlying Nifty price:
Take Profit: 25 points.
Stop Loss: 30 points.
Intended Use
This tool is intended for traders who study mechanical, rule-based systems and order flow dynamics. It provides a structured framework for observing how volume delta divergence (CVD) and rapid price rejections interact at potential market turning points.
Disclaimer: This script is for educational and informational purposes only. It is not financial advice. All trading involves risk, and past performance is not indicative of future results. Please conduct your own research and backtesting before making any trading decisions.
NIFTY_2MIN_CVD_Absorption_long_StrategySummary
This strategy is an intraday system designed for the Nifty index on a 2-minute timeframe, focusing on high-probability reversal entries. It utilizes price action patterns and Cumulative Volume Delta (CVD) to identify market turning points.
Long Strategy: Concept & Core Logic
The long strategy is engineered to identify "V-shaped" recoveries where selling pressure is exhausted and absorbed by aggressive buyers.
Price Action Trigger: The strategy looks for a specific two-part sequence:
Sudden Bearish Movement: A rapid downward move representing a final flush of sellers.
Sudden Reversal: Immediately followed by a strong, high-momentum bullish (green) candle, indicating a swift change in market sentiment.
CVD Absorption Filter: To confirm the validity of the reversal, the strategy analyzes the Cumulative Volume Delta (CVD). It specifically looks for instances where the relative movement of CVD is significantly higher than the corresponding price movement. This divergence suggests "selling absorption"—where large buy orders are soaking up sell-side liquidity, creating a floor for the reversal.
Risk Management (Long)
The strategy utilizes fixed exit parameters based on the underlying Nifty price points:
Take Profit: 25 points.
Stop Loss: 30 points.
Intended Use
This tool is intended for traders who study mechanical, rule-based systems. It demonstrates how price action, volume delta divergence (CVD), and trend filters can be combined to time entries in both trending and reversal market conditions.
Disclaimer: This script is for educational and informational purposes only. It is not financial advice. All trading involves risk, and past performance is not indicative of future results. Please conduct your own research and backtesting before making any trading decisions.

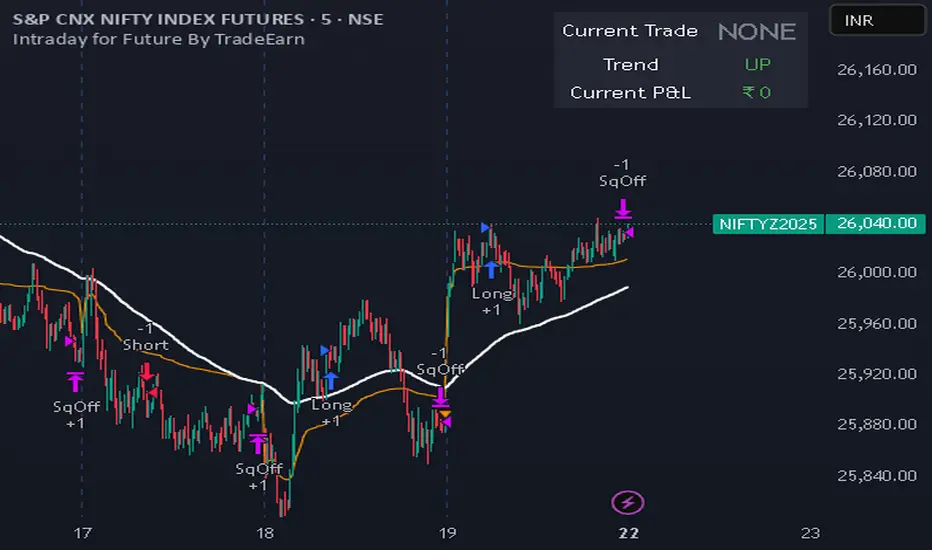
Intraday for Future By TradeEarnIntraday Strategy (StochRSI + VWAP + EMA)
Overview The Intraday Pullback Scalper is a specialized trend-following strategy designed for futures and equity traders who prefer to enter existing trends on pullbacks rather than chasing breakouts. By combining volume-weighted data (VWAP) with exponential moving averages (EMA) and momentum oscillators (Stochastic RSI), this script identifies high-probability entry points during intraday sessions. It includes built-in automation hooks (Alerts) compatible with bridge services for seamless execution.
How It Works
The strategy relies on a three-step confirmation process to filter noise and precision-time entries:
Trend Definition (The Filter):
VWAP (Volume Weighted Average Price): Acts as the primary regime filter. Longs are only permitted if price > VWAP; Shorts only if price < VWAP.
EMA (Exponential Moving Average): A secondary trend filter (default 100 periods) ensures alignment with the broader trend.
Time Range Breakout (Optional): Users can enable an "Initial Balance" filter where trades are only taken if the price breaks out of a specific time range (e.g., first hour High/Low).
Entry Trigger (The Signal):
Long Entry: The market must be in an Uptrend (Price > VWAP & EMA). The script waits for a "dip" where the Stochastic RSI drops below the Oversold level (default 20) and then crosses back up.
Short Entry: The market must be in a Downtrend (Price < VWAP & EMA). The script waits for a "rally" where the Stochastic RSI rises above the Overbought level (default 80) and then crosses back down.
Risk Management:
The strategy uses fixed Target Profit and Stop Loss values defined in currency (₹) relative to the trade quantity.
It features visual SL and TP lines on the chart for the duration of the trade to assist with manual monitoring.
Key Features
Universal Compatibility: Works on the "Current Chart" (Nifty, Bank Nifty, Stocks, Commodities) without needing complex dropdown selection.
Visual Dashboard: An on-screen table displays the Current Trade Status (Long/Short), Trend Direction, and Running P&L in real-time.
Algobaba Bridge Ready: Pre-formatted alert messages are included for users utilizing the Algobaba bridge for automation (supports MIS/NRML product types).
Customizable Trend Filters: Users can toggle the Time Range filter or adjust the VWAP Anchor (Session, Week, Month).
Settings & Configuration
Trade Quantity: Set your default lot size (e.g., 50 for Nifty).
Risk Settings: Define Target and Stop Loss in Rupees (₹) per trade setup.
Indicators: Adjustable lengths for EMA, RSI, and Stochastic.
Trading Window: Restrict entries to specific session hours (e.g., 09:15 - 15:10).
⚠️ IMPORTANT DISCLAIMER & RISK WARNING ⚠️
1. Educational Purpose Only This strategy script is provided solely for educational, informational, and research purposes. It does not constitute financial advice, investment recommendations, or a solicitation to buy or sell any securities, futures, or derivatives. The author is not a SEBI registered Research Analyst or Investment Advisor.
2. No Guarantee of Profit The "P&L" and performance metrics displayed on the chart are hypothetical and based on historical data. Past performance is not indicative of future results. Market conditions change, and a strategy that worked in the past may fail in the future.
3. Limitations of Backtesting
Slippage & Commission: The script results may not fully account for real-world execution costs such as broker commissions, taxes (STT/GST), slippage, or liquidity issues.
Repainting/Data Lag: While every effort is made to ensure code stability, real-time data feeds may vary from historical data due to internet latency or data provider differences.
4. High Risk in Derivatives Trading Futures and Options (F&O) involves a substantial risk of loss and is not suitable for every investor. You can lose more than your initial capital. Please assess your risk tolerance and financial situation before trading.
5. Automation & Third-Party Tools This script includes alert messages formatted for third-party bridge services (e.g., Algobaba). The author assumes no responsibility for:
Technical failures, API errors, or connectivity issues with your broker or bridge provider.
Incorrect order execution resulting from automation.
Users are solely responsible for monitoring their trades and verifying order execution.
Usage Agreement By using this script, you acknowledge that you are trading at your own risk and hold the author harmless from any losses incurred. Always test on a paper trading account before deploying real capital.
Intraday Options/Futures Naked By TradeEarnIntraday Momentum Strategy (Futures & Options)
Description: This is a specialized Intraday Momentum system designed for Indian Indices Nifty, BankNifty, FinNifty, Sensex and Crude Oil. It is engineered to simplify the automation process by standardizing quantity management for single-leg execution via third-party bridges.
Originality & Utility: Unlike standard momentum strategies, this script solves the complexity of position sizing across different asset classes. It features a custom "Smart Quantity" engine that automatically differentiates between Futures (Raw Quantity) and Index Options (Lot Multipliers), allowing traders to switch instruments without manually calculating order sizes.
Key Features:
Dual Mode: Supports both Futures (Long/Short) and Options Buying (Long CE / Long PE).
Smart Quantity Logic:
Futures/Crude: Inputs are treated as raw quantity (e.g., 1 Lot = 1 Qty).
Index Options: Inputs are automatically multiplied by the standard market lot size (e.g., 1 Lot Nifty = 25 Qty).
Rupee-Based Risk: Target, Stop Loss, and Trailing SL are defined in absolute Rupees (INR) rather than percentages, offering precise P&L control.
Choppiness Filter: Combines RSI and ADX to filter out low-volatility ranges.
Entry Logic:
Buy Signal: Green Impulse Candle + RSI > 55 + ADX > 20
Sell Signal: Red Impulse Candle + RSI < 45 + ADX > 20
Strategy Settings & Backtesting:
Commission: The strategy is backtested with a commission of ₹20 per order to reflect realistic net P&L.
Slippage: Users should account for realistic slippage in live trading, which is not factored into the script's hard values.
⚠️ Disclaimer & Statutory Warning
Strictly for Educational & Backtesting Purposes
1. SEBI Registration Status: The author of this script/strategy is NOT a SEBI registered Research Analyst (RA) or Investment Advisor (IA). This tool is provided solely to assist in backtesting logic and educational analysis. It does not constitute a recommendation to buy, sell, or hold any securities.
2. Market Risk: Investment in the securities market, particularly in Derivatives (Futures & Options), is subject to market risks. You may lose your entire capital. Please read all related scheme documents carefully before investing.
3. No Guarantees: Past performance of this algorithm (as shown in backtest results) is not indicative of future performance. Market conditions change, and slippage or execution errors can occur during live trading.
4. User Responsibility: By using this script, you acknowledge that you are solely responsible for your own trading decisions and financial losses. You are advised to consult a SEBI-registered financial advisor before deploying real capital. This script is intended for manual or semi-automated analysis and may not be compliant with high-frequency trading (HFT) regulations.

Alpha Protocol v2 [High Precision] - Trend Following & Momentum Description: This strategy is designed for swing traders operating in the NSE (National Stock Exchange) or other high-volume equity markets. It utilizes a classic Trend Following approach filtered by institutional liquidity requirements and momentum confirmation.
The Core Philosophy: The "Alpha Protocol" is built on the premise that the strongest moves occur when price action aligns with the primary trend, supported by volume and volatility contraction. It aims to capture the "meat" of the move while strictly limiting downside risk.
Technical Architecture:
Trend Filter: The strategy only takes long positions when the 50-DMA is above the 200-DMA, and the 200-DMA slope is positive (rising).
Momentum triggers:
RSI (14): Must be in the bullish zone (55-75) but not overheated.
MACD: Requires a bullish crossover or positive histogram expansion.
ADX: Must be > 20 to ensure we are not trading in a choppy/sideways market.
Liquidity Filter: To ensure realistic execution, the script requires a minimum daily turnover (Price * Volume) of ₹5 Crores (configurable).
Price Action: Entries are triggered on a breakout of the 20-day high, confirmed by a strong close in the upper 30% of the daily range.
Risk Management (Hard Coded):
Stop Loss: Placed at the recent 10-day Swing Low.
Circuit Breaker: If the Swing Low is more than 5% away from the entry price, the trade is ignored (Capital Protection Rule).
Profit Target: Dynamic 1:2 Risk-Reward Ratio.
Instructions for Use:
Timeframe: Daily (D) is recommended.
Universe: Liquid Mid-caps and Large-caps (Nifty 500).
Alerts: This script is alert-compatible. Use the "Alert() function calls" option to receive precise Entry, Stop, and Target prices on your device.
Disclaimer: This script is for educational and backtesting purposes only. Past performance does not guarantee future results.

Ace Algo [Anson5129]🏆 Exclusive Indicator: Ace Algo
📈 Works for stocks, forex, crypto, indices
📈 Easy to use, real-time alerts, no repaint
📈 No grid, no martingale, no hedging
📈 One position at a time
----------------------------------------------------------------------------------------
Ace Algo
A trend-following TradingView strategy using a confluence of technical indicators and time-based rules for structured long/short entries and exits:
----------------------------------------------------------------------------------------
Parameters Explanation
Moving Average Length
Indicates the number of historical data points used for the average price calculation.
Shorter = volatile (short-term trends); longer = smoother (long-term trends, less noise).
Default: 20
Entry delay in bars
After a trade is closed, delay the next entry in bars. The lower the number, the more trades you will get.
Default: 4
Take Profit delay in bars
After a trade is opened, delay the take profit in bars. The lower the number, the more trades you will get.
Default: 3
Enable ADX Filter
No order will be placed when ADX < 20
Default: Uncheck
Block Period
Set a block period during which no trading will take place.
----------------------------------------------------------------------------------------
Entry Condition:
Only Long when the price is above the moving average (Orange line).
Only Short when the price is below the moving average (Orange line).
* Also, with some hidden parameter that I set in the backend.
Exit Condition:
When getting profit:
Trailing Stop Activates after a position has been open for a set number of bars (to avoid premature exits).
When losing money:
In a long position, when the price falls below the moving average, and the conditions for a short position are met, the long position will be closed, and the short position will be opened.
In a short position, when the price rises above the moving average, and the conditions for a long position are met, the short position will be closed, and the long position will be opened.
----------------------------------------------------------------------------------------
How to get access to the strategy
Read the author's instructions on the right to learn how to get access to the strategy.

Simple Candle Strategy# Candle Pattern Strategy - Pine Script V6
## Overview
A TradingView trading strategy script (Pine Script V6) that identifies candlestick patterns over a configurable lookback period and generates trading signals based on pattern recognition rules.
## Strategy Logic
The strategy analyzes the most recent N candlesticks (default: 5) and classifies their patterns into three categories, then generates buy/sell signals based on specific pattern combinations.
### Candlestick Pattern Classification
Each candlestick is classified as one of three types:
| Pattern | Definition | Formula |
|---------|-----------|---------|
| **Close at High** | Close price near the highest price of the candle | `(high - close) / (high - low) ≤ (1 - threshold)` |
| **Close at Low** | Close price near the lowest price of the candle | `(close - low) / (high - low) ≤ (1 - threshold)` |
| **Doji** | Opening and closing prices very close; long upper/lower wicks | `abs(close - open) / (high - low) ≤ threshold` |
### Trading Rules
| Condition | Action | Signal |
|-----------|--------|--------|
| Number of Doji candles ≥ 3 | **SKIP** - Market is too chaotic | No trade |
| "Close at High" count ≥ 2 + Last candle closes at high | **LONG** - Bullish confirmation | Buy Signal |
| "Close at Low" count ≥ 2 + Last candle closes at low | **SHORT** - Bearish confirmation | Sell Signal |
## Configuration Parameters
All parameters are adjustable in TradingView's "Settings/Inputs" tab:
| Parameter | Default | Range | Description |
|-----------|---------|-------|-------------|
| **K-line Lookback Period** | 5 | 3-20 | Number of candlesticks to analyze |
| **Doji Threshold** | 0.1 | 0.0-1.0 | Body size / Total range ratio for doji identification |
| **Doji Count Limit** | 3 | 1-10 | Number of dojis that triggers skip signal |
| **Close at High Proximity** | 0.9 | 0.5-1.0 | Required proximity to highest price (0.9 = 90%) |
| **Close at Low Proximity** | 0.9 | 0.5-1.0 | Required proximity to lowest price (0.9 = 90%) |
### Parameter Tuning Guide
#### Proximity Thresholds (Close at High/Low)
- **0.95 or higher**: Stricter - only very strong candles qualify
- **0.90 (default)**: Balanced - good for most market conditions
- **0.80 or lower**: Looser - catches more patterns, higher false signals
#### Doji Threshold
- **0.05-0.10**: Strict doji identification
- **0.10-0.15**: Standard doji detection
- **0.15+**: Includes near-doji patterns
#### Lookback Period
- **3-5 bars**: Fast, sensitive to recent patterns
- **5-10 bars**: Balanced approach
- **10-20 bars**: Slower, filters out noise
## Visual Indicators
### Chart Markers
- **Green Up Arrow** ▲: Long entry signal triggered
- **Red Down Arrow** ▼: Short entry signal triggered
- **Gray X**: Skip signal (too many dojis detected)
### Statistics Table
Located at top-right corner, displays real-time pattern counts:
- **Close at High**: Count of candles closing near the high
- **Close at Low**: Count of candles closing near the low
- **Doji**: Count of doji/near-doji patterns
### Signal Labels
- Green label: "✓ Long condition met" - below entry bar
- Red label: "✓ Short condition met" - above entry bar
- Gray label: "⊠ Too many dojis, skip" - trade skipped
## Risk Management
### Exit Strategy
The strategy includes built-in exit rules based on ATR (Average True Range):
- **Stop Loss**: ATR × 2
- **Take Profit**: ATR × 3
Example: If ATR is $10, stop loss is at -$20 and take profit is at +$30
### Position Sizing
Default: 100% of equity per trade (adjustable in strategy properties)
**Recommendation**: Reduce to 10-25% of equity for safer capital allocation
## How to Use
### 1. Copy the Script
1. Open TradingView
2. Go to Pine Script Editor
3. Create a new indicator
4. Copy the entire `candle_pattern_strategy.pine` content
5. Click "Add to Chart"
### 2. Apply to Chart
- Select your preferred timeframe (1m, 5m, 15m, 1h, 4h, 1d)
- Choose a trading symbol (stocks, forex, crypto, etc.)
- The strategy will generate signals on all historical bars and in real-time
### 3. Configure Parameters
1. Right-click the strategy on chart → "Settings"
2. Adjust parameters in the "Inputs" tab
3. Strategy will recalculate automatically
4. Backtest results appear in the Strategy Tester panel
### 4. Backtesting
1. Click "Strategy Tester" (bottom panel)
2. Set date range for historical testing
3. Review performance metrics:
- Win rate
- Profit factor
- Drawdown
- Total returns
## Key Features
✅ **Execution Model Compliant** - Follows official Pine Script V6 standards
✅ **Global Scope** - All historical references in global scope for consistency
✅ **Adjustable Sensitivity** - Fine-tune all pattern detection thresholds
✅ **Real-time Updates** - Works on both historical and real-time bars
✅ **Visual Feedback** - Clear signals with labels and statistics table
✅ **Risk Management** - Built-in ATR-based stop loss and take profit
✅ **No Repainting** - Signals remain consistent after bar closes
## Important Notes
### Before Trading Live
1. **Backtest thoroughly**: Test on at least 6-12 months of historical data
2. **Paper trading first**: Practice with simulated trades
3. **Optimize parameters**: Find the best settings for your trading instrument
4. **Manage risk**: Never risk more than 1-2% per trade
5. **Monitor performance**: Review trades regularly and adjust as needed
### Market Conditions
The strategy works best in:
- Trending markets with clear directional bias
- Range-bound markets with defined support/resistance
- Markets with moderate volatility
The strategy may underperform in:
- Highly choppy/noisy markets (many false signals)
- Markets with gaps or overnight gaps
- Low liquidity periods
### Limitations
- Works on chart timeframes only (not intrabar analysis)
- Requires at least 5 bars of history (configurable)
- Fixed exit rules may not suit all trading styles
- No trend filtering (will trade both directions)
## Technical Details
### Historical Buffer Management
The strategy declares maximum bars back to ensure enough historical data:
```pine
max_bars_back(close, 20)
max_bars_back(open, 20)
max_bars_back(high, 20)
max_bars_back(low, 20)
```
This prevents runtime errors when accessing historical candlestick data.
### Pattern Detection Algorithm
```
For each bar in lookback period:
1. Calculate (high - close) / (high - low) → close_to_high_ratio
2. If close_to_high_ratio ≤ (1 - threshold) → count as "Close at High"
3. Calculate (close - low) / (high - low) → close_to_low_ratio
4. If close_to_low_ratio ≤ (1 - threshold) → count as "Close at Low"
5. Calculate abs(close - open) / (high - low) → body_ratio
6. If body_ratio ≤ doji_threshold → count as "Doji"
Signal Generation:
7. If doji_count ≥ cross_count_limit → SKIP_SIGNAL
8. If close_at_high_count ≥ 2 AND last_close_at_high → LONG_SIGNAL
9. If close_at_low_count ≥ 2 AND last_close_at_low → SHORT_SIGNAL
```
## Example Scenarios
### Scenario 1: Bullish Signal
```
Last 5 bars pattern:
Bar 1: Closes at high (95%) ✓
Bar 2: Closes at high (92%) ✓
Bar 3: Closes at mid (50%)
Bar 4: Closes at low (10%)
Bar 5: Closes at high (96%) ✓ (last bar)
Result:
- Close at high count: 3 (≥ 2) ✓
- Last closes at high: ✓
- Doji count: 0 (< 3) ✓
→ LONG SIGNAL ✓
```
### Scenario 2: Skip Signal
```
Last 5 bars pattern:
Bar 1: Doji pattern ✓
Bar 2: Doji pattern ✓
Bar 3: Closes at mid
Bar 4: Doji pattern ✓
Bar 5: Closes at high
Result:
- Doji count: 3 (≥ 3)
→ SKIP SIGNAL - Market too chaotic
```
## Performance Optimization
### Tips for Better Results
1. **Use Higher Timeframes**: 15m or higher reduces false signals
2. **Combine with Indicators**: Add volume or trend filters
3. **Seasonal Adjustment**: Different parameters for different seasons
4. **Instrument Selection**: Test on liquid, high-volume instruments
5. **Regular Rebalancing**: Adjust parameters quarterly based on performance
## Troubleshooting
### No Signals Generated
- Check if lookback period is too large
- Verify proximity thresholds aren't too strict (try 0.85 instead of 0.95)
- Ensure doji limit allows for trading (try 4-5 instead of 3)
### Too Many False Signals
- Increase proximity thresholds to 0.95+
- Reduce lookback period to 3-4 bars
- Increase doji limit to 3-4
- Test on higher timeframes
### Strategy Tester Shows Losses
- Review individual trades to identify patterns
- Adjust stop loss and take profit ratios
- Change lookback period and thresholds
- Test on different market conditions
## References
- (www.tradingview.com)
- (www.tradingview.com)
- (www.investopedia.com)
- (www.investopedia.com)
## Disclaimer
**This strategy is provided for educational and research purposes only.**
- Not financial advice
- Past performance does not guarantee future results
- Always conduct thorough backtesting before live trading
- Trading involves significant risk of loss
- Use proper risk management and position sizing
## License
Created: December 15, 2025
Version: 1.0
---
**For updates and modifications, refer to the accompanying documentation files.**

Strategy with VWRSI and SAVE orders Long or Short or BothVWRSI is very powerful indicator coded by Algo Alpha and I Make Strategy of it
But there is no stop loss instate the Strategy is using Save orders to minimize the market manipulation
The best to used is side way market with long and short enable
The Strategy trigger long or short market order -
long - ta.crossover(rsi, 20)
short - ta.crossunder(rsi, 80)
And if is not take profit from the first trade start with the save trades until will do
the sum of the first order - base order and the save order can be adjust from the user
as well the deviation from the first order
IF some user have questions let me know

Disoxis Capital Club📊 Strategy B✅This indicator has been exclusively developed for Disoxis Capital Club members, combining advanced volume-weighted analytics with institutional trading concepts.
The indicator automatically resets at the start of each trading session and uses volume-weighted statistical calculations to ensure accuracy that aligns with professional trading platforms. All visual elements, including customizable color schemes and line styles, have been optimized for clarity and real-time decision-making. Designed specifically for active intraday traders within the Disoxis Capital Club community, this indicator incorporates time-based filtering capabilities and session-specific analytics to help identify high-probability trading opportunities.
The tool displays key institutional levels through clean visual representation, making it easier to recognize market behavior around volume-weighted price zones. Whether you're analyzing futures, forex, or equity markets, this indicator provides the technical foundation needed to align your trading with smart money movements and institutional order flow patterns.

S&D Light+ Enhanced# S&D Light+ Enhanced - Supply & Demand Zone Trading Strategy
## 📊 Overview
**S&D Light+ Enhanced** is an advanced Supply and Demand zone identification and trading strategy that combines institutional order flow concepts with smart money techniques. This strategy automatically identifies high-probability reversal zones based on Break of Structure (BOS), momentum analysis, and first retest principles.
## 🎯 Key Features
### Smart Zone Detection
- **Automatic Supply & Demand Zone Identification** - Detects institutional zones where price is likely to react
- **Multi-Candle Momentum Analysis** - Validates zones with configurable momentum requirements
- **Break of Structure (BOS) Confirmation** - Ensures zones are created only after significant structure breaks
- **Quality Filters** - Minimum zone size and ATR-based filtering to eliminate weak zones
### Advanced Zone Management
- **Customizable Zone Display** - Choose between Geometric or Volume-Weighted midlines
- **First Retest Logic** - Option to trade only the first touch of each zone for higher probability setups
- **Zone Capacity Control** - Maintains a clean chart by limiting stored zones per type
- **Visual Zone Status** - Automatically marks consumed zones with faded midlines
### Risk Management
- **Dynamic Stop Loss** - Positioned beyond zone boundaries with adjustable buffer
- **Risk-Reward Ratio Control** - Customizable R:R for consistent risk management
- **Entry Spacing** - Minimum bars between signals prevents overtrading
- **Position Sizing** - Built-in percentage of equity allocation
## 🔧 How It Works
### Zone Creation Logic
**Supply Zones (Selling Pressure):**
1. Strong momentum downward movement (configurable body-to-range ratio)
2. Identified bullish base candle (where institutions accumulated shorts)
3. Break of Structure downward (price breaks below recent swing low)
4. Zone created at the base candle's high/low range
**Demand Zones (Buying Pressure):**
1. Strong momentum upward movement
2. Identified bearish base candle (where institutions accumulated longs)
3. Break of Structure upward (price breaks above recent swing high)
4. Zone created at the base candle's high/low range
### Entry Conditions
**Long Entry:**
- Price retests a demand zone (touches top of zone)
- Rejection confirmed (close above zone)
- Zone hasn't been used (if "first retest only" enabled)
- Minimum bars since last entry respected
**Short Entry:**
- Price retests a supply zone (touches bottom of zone)
- Rejection confirmed (close below zone)
- Zone hasn't been used (if "first retest only" enabled)
- Minimum bars since last entry respected
## ⚙️ Customizable Parameters
### Display Settings
- **Show Zones** - Toggle zone visualization on/off
- **Max Stored Zones** - Control number of active zones (1-50 per type)
- **Color Customization** - Adjust supply/demand colors and transparency
### Zone Quality Filters
- **Momentum Body Fraction** - Minimum body size for momentum candles (0.1-0.9)
- **Min Momentum Candles** - Number of consecutive momentum candles required (1-5)
- **Big Candle Body Fraction** - Alternative single-candle momentum threshold (0.5-0.95)
- **Min Zone Size %** - Minimum zone height as percentage of price (0.01-5.0%)
### BOS Configuration
- **Swing Length** - Lookback period for structure identification (3-20)
- **ATR Length** - Period for volatility measurement (1-50)
- **BOS Required Break** - ATR multiplier for valid structure break (0.1-3.0)
### Midline Options
- **None** - No midline displayed
- **Geometric** - Simple average of zone top/bottom
- **CenterVolume** - Volume-weighted center based on highest volume bar in window
### Risk Management
- **SL Buffer %** - Additional space beyond zone boundary (0-5%)
- **Take Profit RR** - Risk-reward ratio for target placement (0.5-10x)
### Entry Rules
- **Only 1st Retest per Zone** - Trade zones only once for higher quality
- **Min Bars Between Entries** - Prevent overtrading (1-20 bars)
## 📈 Recommended Settings
### Conservative (Lower Frequency, Higher Quality)
```
Momentum Body Fraction: 0.30
Min Momentum Candles: 2-3
BOS Required Break: 0.8-1.0
Min Zone Size: 0.15-0.20%
Only 1st Retest: Enabled
```
### Balanced (Default)
```
Momentum Body Fraction: 0.28
Min Momentum Candles: 2
BOS Required Break: 0.7
Min Zone Size: 0.12%
Only 1st Retest: Enabled
```
### Aggressive (Higher Frequency, More Signals)
```
Momentum Body Fraction: 0.20-0.25
Min Momentum Candles: 1-2
BOS Required Break: 0.4-0.5
Min Zone Size: 0.08-0.10%
Only 1st Retest: Disabled
```
## 🎨 Visual Elements
- **Red Boxes** - Supply zones (potential selling areas)
- **Green Boxes** - Demand zones (potential buying areas)
- **Dotted Midlines** - Center of each zone (fades when zone is used)
- **Debug Triangles** - Shows when zone creation conditions are met
- Red triangle down = Supply zone created
- Green triangle up = Demand zone created
## 📊 Best Practices
1. **Use on Higher Timeframes** - 1H, 4H, and Daily charts work best for institutional zones
2. **Combine with Trend** - Trade zones in direction of overall market structure
3. **Wait for Confirmation** - Don't enter immediately at zone touch; wait for rejection
4. **Adjust for Market Volatility** - Increase BOS multiplier in choppy markets
5. **Monitor Zone Quality** - Fresh zones typically have higher success rates
6. **Backtest Your Settings** - Optimize parameters for your specific market and timeframe
## ⚠️ Risk Disclaimer
This strategy is for educational and informational purposes only. Past performance does not guarantee future results. Always:
- Use proper position sizing
- Set appropriate stop losses
- Test thoroughly before live trading
- Consider market conditions and overall trend
- Never risk more than you can afford to lose
## 🔍 Data Window Information
The strategy provides real-time metrics visible in the data window:
- Supply Zones Count
- Demand Zones Count
- ATR Value
- Momentum Signals (Up/Down)
- BOS Signals (Up/Down)
## 📝 Version History
**v1.0 - Enhanced Edition**
- Improved BOS detection logic
- Extended base candle search range
- Added comprehensive input validation
- Enhanced visual feedback system
- Robust array bounds checking
- Debug signals for troubleshooting
## 💡 Tips for Optimization
- **Trending Markets**: Lower momentum requirements, tighter BOS filters
- **Ranging Markets**: Increase zone size minimum, enable first retest only
- **Volatile Assets**: Increase ATR multiplier and SL buffer
- **Lower Timeframes**: Reduce swing length, increase min bars between entries
- **Higher Timeframes**: Increase swing length, relax momentum requirements
---
**Created with focus on institutional order flow, smart money concepts, and practical risk management.**
*Happy Trading! 📈*

Momentum Reversal / Dip Buyer [Score Based]Strategy Overview
Momentum Reversal / Dip Buyer is a quantitative reversal engine designed to fade stretched moves and buy dips / sell rallies when multiple momentum and context factors line up. It’s built for liquid instruments especially for ticker CME_MINI:ES1! and works best on intraday timeframes like the 5-minute or 1-minute chart.
Core Logic
This strategy builds a composite Momentum Score by combining:
Price Location: Relative to 100 SMA, 1000 EMA, and VWAP (trend / regime filter).
RSI: Overbought/oversold and mid-zone strength.
VWMO (Volume-Weighted Momentum): Direction and strength of volume-weighted price drift.
ADX: Trend strength filter (high vs low trend environment).
Full Stoch (%K): Short-term exhaustion and mean-reversion context.
CCI: Overbought/oversold turns (key trigger).
MFI: Volume-confirmed buying/selling pressure.
ATR Regime: High vs low volatility environment.
Cumulative Delta: Whether net aggressor flow is rising or falling.
From this, a single Momentum Score is computed each bar:
Longs: Taken when the score is depressed (scoreLow) and CCI crosses up from oversold.
Shorts: Taken when the score is elevated (scoreHigh) and CCI crosses down from overbought.
Risk Management & Trade Logic
Max Daily Trades: Hard cap on entries per day.
Hard Stop: Fixed % stop based on entry price.
Profit Target: Target ATR Multiplier × main ATR from entry.
Breakeven Logic: Optional; moves stop to breakeven (plus optional offset) after price moves a configurable multiple of the main ATR in your favor.
Trailing Stop (Separate ATR): Optional; uses its own ATR length and ATR-based trigger and distance. This lets you run slower ATR for targets while using a tighter, more reactive ATR for the trail.
Session Control
Trading Window: Optional session filter (e.g., 09:30–16:00). Entries are only allowed inside the defined window.
Force Flat at Session End: Option to automatically close all open positions when the session ends.
Visuals
The script plots entry arrows and a compact dashboard displaying: current Momentum Score, daily trade usage, and CCI status.
Disclaimer:
This script is for educational and research purposes only and is not financial advice. Past performance does not guarantee future results. Always forward-test and adjust parameters to your own risk tolerance and market.
Shoutout and all credit goes to AuclairsCapital for building the base foundation of this strategy on ThinkScript
