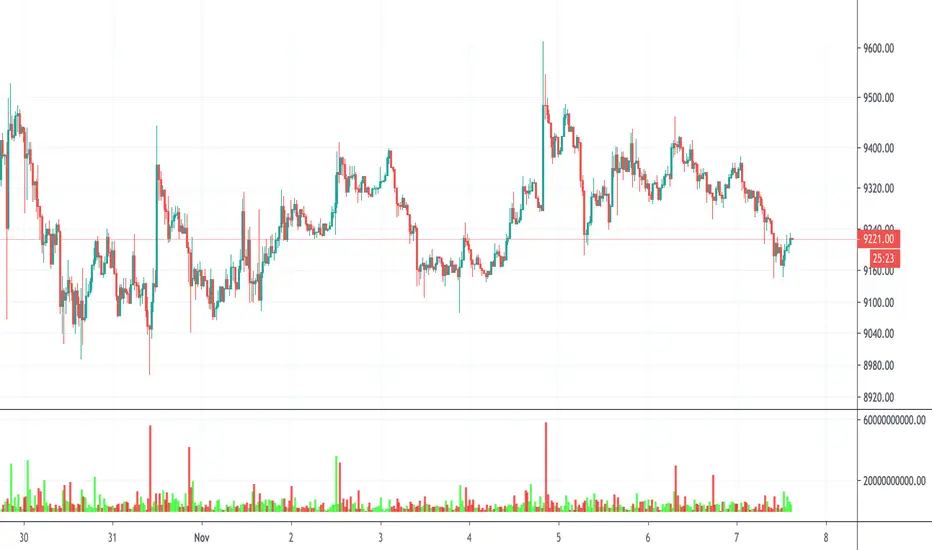
VolumeSimple and straightforward indicator. Includes - volume for Ethereum and Bitcoin to US dollar .
7 exchanges are connected:
-BINANCEUS:BTCUSD
-FTX:BTCUSD
-COINBASE:BTCUSD
-KRAKEN:XBTUSD
-GEMINI:BTCUSD
-BITFINEX:BTCUSD
-BITSTAMP:BTCUSD
Additionally, the calculation of average indicators and the amount (bull / bear separately) for a certain length is built-in.
If I missed data exchanges - write in the comments. Thank you.
Cerca negli script per "volume"

Volume distance to new volume ATH This one lights up if the distance from volume ATH continues to become smaller.
Flips from color to white are a sign of trend decay/change and could be used as an exit signal or entry signal.
3rd part of the alchemy indicator.

Volume Rate of Change Histogram - LayeringShows acceleration or deceleration in volume, to be used with Volume MA, preferably overlapped

Volume ROC by Mike SierraRate of change of volume over the past few bars can be a leading indicator to price action

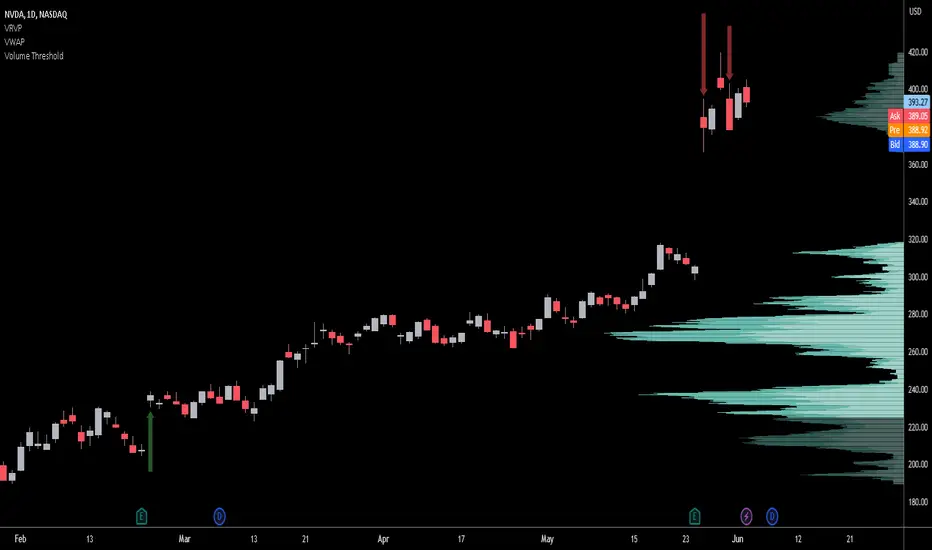
Volume ThresholdIndicates Volume breakouts over an configurable threshold by drawing arrows.
Higher volume breakouts are indicated by longer arrows. breakdowns by down arrows...
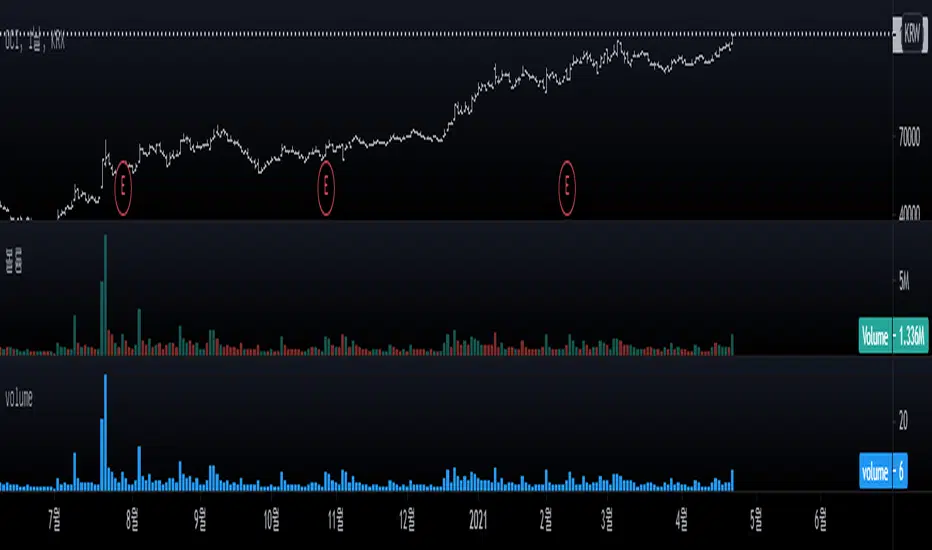
Volume outstanding shares거래량 / 발행주식 *100
volume / outstanding shares *100
When a trading volume exceeds the number of outstanding shares, this means a trading catalyst has occurred.

Volume Spike RSIFollow up to Volume Spike Strategy.
This script calculates volume spikes (e.g. volume is 3 times greater than average volume) and signals them in overbought or oversold areas (RSI).
Credit to “Capitalize AI: Volume Spike Strategy" by Bitcoin Trading Challenge for the original idea.
Tested on XBTUSD 1 minute chart

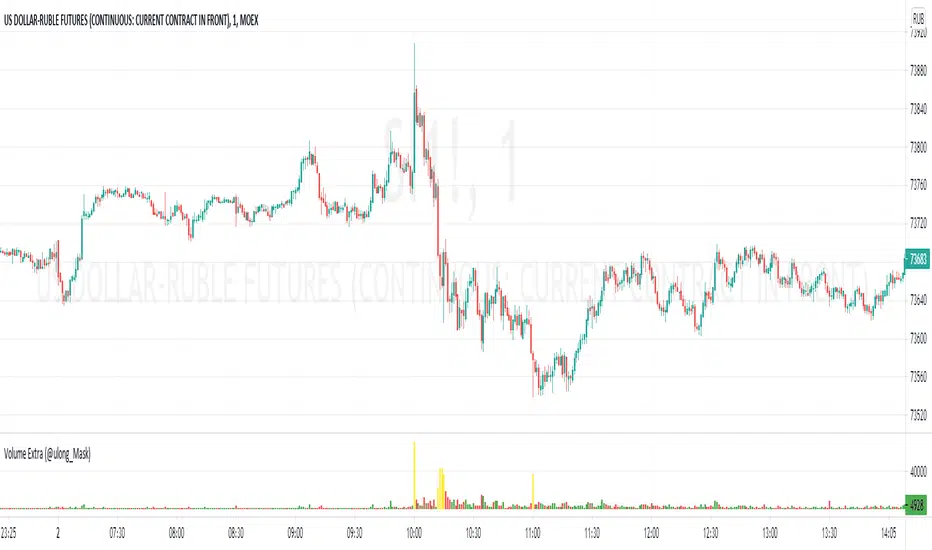
Volume BalanceThe indicator colors the volume bars in two colors to display the Bullish and Bearish power.
There is two option of the indicator view. The first is the classic one. And the second is to show the Bullish and Bearish power separately.

Volume HighThis is a collab script with kisshore19 to identify the highest volume candle on the chart each day and mark the highs and lows of that candle.

Volume comparison
The rate of increase / decrease in the volume of BITMEX, BYBIT, BINANCE and FINEX is displayed.

Volume Direction Force Index v1 - VDFI [wm]Essentially the same as TDFI. However, uses volume rather than price as the source data
Above filter high indicates increase in volume
Above filter low indicates drop off in volume
Orig TDFI:

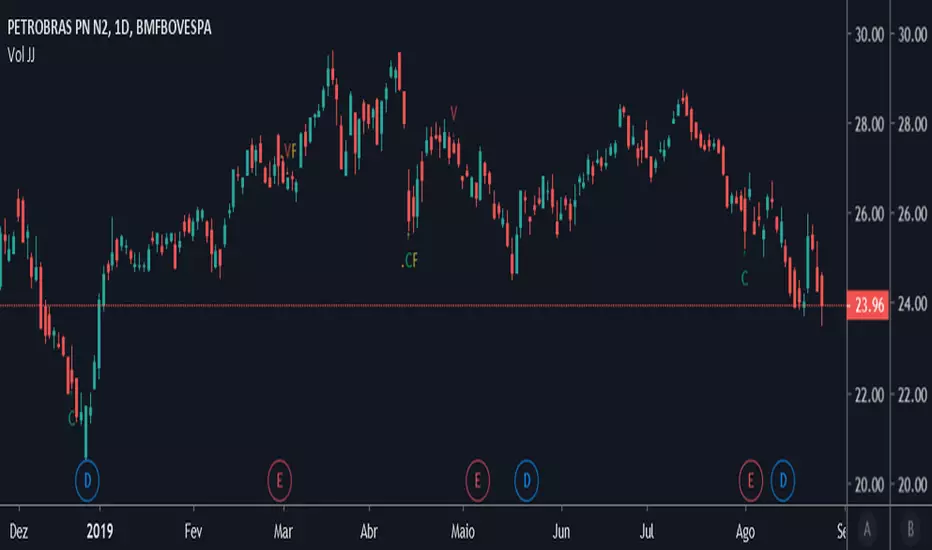
Volume JJEstudo baseado no volume
Se superar o dobro da EMA 21 Compra
Se não superar a metade da EMA 21 Venda
Se superar o triplo da EMA 21 Compra Forte
Se não superar um terço da EMA 21 Venda Forte

Volume CandleHighlight significant Candles, i.e. those candles that carry volume above the average volume of the chosen period by the chose proportion.
The value=1.25 with period=20 will highlight candles with volume 125% above the volume average for the last 20 candles.

Volume RSI altsSo this allow you to put major alts against each other and compare the Volume RSI to each other and to the alts that you are currently looking In this example we see TRX breaking from the major pack of the other alts in 1D chart making the breakthrough up
Each alt has it own color
if you want to add more alts just copi paste and add the code for your alt to make this system better for you
here you see how XRP break from the pack show in arrow down
here on 4 h chart we see LTC is breaking before BTC (its a btc chart and LTC in orange)

Volume Flow Indicator [LazyBear]LFThis is Lazybear's port of VFI by Katsanos, which ideally requires 2 different sets of coefficients for intraday vs longer term charts. I added definitions of the values to allow for one set to be used intraday while the other is used for resolutions of 1d or more. This version will dynamically adapt the coefficients using the chart's resolution. I've also added options to show crosses with the MA and the zero line, and the possibility to have the zero line change color when using the long term set of coefficients, as a reminder.
LazyBear's original version is here .
This is the Katsanos documentation on VFI: www.mkatsanos.com .

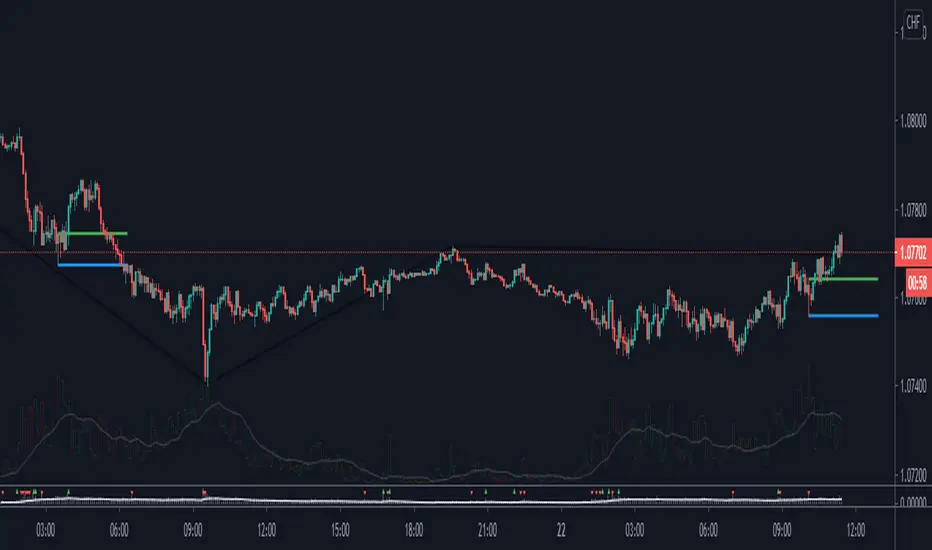
Volume+Price Action AlertThis script identifies sudden changes in both volume and price.
You can set the sensitivities for both volume change and price change with respect to the moving averages.
There are four inputs in this script: the first two parameters indicate the length for moving averages of volume and price and the last two parameters indicate how much the volume change (e.g. 2 times) or the price change (e.g. 0.01; that is 1 percent of close price) should be.

Volume Candles By Anil ChawraHow Users Can Make Profit Using This Script:
1. Volume Representation : Each candle on the chart represents a specific time period (e.g., 1 minute, 1 hour, 1 day) and includes information about both price movement and trading volume during that period.
2. Candlestick Anatomy : A volume candle has the same components as a regular candlestick: the body (which represents the opening and closing prices) and the wicks or shadows (which indicate the highest and lowest prices reached during the period).
3. Volume Bars : Instead of just the candlestick itself, volume candles also include a bar or histogram representing the trading volume during that period. The height or length of the volume bar indicates the amount of trading activity.
4. Interpreting Volume : High volume candles typically indicate increased market interest or activity during that period. This could be due to significant buying or selling pressure.
5. Confirmation : Traders often look for confirmation from other technical indicators or price action to validate the significance of a high volume candle. For example, a high volume candle breaking through a key support or resistance level may signal a strong market move.
6. Trend Strength : Volume candles can provide insights into the strength of a trend. A series of high volume candles in the direction of the trend suggests strong momentum, while decreasing volume may indicate weakening momentum or a potential reversal.
7. Volume Patterns : Traders also analyze volume patterns, such as volume spikes or divergences, to identify potential trading opportunities or reversals.
8. Combination with Price Action: Volume analysis is often used in conjunction with price action analysis and other technical indicators to make more informed trading decisions.
9. Confirmation and Validation: It's important to confirm the significance of volume candles with other indicators or price action signals to avoid false signals.
10. Risk Management : As with any trading strategy, proper risk management is crucial when using volume candles to make trading decisions. Set stop-loss orders and adhere to risk management principles to protect your capital.
How the Script Works:
1. Volume Representation : Each candle on the chart represents a specific time period (e.g., 1 minute, 1 hour, 1 day) and includes information about both price movement and trading volume during that period.
2. Candlestick Anatomy : A volume candle has the same components as a regular candlestick: the body (which represents the opening and closing prices) and the wicks or shadows (which indicate the highest and lowest prices reached during the period).
3. Volume Bars : Instead of just the candlestick itself, volume candles also include a bar or histogram representing the trading volume during that period. The height or length of the volume bar indicates the amount of trading activity.
4. Interpreting Volume : High volume candles typically indicate increased market interest or activity during that period. This could be due to significant buying or selling pressure.
5. Confirmation : Traders often look for confirmation from other technical indicators or price action to validate the significance of a high volume candle. For example, a high volume candle breaking through a key support or resistance level may signal a strong market move.
6. Trend Strength : Volume candles can provide insights into the strength of a trend. A series of high volume candles in the direction of the trend suggests strong momentum, while decreasing volume may indicate weakening momentum or a potential reversal.
7. Volume Patterns : Traders also analyze volume patterns, such as volume spikes or divergences, to identify potential trading opportunities or reversals.
8. Combination with Price Action : Volume analysis is often used in conjunction with price action analysis and other technical indicators to make more informed trading decisions.
9. Confirmation and Validation : It's important to confirm the significance of volume candles with other indicators or price action signals to avoid false signals.
10. Risk Management : As with any trading strategy, proper risk management is crucial when using volume candles to make trading decisions. Set stop-loss orders and adhere to risk management principles to protect your capital.
Understanding volume candles can provide valuable insights into market dynamics and help traders make more informed decisions. However, like any technical tool, it's essential to use volume analysis in conjunction with other forms of analysis for comprehensive market assessment.
Understanding volume candles can provide valuable insights into market dynamics and help traders make more informed decisions. However, like any technical tool, it's essential to use volume analysis in conjunction with other forms of analysis for comprehensive market assessment.
