Cerca negli script per "vwap"
VWAP Push StrategyThis strategy is unfortunately not finished yet.
A pretty simple strategy. If price broke through VWAP and had three consecutive candles following the breakthroughs trend, the high of the third candle will be drawn. If this happened after a crossover of the vwap and price breaks through the high of the third candle, strategy will go long. Short will be the same after crossing under the vwap. A long or short will be closed after crossing the vwap in the opposite direction, so the vwap is kind of a trailing stop.
Unfortunately, I could not manage to stop the script from entering multiple times into one drawn high or low. Of course, if a high was crossed the script should wait for a new formed high before entering a new long. If someone would find a solution to this, it would be great, because I think it is a nice strategy .
Should work great scalping 5min charts (when scripting, I used the SPX for reference).

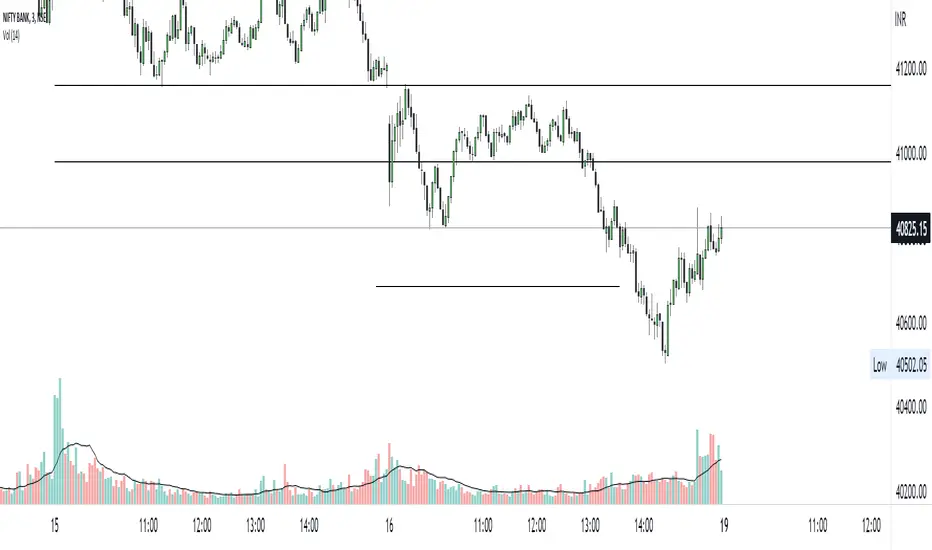
VWAP For NIFTY & BANKNIFTY [Zero54]NIFTY and BANKNIFTY Being Index do not have VWAP (because there is no volume generated). This is a simple script that displays NIFTY's future VWAP on NIFTY's Spot chart and similarly, displays BANKNIFTY's future VWAP on BANKNIFTY's sport chart. Fast and quick. Just few lines of code. No hefty un-necessary calculations.
No settings necessary. The script automatically detects NIFTY and BANKNIFTY and displays the corresponding VWAP.
Enjoy and share the knowledge. If you love this script, please boost/love this script and add a comment. Cheers!
NSE:NIFTY
NSE:BANKNIFTY
VWAPs + devThis script give you the possibility to plot multi timeframes VWAP and deviations for each one : D, W, M, 3M and 12M.
I made this script as clear and simple as possible with only one menu in the parameters.
Hope this will be useful for you.
Enjoy.

VWAP For Loop [BackQuant]VWAP For Loop
What this tool does—in one sentence
A volume-weighted trend gauge that anchors VWAP to a calendar period (day/week/month/quarter/year) and then scores the persistence of that VWAP trend with a simple for-loop “breadth” count; the result is a clean, threshold-driven oscillator plus an optional VWAP overlay and alerts.
Plain-English overview
Instead of judging raw price alone, this indicator focuses on anchored VWAP —the market’s average price paid during your chosen institutional period. It then asks a simple question across a configurable set of lookback steps: “Is the current anchored VWAP higher than it was i bars ago—or lower?” Each “yes” adds +1, each “no” adds −1. Summing those answers creates a score that reflects how consistently the volume-weighted trend has been rising or falling. Extreme positive scores imply persistent, broad strength; deeply negative scores imply persistent weakness. Crossing predefined thresholds produces objective long/short events and color-coded context.
Under the hood
• Anchoring — VWAP using hlc3 × volume resets exactly when the selected period rolls:
Day → session change, Week → new week, Month → new month, Quarter/Year → calendar quarter/year.
• For-loop scoring — For lag steps i = , compare today’s VWAP to VWAP .
– If VWAP > VWAP , add +1.
– Else, add −1.
The final score ∈ , where N = (end − start + 1). With defaults (1→45), N = 45.
• Signal logic (stateful)
– Long when score > upper (e.g., > 40 with N = 45 → VWAP higher than ~89% of checked lags).
– Short on crossunder of lower (e.g., dropping below −10).
– A compact state variable ( out ) holds the current regime: +1 (long), −1 (short), otherwise unchanged. This “stickiness” avoids constant flipping between bars without sufficient evidence.
Why VWAP + a breadth score?
• VWAP aggregates both price and volume—where participants actually traded.
• The breadth-style count rewards consistency of the anchored trend, not one-off spikes.
• Thresholds give you binary structure when you need it (alerts, automation), without complex math.
What you’ll see on the chart
• Sub-pane oscillator — The for-loop score line, colored by regime (long/short/neutral).
• Main-pane VWAP (optional) — Even though the indicator runs off-chart, the anchored VWAP can be overlaid on price (toggle visibility and whether it inherits trend colors).
• Threshold guides — Horizontal lines for the long/short bands (toggle).
• Cosmetics — Optional candle painting and background shading by regime; adjustable line width and colors.
Input map (quick reference)
• VWAP Anchor Period — Day, Week, Month, Quarter, Year.
• Calculation Start/End — The for-loop lag window . With 1→45, you evaluate 45 comparisons.
• Long/Short Thresholds — Default upper=40, lower=−10 (asymmetric by design; see below).
• UI/Style — Show thresholds, paint candles, background color, line width, VWAP visibility and coloring, custom long/short colors.
Interpreting the score
• Near +N — Current anchored VWAP is above most historical VWAP checkpoints in the window → entrenched strength.
• Near −N — Current anchored VWAP is below most checkpoints → entrenched weakness.
• Between — Mixed, choppy, or transitioning regimes; use thresholds to avoid reacting to noise.
Why the asymmetric default thresholds?
• Long = score > upper (40) — Demands unusually broad upside persistence before declaring “long regime.”
• Short = crossunder lower (−10) — Triggers only on downward momentum events (a fresh breach), not merely being below −10. This combination tends to:
– Capture sustained uptrends only when they’re very strong.
– Flag downside turns as they occur, rather than waiting for an extreme negative breadth.
Tuning guide
Choose an anchor that matches your horizon
– Intraday scalps : Day anchor on intraday charts.
– Swing/position : Month or Quarter anchor on 1h/4h/D charts to capture institutional cycles.
Pick the for-loop window
– Larger N (bigger end) = stronger evidence requirement, smoother oscillator.
– Smaller N = faster, more reactive score.
Set achievable thresholds
– Ensure upper ≤ N and lower ≥ −N ; if N=30, an upper of 40 can never trigger.
– Symmetric setups (e.g., +20/−20) are fine if you want balanced behavior.
Match visuals to intent
– Enabling VWAP coloring lets you see regime directly on price.
– Background shading is useful for discretionary reading; turn it off for cleaner automation displays.
Playbook examples
• Trend confirmation with disciplined entries — On Month anchor, N=45, upper=38–42: when the long regime engages, use pullbacks toward anchored VWAP on the main pane for entries, with stops just beyond VWAP or a recent swing.
• Downside transition detection — Keep lower around −8…−12 and watch for crossunders; combine with price losing anchored VWAP to validate risk-off.
• Intraday bias filter — Day anchor on a 5–15m chart, N=20–30, upper ~ 16–20, lower ~ −6…−10. Only take longs while score is positive and above a midline you define (e.g., 0), and shorts only after a genuine crossunder.
Behavior around resets (important)
Anchored VWAP is hard-reset each period. Immediately after a reset, the series can be young and comparisons to pre-reset values may span two periods. If you prefer within-period evaluation only, choose end small enough not to bridge typical period length on your timeframe, or accept that the breadth test intentionally spans regimes.
Alerts included
• VWAP FL Long — Fires when the long condition is true (score > upper and not in short).
• VWAP FL Short — Fires on crossunder of the lower threshold (event-driven).
Messages include {{ticker}} and {{interval}} placeholders for routing.
Strengths
• Simple, transparent math — Easy to reason about and validate.
• Volume-aware by construction — Decisions reference VWAP, not just price.
• Robust to single-bar noise — Needs many lags to agree before flipping state (by design, via thresholds and the stateful output).
Limitations & cautions
• Threshold feasibility — If N < upper or |lower| > N, signals will never trigger; always cross-check N.
• Path dependence — The state variable persists until a new event; if you want frequent re-evaluation, lower thresholds or reduce N.
• Regime changes — Calendar resets can produce early ambiguity; expect a few bars for the breadth to mature.
• VWAP sensitivity to volume spikes — Large prints can tilt VWAP abruptly; that behavior is intentional in VWAP-based logic.
Suggested starting profiles
• Intraday trend bias : Anchor=Day, N=25 (1→25), upper=18–20, lower=−8, paint candles ON.
• Swing bias : Anchor=Month, N=45 (1→45), upper=38–42, lower=−10, VWAP coloring ON, background OFF.
• Balanced reactivity : Anchor=Week, N=30 (1→30), upper=20–22, lower=−10…−12, symmetric if desired.
Implementation notes
• The indicator runs in a separate pane (oscillator), but VWAP itself is drawn on price using forced overlay so you can see interactions (touches, reclaim/loss).
• HLC3 is used for VWAP price; that’s a common choice to dampen wick noise while still reflecting intrabar range.
• For-loop cap is kept modest (≤50) for performance and clarity.
How to use this responsibly
Treat the oscillator as a bias and persistence meter . Combine it with your entry framework (structure breaks, liquidity zones, higher-timeframe context) and risk controls. The design emphasizes clarity over complexity—its edge is in how strictly it demands agreement before declaring a regime, not in predicting specific turns.
Summary
VWAP For Loop distills the question “How broadly is the anchored, volume-weighted trend advancing or retreating?” into a single, thresholded score you can read at a glance, alert on, and color through your chart. With careful anchoring and thresholds sized to your window length, it becomes a pragmatic bias filter for both systematic and discretionary workflows.

VWAP Adaptive (RelVol-Adjusted)This indicator provides an Adaptive VWAP that adjusts volume weighting using RelVol (Relative Volume at Time), offering a more accurate and context-aware price reference during sessions with irregular volume behavior.
Classic VWAP calculates the average price weighted by raw volume, without considering the time of day. This becomes a serious limitation during major market events such as CPI releases, FOMC announcements, NFP, or large-cap earnings. These events often trigger massive volume spikes within one or two candles. As a result, the classic VWAP gets pulled toward those extreme prices and becomes permanently skewed for the rest of the session.
In such conditions, classic VWAP becomes unreliable. It no longer reflects fair value and often misleads traders relying on it for dynamic support, resistance, or reversion signals.
This Adaptive VWAP improves on that by using RelVol, which compares the current volume to the average volume seen at the same time over previous sessions. It gives more weight to price when volume is typical for that moment, and adjusts the influence when volume is statistically abnormal. This reduces the impact of isolated volume spikes and stabilizes the VWAP path, even in high-volatility environments.
For example, on SPY 1-minute or 5-minute charts during a CPI release, a massive spike in volume and price can occur within a single candle. Classic VWAP will immediately anchor itself to that spike. Adaptive VWAP using RelVol softens that effect and maintains a more realistic trajectory.
Key features:
- Adaptive VWAP weighted by time-adjusted Relative Volume (RelVol)
- Designed to maintain VWAP reliability during macroeconomic events
- Flexible anchoring: Session, Week, Month, Quarter, Earnings, etc.
- Optional display of Classic VWAP for comparison
- Up to 3 customizable deviation bands (standard deviation or percentage)
This tool is ideal for intraday traders who need a VWAP that remains usable and unbiased, even in volatile sessions. It adds robustness to VWAP-based strategies by incorporating time-sensitive volume normalization.

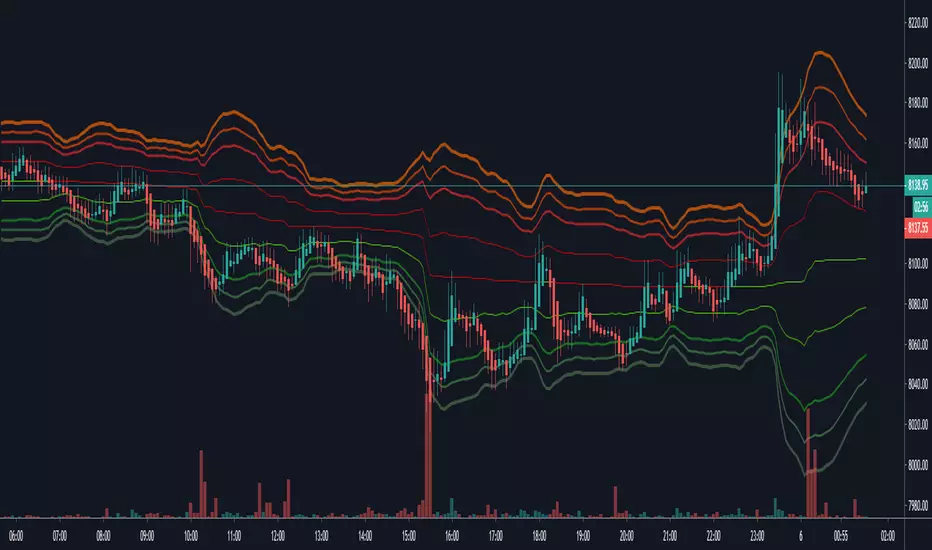
VWAP Horizon Suite Optimized - CoffeeKillerVWAP Horizon Suite Optimized - User Guide
Overview
The VWAP Horizon Suite Optimized is a comprehensive technical analysis tool for TradingView designed to enhance your trading strategy with Volume Weighted Average Price (VWAP) analysis, standard deviation bands, and customizable Exponential Moving Averages (EMAs). This indicator provides a robust framework for identifying potential support and resistance levels, price momentum, and market trends.
Key Features
- **Daily VWAP with Session Reset**: Automatically resets at 17:00 (5:00 PM) each day
- **Customizable Standard Deviation/Percentage Bands**: Up to 3 bands above and below VWAP
- **High/Low Point Detection**: Visual markers for significant price levels
- **Multiple Customizable EMAs**: 8 different EMAs that can be individually toggled and styled
- **Visual Customization**: Adjustable colors, fills, and styles for all elements
VWAP Settings
- **Source**: Determines the price data used to calculate VWAP (default: HLC3 - High, Low, Close average)
Bands Settings
- **Bands Calculation Mode**: Choose between "Standard Deviation" or "Percentage" methods
- **Show Band #1, #2, #3**: Toggle visibility for each band
- **Band Multiplier #1, #2, #3**: Adjust the distance from VWAP (in standard deviations or percentage)
- **Show Fills**: Enable colored fills between bands for better visualization
Visualization Settings
- **Show High/Low Markers**: Display diamond markers for local high and low points relative to VWAP, these reset based on the price crossing the VWAP Line.
EMA Settings
The indicator provides 8 customizable EMAs (8, 13, 21, 26, 48, 50, 100, and 200) with individual controls:
- **Show EMA X**: Toggle visibility for each EMA
- **EMA X Period**: Adjust the period length for calculation
- **EMA X Color**: Customize the color of each EMA
- **EMA Line Width**: Set the width for all EMA lines
How to Use
Basic VWAP Analysis
The core VWAP line (blue) represents the average price weighted by volume since the start of the session (17:00 daily reset). This serves as a dynamic support/resistance level and reference point for intraday trading.
1. **Price above VWAP**: Generally bullish short-term sentiment
2. **Price below VWAP**: Generally bearish short-term sentiment
3. **Crosses of VWAP**: Potential shift in short-term momentum
Standard Deviation Bands
The bands surrounding VWAP help identify potential support, resistance, and volatility levels:
- **Band #1 (±1σ)**: Price often reverts to VWAP when reaching these levels
- **Band #2 (±2σ)**: Stronger support/resistance areas, possible reversal zones
- **Band #3 (±3σ)**: Extreme price levels, often indicating overbought/oversold conditions
High/Low Point Detection
Purple and yellow diamond markers identify significant swing highs and lows relative to VWAP, helping you recognize potential reversal points or continuation patterns. (These repaint in a effort to find the max high/low point from the VWAP Line)
EMA Strategy
The customizable EMAs can be used to:
- Find potential support/resistance levels
- Create crossover systems
- Analyze market structure
Common EMA combinations include:
- 8 & 21 for short-term trends
- 50 & 200 for long-term trends and the "Golden Cross/Death Cross"
- 13 & 48 for the "New Golden Cross" - a modern alternative gaining popularity among traders
- 8, 13, 21 for complex short-term momentum analysis
Advanced Usage Tips
For Day Traders
1. **Opening Range Analysis**: Watch how price reacts to VWAP in the first hour of trading
2. **VWAP Reversions**: Look for trades when price touches outer bands and reverses toward VWAP
3. **Band Breakouts**: Strong moves beyond Band #2 may indicate momentum for continuation
For Swing Traders
1. **Use alongside daily/weekly support-resistance levels**
2. **Combine with EMA crossovers for trend confirmation**
3. **Identify potential reversal zones where price reaches Band #3**
Combined Strategies
- **EMA + VWAP Confluence**: Strong signals occur when EMA lines and VWAP/bands align at the same price level
- **High/Low + Band Touch**: When a high/low marker appears near a band, it may indicate a stronger support/resistance level
Conclusion
The VWAP Horizon Suite Optimized provides a comprehensive set of tools for price analysis based on volume-weighted data and exponential averages. By understanding and properly configuring the various components, you can create a powerful visual framework for identifying potential trading opportunities across multiple timeframes.
Remember that no indicator provides perfect signals, and the VWAP Horizon Suite works best when used as part of a complete trading strategy that includes risk management, multiple confirmation tools, and proper analysis of market conditions.
DISCLAIMER
**DISCLAIMER: This indicator and its signals are intended solely for educational and informational purposes. They do not constitute financial advice. Trading involves significant risk of loss. Always conduct your own analysis and consult with financial professionals before making trading decisions.**

VWAP DivergenceThe "VWAP Divergence" indicator leverages the VWAP Rolling indicator available in TradingView's library to analyze price and volume dynamics. This custom indicator calculates a rolling VWAP (Volume Weighted Average Price) and compares it with a Simple Moving Average (SMA) over a specified historical period.
Advantages:
1. Accurate VWAP Calculation: The VWAP Rolling indicator computes a VWAP that dynamically adjusts based on recent price and volume data. VWAP is a vital metric used by traders to understand the average price at which a security has traded, factoring in volume.
2. SMA Comparison: By contrasting the rolling VWAP from the VWAP Rolling indicator with an SMA of the same length, the indicator highlights potential divergences. This comparison can reveal shifts in market sentiment.
3. Divergence Identification: The primary purpose of this indicator is to detect divergences between the rolling VWAP from VWAP Rolling and the SMA. Divergence occurs when the rolling VWAP significantly differs from the SMA, indicating potential changes in market dynamics.
Interpretation:
1. Positive Oscillator Values: A positive oscillator (difference between rolling VWAP and SMA) suggests that the rolling VWAP, derived from the VWAP Rolling indicator, is above the SMA. This could indicate strong buying interest or accumulation.
2. Negative Oscillator Values: Conversely, a negative oscillator value indicates that the rolling VWAP is below the SMA. This might signal selling pressure or distribution.
3. Divergence Signals: Significant divergences between the rolling VWAP (from VWAP Rolling) and SMA can indicate shifts in market sentiment. For instance, a rising rolling VWAP diverging upwards from the SMA might suggest increasing bullish sentiment.
4. Confirmation with Price Movements: Traders often use these divergences alongside price action to confirm potential trend reversals or continuations.
Implementation:
1. Length Parameter: Adjust the Length input to modify the lookback period for computing both the rolling VWAP from VWAP Rolling and the SMA. A longer period provides a broader view of market sentiment, while a shorter period is more sensitive to recent price movements.
2. Visualization: The indicator plots the VWAP SMA Oscillator, which visually represents the difference (oscillator) between the rolling VWAP (from VWAP Rolling) and SMA over time.
3. Zero Line: The zero line (gray line) serves as a reference point. Oscillator values crossing above or below this line can be interpreted as bullish or bearish signals, respectively.
4. Contextual Analysis: Interpret signals from this indicator in conjunction with broader market conditions and other technical indicators to make informed trading decisions.
This indicator, utilizing the VWAP Rolling component, is valuable for traders seeking insights into the relationship between volume-weighted price levels and traditional moving averages, aiding in the identification of potential trading opportunities based on market dynamics.

VWAP Open Session Anchored by HampehThe VWAP Open Session Anchored indicator differs from traditional VWAP indicators by automatically anchoring the Volume Weighted Average Price calculation to three market session starts Morning, Evening, and Night. Each session represents a distinct time period within the trading day, offering traders and investors a more comprehensive view of the volume-weighted average price within specific sessions.
What Is the Volume-Weighted Average Price (VWAP)?
The volume-weighted average price (VWAP) is a technical analysis indicator used on intraday charts that resets at the start of every new trading session.
VWAP is important because it provides traders with pricing insight into both the trend and value of a security.
KEY TAKEAWAYS
1. The volume-weighted average price (VWAP) is a single line on intraday charts.
2. It looks similar to a moving average line but smoother.
3. VWAP represents a view of price action throughout a single day's trading session.
4. Retail and professional traders may use the VWAP to help them determine intraday price trends.
5. VWAP typically is most useful to short-term traders.
VWAP is calculated by totaling the dollars traded for every transaction (price multiplied by the volume) and then dividing by the total shares traded.
VWAP = Cumulative Typical Price x Volume/Cumulative Volume
Where Typical Price = High price + Low price + Closing Price/3
Cumulative = total since the trading session opened.
How Is VWAP Used?
VWAP is used in different ways by traders. Traders may use VWAP as a trend confirmation tool and build trading rules around it. For instance, they may consider stocks with prices below VWAP as undervalued and those with prices above it, as overvalued. If prices below VWAP move above it, traders may go long on the stock. If prices above VWAP move below it, they may sell their positions or initiate short positions.
Institutional buyers including mutual funds use VWAP to help move into or out of stocks with as small of a market impact as possible. Therefore, when they can, institutions will try to buy below the VWAP or sell above it. This way their actions push the price back toward the average, instead of away from it.
Source: www.investopedia.com

Vwap Z-Score with Signals [UAlgo]The "VWAP Z-Score with Signals " is a technical analysis tool designed to help traders identify potential buy and sell signals based on the Volume Weighted Average Price (VWAP) and its Z-Score. This indicator calculates the VWAP Z-Score to show how far the current price deviates from the VWAP in terms of standard deviations. It highlights overbought and oversold conditions with visual signals, aiding in the identification of potential market reversals. The tool is customizable, allowing users to adjust parameters for their specific trading needs.
🔶 Features
VWAP Z-Score Calculation: Measures the deviation of the current price from the VWAP using standard deviations.
Customizable Parameters: Allows users to set the length of the VWAP Z-Score calculation and define thresholds for overbought and oversold levels.
Reversal Signals: Provides visual signals when the Z-Score crosses the specified thresholds, indicating potential buy or sell opportunities.
🔶 Usage
Extreme Z-Score values (both positive and negative) highlight significant deviations from the VWAP, useful for identifying potential reversal points.
The indicator provides visual signals when the Z-Score crosses predefined thresholds:
A buy signal (🔼) appears when the Z-Score crosses above the lower threshold, suggesting the price may be oversold and a potential upward reversal.
A sell signal (🔽) appears when the Z-Score crosses below the upper threshold, suggesting the price may be overbought and a potential downward reversal.
These signals can help you identify potential entry and exit points in your trading strategy.
🔶 Disclaimer
The "VWAP Z-Score with Signals " indicator is designed for educational purposes and to assist traders in their technical analysis. It does not guarantee profitable trades and should not be considered as financial advice.
Users should conduct their own research and use this indicator in conjunction with other tools and strategies.
Trading involves significant risk, and it is possible to lose more than your initial investment.

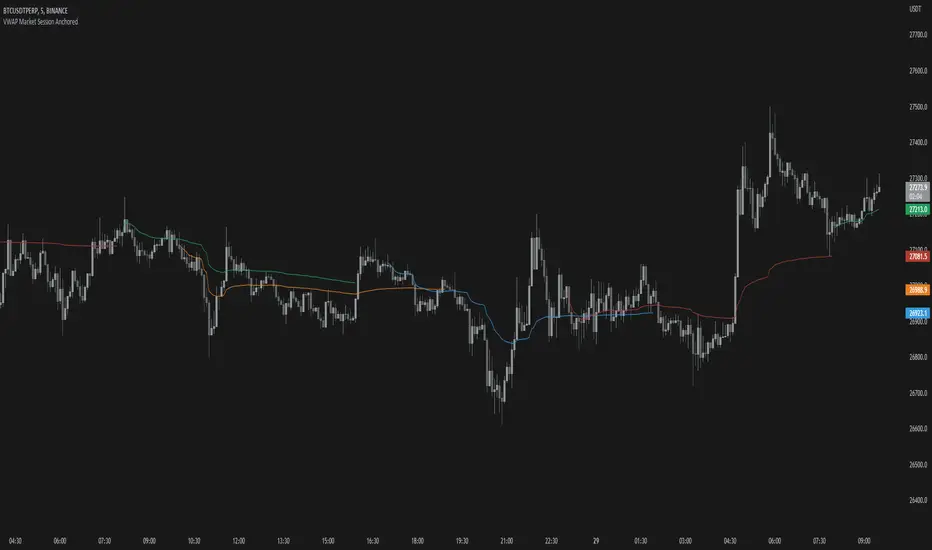
VWAP Market Session AnchoredVWAP Market Session Anchored differs from the traditional VWAP or VWAP Auto Anchored indicator in that the Volume Weighted Average Price calculation is automatically anchored to four major market session starts: Sydney, London, Tokyo, New York.
Settings
Source: the source for the VWAP calculation.
Offset: changing this number will move the VWAP either Forwards or Backwards, relative to the current market. Zero is the default.
Band: enabling this will show Standard Deviation bands.
Band Multiplier: the value the Standard Deviation bands will be multiplied by before being plotted on the chart.
Sessions : enabling the sessions will plot the respective anchored VWAP on chart.
Custom: enabling this will show a custom user-defined session.
Custom UTC : the custom session is defined by a starting UTC hour followed by the ending UTC hour.
Usage
Similar to the traditional VWAP, VWAP Market Session Anchored is a technical analysis tool used to measure the average price weighted by volume. VWAP Market Session Anchored can be used to identify the trend during a specific market session.
Limitations
When setting a custom session, be mindful that calculations are based off of the Coordinated Universal Time (UTC) time, you must convert your local time zone to UTC in order to have an accurate representation of your custom session.
It is not recommended to use this indicator on timeframes above 1 hour as market sessions only last a few hours.
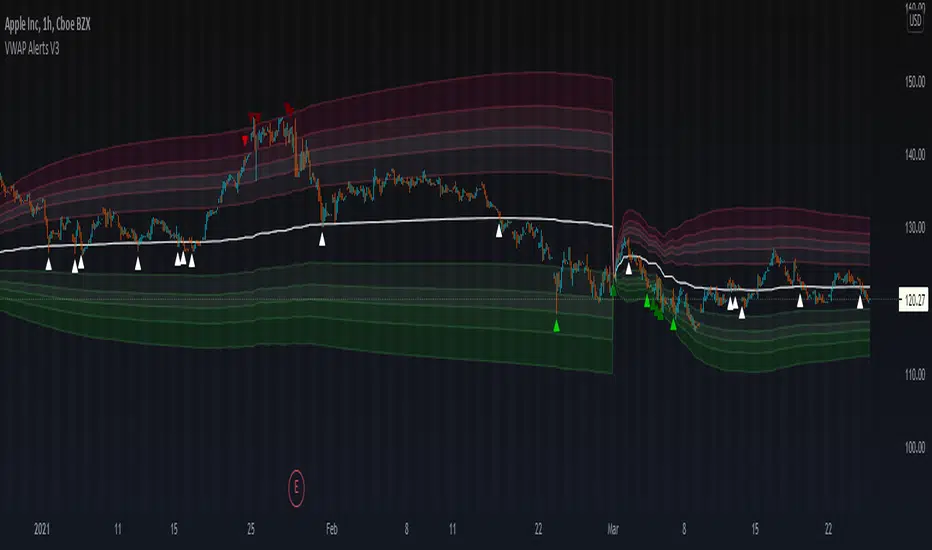
VWAP Alerts V3VWAP Alerts signal over bought/over sold conditions, relative to volume weighted average price, while deviation bands plot an extremely accurate point of mean reversion.
VWAP Alerts V3 includes multiple timeframe selection, along with multiplier input for deviation band setting
Alerts can be set for each individual band, for extreme oversold/overbought conditions, use "Vwap Low Deviation 4" and "Vwap High Deviation 4".
Alerts can also be set for VWAP bounces, by simply setting "VWAP Alert"
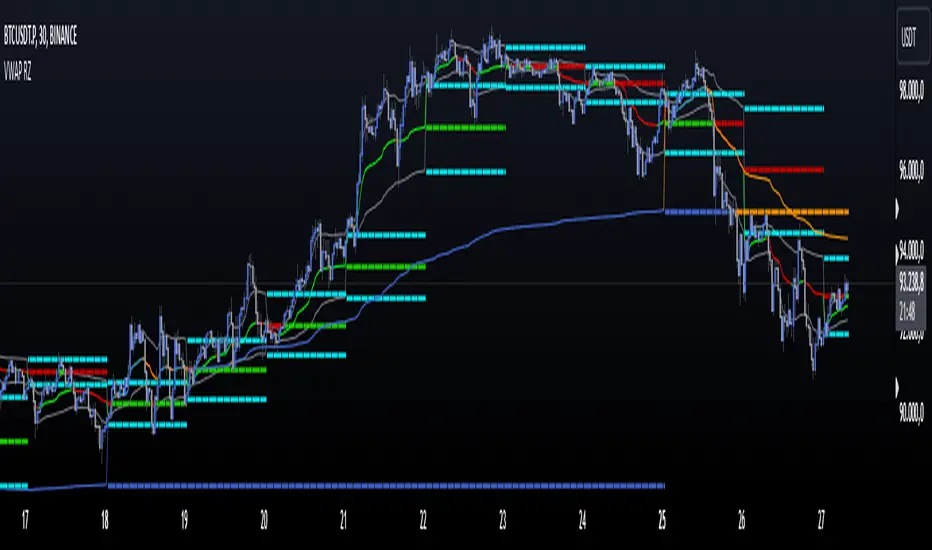
VWAP Reset Zones
With this indicator, the VWAP is displayed based on two adjustable sources. Close and Open are recommended by default.
The zone between the Open and Close VWAP is carried over to the next day as the zone at the end of the period.
The zones can be considered as support and resistance zones.
The chart illustrates the idea behind it.
In addition, the anchor function has been added so that anchor points can be set for session, week and month.
Depending on the set anchor and the selected time unit of the chart, an adjustment of the indicator to the time unit can be made.
Recommended time unit of the indicator: Session = 15 min / Weekly = 1H / Month = 4H
In addition, the zones between VWAP close and vwap open have been colored.
Bullish when the close is above the open price and bearish when the close is below the open price.
The principle is simple. If the average closing price is below the average opening price, a downtrend is to be assumed and vice versa an uptrend.
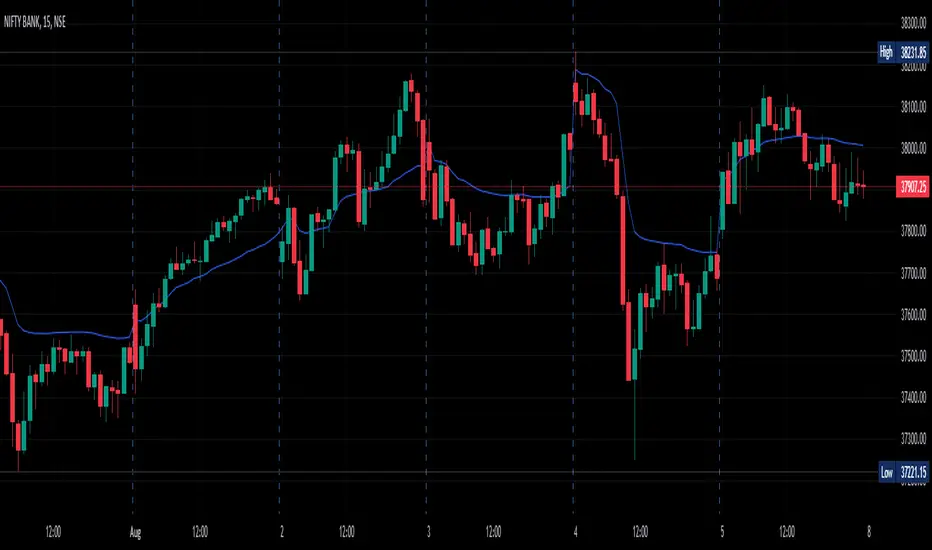
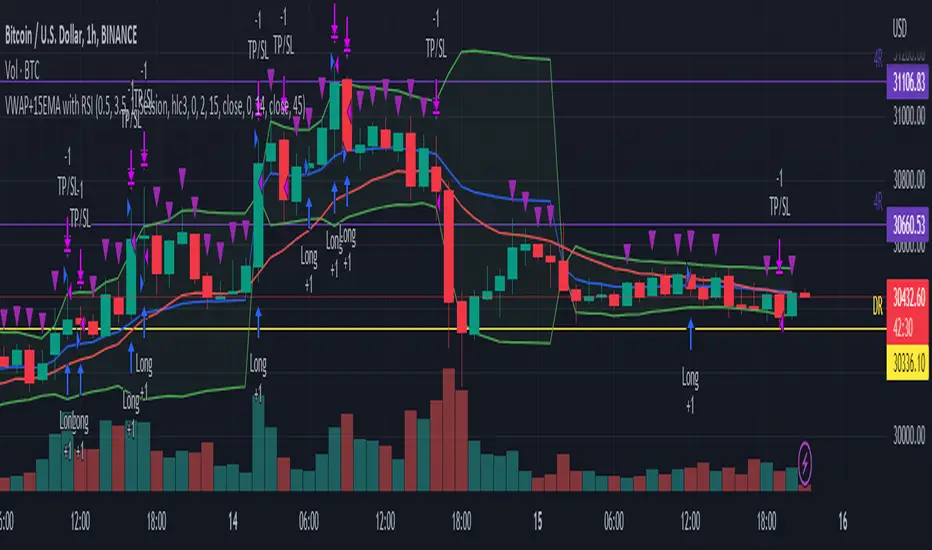
VWAP+15EMA with RSIVWAP+EMA+RSI Strategy for the group MelléCasH
This strategy will enter a long position when the closing price is above both the VWAP and the 15 EMA, and the RSI is above the specified overbought level. It will exit the position when the price falls by the specified stop loss percentage, rises by the specified take profit percentage, or when the trailing stop loss (which trails the highest price achieved after the position was entered by the specified percentage) is hit. The VWAP, EMA, and RSI indicators are also plotted on the chart for reference.
VWAP/MVWAP/SMA CROSSOVERTo use this indicator is simple.
When the VWAP (Thick Yellow) AND the two SMA (Orange and thin Yellow) cross above the MVWAP (Purple) then you will be in a uptrend that could possibly continue upwards. The opposite is true if you are looking a short opportunity, wait for the three other lines to cross under the MVWAP and you should be in a downtrend that could possibly continue downwards
Of course as with all indicators not every signal will be 100% accurate there is no way to predict human emotions when it comes to trading but based on the VWAP strategy used in other markets this is the closest I could get.
Note: Don't relay completely on this indicator to think for you. Use other forms of TA to confirm all positions before entering. And if the candles start trending the opposite direction after a lets say a mini pump/dump then the signal was false.
Finally this was made according to the 15 minute chart. I did not plan on remaking it for any other timeframes as I have left the code open for you to tweak and the setting are free to adjust aswell.
Q/A
Q: Does it repaint?
A: No, this is based on moving averages as far as I know they don't repaint.
Q: How did you come up with this indicator?
A: Went on youtube looking for trading strategies other and the usual EMA crosses and found a VWAP & EMA strat. I added the MVWAP and played with the numbers until I found something that I liked.
Q: How long have you been trading/learning pinescript?
A: Been trading less than a two months and pinescript about a month and a half.

VWAP AlertsVWAP Alerts for intraday VWAP bounces and VWAP deviation mean reversions. I am currently finalizing the alert section make it more streamlined.
Thanks to @TheYangGuizi for an amazing script

VWAP CandlesTried making candles of Vwap instead of normal price to see if something interesting would happen. Something interesting did happen as you can see.
Looks best in 4h because of reasons unknown. In lower timeframes it looks kinda stupid (moves the same as nrmal vwap). Day or above it looks the same as normal candles.
Gaps seem to work as s/r? or at least I've seen price react to those levels.
I've also seen a vwap reversal candles show (like dojis, pin bar), while price candles look normal. Could potentially give you a reversal warning?
You can also plot indicators like bollinger bands etc on the vwap candles. Just press the little plus.

VWAP PressureKey Features and Utility:
Intrabar Focus: Unlike standard VWAP, which provides a cumulative average throughout the day, the Intrabar VWAP focuses on volume-weighted price calculations within shorter time frames. This allows traders to see how price and volume interact moment-to-moment, offering a granular view of market sentiment.
Market Pressure Analysis: The indicator examines the difference between a smoothed weighted average price of the close and intrabar price movements. This analysis helps in identifying the market pressure at high volume areas. When the market exhibits high volume at low prices within a bar, it suggests accumulation, whereas high volume at high prices indicates distribution.
Momentum and Pressure Shift Signals: By applying a modified MACD calculation to the smoothed difference, the indicator provides signals on shifts in market pressure. Positive values indicate upward price momentum (buying pressure), while negative values suggest downward momentum (selling pressure).

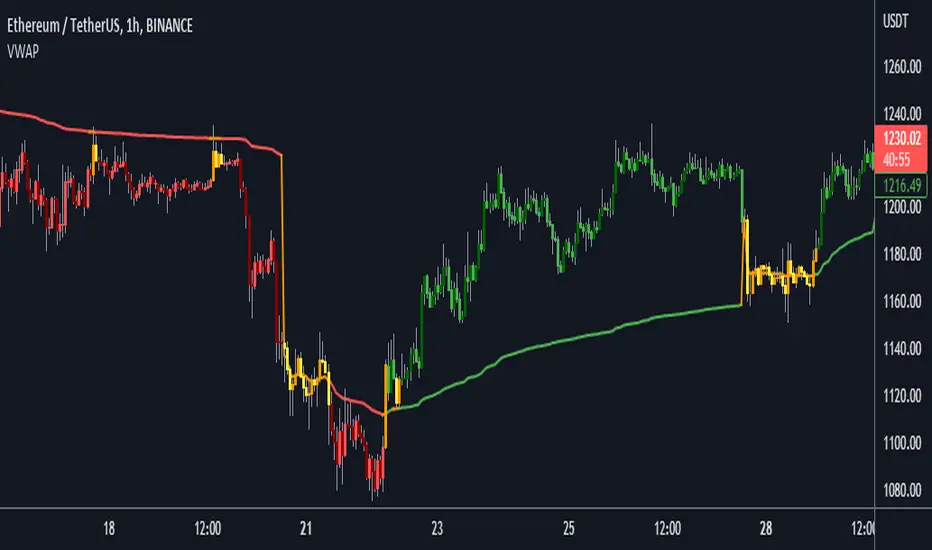
VWAP [Gu5]VWAP is primarily used by technical analysts to identify market trends.
This design is more intuitive
green: Bullish Trend
red: Bearish Trend
orange: Range
---
El VWAP lo utilizan principalmente los analistas técnicos para identificar las tendencias del mercado.
Este diseño es mas intuitivo
verde: Alsista
rojo: Bajista
naranja: Rango
VWAP MTF Custom Dates (Multi Timeframe VWAP with Custom Dates)This is extremely useful tool for analyzing the market. Brian Shannon from alphatrends.net uses this very frequently and I've programmed it for tradingview.
you can calculate the VWAP from any dates on the chart and it works with any intraday timeframe. Simply select on the settings icon and select your day month and year parameters!
Please follow for more future updates
Happy trading!
Daniel

VWAP Reversion (Sequential Stats + Profit/Loss Points)First time posting. This is my attempt to evaluate the effectiveness of VWAP reversion. I decided to make this an indicator with its own integrated stats.
If you set the session length to lets say 100, but choose a 1 minute timeframe, it will only load as many sessions as the chart will allow for that timeframe. increasing the timeframe will allow you to go back further with more sessions.
I plan to implement more and more as I refine it. I just wanted to get my working copy out into the universe. I'd like to add some method of "scaling in". Perhaps if the price goes further and further away from the original entry, say for each additional std. deviation band further, it could add another entry signal.
My trading journey is just beginning, I've never coded before, and this was made entirely through the fusion of my attempt to communicate the ideas in my head for ChatGPT to turn into code!