RSI of VWAPThis strategy inputs the vwap as source to RSI indicator.
ENTRY
When RSIofVwap crossover 70 and price is above ema200
partial exits
when RSIofVwap reaches 90 level take a portion of profit
Exit
When RSIofVwap crossdown 30
stoploss
defaulated to 5%
Risk Level
Defaulted to 10%. Based on this startegy calcuclates hiw many units can be purchased adhering to stoploss value
Note: code doesnt draw the RSI (vwap) indicator to the chart. if you want to see how these signals are generated , you can select RSI and VWAP of 14 period length.
warning
For educational purposes only
Cerca negli script per "vwap"

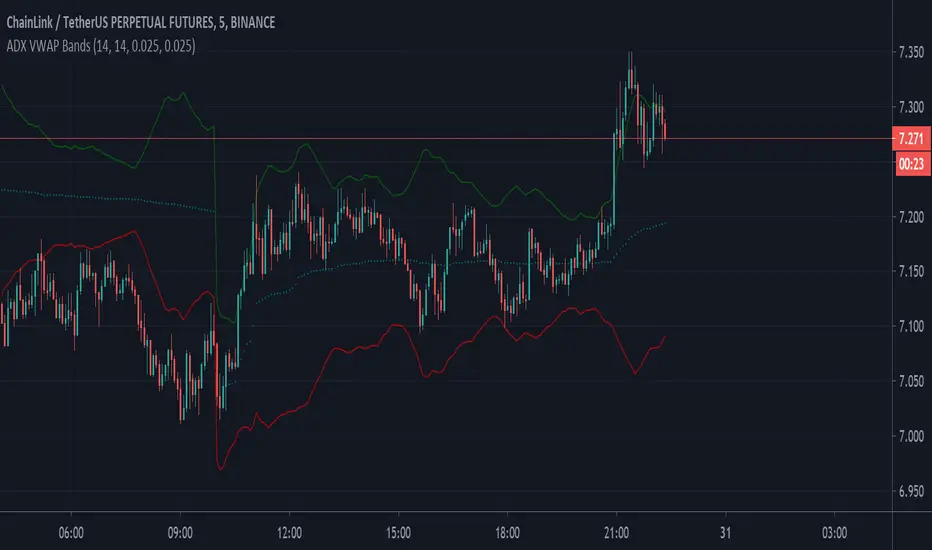
VOLATILITY Based VWAP Bands with Upper% and Lower% BandsVolatility based VWAP Bands with an Upper band x% higher than the normal VWAP and a Lower band x% lower.
The script uses ADX to create much better OVERBOUGHT and OVERSOLD regions.
- Settings Guide -
~ 0.01 in settings = 1% +/- VWAP
~ Step increment of 0.005 to make setting changes easier.
Double Vwap - JDThis indicator (The "Volume-Volatility weighted Average Price" or "Double Vwap") gives an alternative to the well known standard VWAP line with some special sauce.
The standard VWAP sometimes lags on big price moves, when there's not much volume "underneath them".
This indicator tries to combat that by adding the option to weigh in large price moves in the calculation, even without large volume,
and can give you faster targets after big "pumps" and "dumps".
Enjoy!
JD.
#nottradingadvice
#DYOR

RSI-VWAP INDICATORThis simple indicator provides great results.
It is the popular RSI indicator with VWAP as a source instead of close.
What is the Volume Weighted Average Price (VWAP)?
VWAP is calculated by adding up the dollars traded for every transaction (price multiplied by the number of shares traded) and then dividing by the total shares traded. That is, volume.
On the Backtest, trades are laddered to improve the average entrance price.

Ratio OCHL Averager - An Alternative to VWAPIntroduction
I had the idea to make this indicator thanks to @dpanday with the support of @Coppermine and @Reika. Vwap is a non parametric indicator based on volume used by lot of traders and institutions, its non parametric particularity makes it great because it don't need to go through parameter optimization. Today i present a similar indicator called Ratio OCHL Averager based on exponential averaging by using the ratio of open-close to high-low range by using monthly high/low.
The Indicator
The indicator can more recursive by checking the "recursive" option, this allow to use the indicator output instead of the open price for the calculation of the ratio of open-close to high-low range. The result is a more reactive estimation,
The indicator reactivity change based on the time frame you are in, using higher time frame result in a more reactive indicator, however it is way less reactive than the vwap, this is a personal choice since i wanted this indicator to be smooth even with high time frames, if you want to change that you use another resolution for H and L in line 5,6.
Conclusion
I presented an alternative to vwap based on the Ratio OCHL indicator. I hope you like it and thanks for reading !
Thanks to Coppermine and Reika for the support during the creation of the indicator


Price Above VWAP FilterPrice above VWAP
this shows either a zero or one if the price is above or below the vwap

Bullmart VWAP [LTF STR]Bullmart Discounted Momentum in conjunction with VWAP is an indicator for identifying areas of increased liquidity on lower timeframes, where stop losses and liquidations are most likely to occur.
The indicator is not designed to search for entry points "by signal". Its main task is to provide a context in which it is possible to understand where the price is moving due to liquidity.
Use Bullmart VWAP only in conjunction with Bullmart Discounted momentum

EMA VWAP Pro StrategyEMA VWAP Pro Strategy - Quick Summary
What it does: Generates CALL/PUT signals for day trading (designed for SPY options on 1-5 min charts)
Entry Criteria:
EMA 9 crosses above EMA 20 → CALL
EMA 9 crosses below EMA 20 → PUT
Must be confirmed by VWAP (price above for calls, below for puts)
Requires elevated volume (1.2x average)
Needs 3 candles of confirmation
Optional: 15-min timeframe must agree
Time Filters:
Trades: 10am-12pm ET & 3-3:45pm ET only
Avoids: First 15 min after open & lunch hours
Quality Score (1-5 stars):
Higher score = stronger setup
Only shows signals rated 3+ stars
4-5 star signals highlighted as "strong"
Best for: Scalping SPY 0DTE options during high-probability windows with multiple confirmations.

Weekly VWAP (ETH to RTH) - OHLC4Weekly vwap with standard deviations. The vwap will carry over ETH data into RTH when RTH mode is turned on.

Volume-Weighted Hybrid Channel [Capitalize Labs]Volume-Weighted Hybrid Channel (VWHC) is a channel-only indicator designed to visualise mean and volatility structure using a blended framework. It combines a configurable mean engine (SuperSmoother, EMA, SMA, or RMA) with an anchored VWAP component, then builds a four-level band ladder around a hybrid mean using a hybrid width that blends a range engine (ATR or true range variants) with anchored, volume-weighted standard deviation. The result is a smooth, adaptive channel intended to help us contextualise price location and volatility expansion or contraction relative to the hybrid mean.
The indicator supports Weekly or Session anchoring for the VWAP and sigma components, and includes optional transition smoothing after anchor resets to reduce visual stepping. Band levels are user-defined (with automatic ordering enforcement), and optional gradient fills can be enabled for clearer zone recognition. An optional Band Occupancy Table is included to show how frequently price closes inside each zone, either over a rolling lookback or since the most recent anchor reset. This table is informational only and does not generate signals.
This script is an indicator, not a strategy. It does not place trades, generate alerts, or provide entry or exit instructions. Outputs depend on chart symbol, timeframe, and data quality, including volume availability. The channel is designed to be non-repainting in the sense that it uses confirmed bar data and does not use forward-looking logic; however, like all indicators, the current bar can update until it closes.
Risk Warning
This material is educational research only and does not constitute financial advice, investment recommendation, or a solicitation to buy or sell any instrument. Foreign exchange and CFDs are complex, leveraged products that carry a high risk of rapid losses; leverage amplifies both gains and losses, and you should not trade with funds you cannot afford to lose. Market conditions can change without notice, and news or illiquidity may cause gaps and slippage; stop-loss orders are not guaranteed.
The analysis presented does not take into account your objectives, financial situation, or risk tolerance. Before acting, assess suitability in light of your circumstances and consider seeking advice from a licensed professional. Past performance and back-tested or hypothetical scenarios are not reliable indicators of future results, and no outcome or level mentioned here is assured. You are solely responsible for all trading decisions, including position sizing and risk management. No external links, promotions, or contact details are provided, in line with TradingView House Rules.
Disclaimer
Use of this indicator is at our own discretion and risk. It is a visual analysis tool and should be validated through independent testing and a documented trading plan before being used in live decision-making.

4 EMA + VWAP + UT Bot + SuperTrend + Daily Pivot Checklist📌 Description
This indicator is a multi-indicator trend confirmation checklist designed to simplify decision-making by combining several widely used technical tools into one clean on-chart dashboard.
The goal of this script is clarity, not complexity — helping traders quickly see market bias, trend strength, and trade direction without switching between multiple indicators.
🔹 Indicators Included
EMA 10 / 20 / 50 / 200
VWAP
UT Bot (ATR-based trailing stop with BUY / SELL signals)
SuperTrend (correct trend color logic)
Daily Pivot Point (today only)
All conditions are displayed in a YES / NO + BUY / SELL checklist panel for fast confirmation.
🔹 How to Use
Follow UT Bot BUY / SELL as the primary direction
Use EMA 200 & SuperTrend for overall trend bias
VWAP and Daily Pivot act as intraday filters
Stronger setups occur when most checklist conditions align
This indicator works best when combined with proper risk management and price action.
👥 Credits / Author Note
This script was conceptualized, tested, and refined by the publisher based on real trading use cases.
The development, logic structuring, and UI optimization were done collaboratively with AI-assisted scripting support to ensure clean code, clarity, and non-repainting behavior.
Final responsibility for trading decisions always remains with the user.
⚠️ Disclaimer
This indicator is provided for educational and informational purposes only.
It does not guarantee profits and should not be considered financial advice.
Always trade responsibly.

Open Interest Weighted Average Price [Arjo]Open Interest Weighted Average Price , or OIWAP , is a simple visual indicator that shows the average price of an asset based on changes in open interest .
Instead of using trading volume like VWAP, this indicator gives more weight to prices where new futures contracts are being added or removed . This helps highlight the price levels where traders are actively building or closing positions.
The indicator shows:
A main line that represents the average price weighted by open interest changes.
Upper and lower bands (standard deviation bands) that show how far the price moves away from this average.
OIWAP is mainly useful for NSE futures markets , where open interest data is available. It helps traders visually understand where most market participation and positioning are taking place relative to price .
Concepts:
Applies statistical concepts, including weighted averaging and standard deviation, to open interest data
Uses the absolute change in open interest as a weighting factor for each price point
Creates a dynamic average that reflects where significant open interest activity has occurred during a given period
Standard deviation bands are computed from this weighted average to show the statistical spread of prices around the OIWAP line
Resets calculations based on user-selected time periods (daily, weekly, monthly, or session-based)
Allows for fresh analysis at regular intervals
Similar concept to volume-weighted average price (VWAP) indicators, but uses open interest changes as the weighting component
Features:
Weighted Average: Calculates a central line based on contract activity.
Flexible Anchors: Allows users to choose the reset period for the calculation.
Volatility Bands: Displays outer and mid-bands to visualize price stretches.
Data Check: Built-in alerts notify you if Open Interest data is missing for a symbol.
Visual Zones: Color-coded areas help identify price location at a glance.
How To Use
When you add the indicator to your chart, you will see:
A main OIWAP line — the open-interest-weighted price level
Mid-bands around the line (±0.5 standard deviations)
Outer bands farther away (±2.0 standard deviations)
Shaded background zones between these lines
You can:
Change the reset period to see how the average behaves over different time ranges
Adjust the timeframe for open-interest data
Turn mid-bands on or off
Adjust colors and styles to improve readability
Conclusion
The OIWAP indicator serves as an educational tool for visualizing the relationship between price movements and open interest activity in futures markets
Presents a weighted average price line along with statistical deviation bands
Offers a structured framework for chart analysis
Customizable settings allow users to adapt the display to their analytical preferences
Maintains focus on visual interpretation rather than directional predictions
Functions as a supplementary charting overlay that may complement other forms of technical and fundamental analysis
Disclaimer
This indicator is for educational and visual-analysis purposes only. It does not provide trading signals, financial advice, or guaranteed outcomes . You should perform your own research and consult a licensed financial professional when needed. All trading decisions are solely the responsibility of the user.

Liquidity Levels Pro Tool - thewallranka
Liquidity Levels Pro Tool is a market-structure and liquidity-mapping indicator designed to help discretionary futures and index traders identify statistically relevant price levels where reactions, continuations, or liquidity sweeps are more likely to occur.
This script is a decision-support tool, not a signal generator. It does not issue buy/sell alerts or predict future price movement. Instead, it organizes and scores liquidity information so traders can make their own contextual decisions.
What this indicator does
The script continuously detects and maintains liquidity zones derived from price pivots, then evaluates those zones using multiple structural and contextual factors:
Repeated price interaction (touches)
Freshness (time since last interaction)
Confluence with key reference levels
Reaction behavior after contact
Session relevance (RTH vs overnight)
Market regime (trend vs mean reversion)
Time-of-day effects (open, midday, power hour)
Only the most relevant zones—based on a dynamic scoring system—are displayed to reduce chart clutter and focus attention on levels that have historically mattered.
Core components
1. Liquidity Zones
Zones are built from pivot highs and lows and expanded into areas using a configurable tick-based padding. Nearby zones are merged to avoid redundancy.
Each zone is continuously evaluated and assigned a score (0–100) reflecting its relative importance.
2. Zone Scoring (No Lookahead)
Zone scores are based on:
Number of confirmed interactions
Recency of the last touch
Confluence with prior day/week levels, VWAP, and Opening Range
Reaction quality after touches (speed and follow-through)
Session alignment (zones that “work” in the current session are favored)
Penalties after liquidity sweeps
Zones are not forward-looking and do not rely on future data.
3. Context Engine
The script classifies the current environment using VWAP slope and distance:
Trend (up or down)
Mean reversion
Mixed/transition
Time-of-day context (Open, Midday, Power Hour) is also tracked internally and influences zone scoring.
This context is displayed in the HUD to support situational awareness, not automated decisions.
4. Liquidity Sweeps
Optional sweep detection highlights situations where price trades beyond a zone and closes back inside, indicating potential stop runs or failed breakouts.
Sweeps are rate-limited and applied conservatively to avoid visual noise.
5. Trade Planning Levels (Optional)
When enabled, the script highlights the nearest high-quality liquidity level above and below price based on score thresholds.
These are intended as reference targets, not trade entries or exits.
HUD (Heads-Up Display)
The on-chart HUD summarizes:
Key reference levels (prior day/week, Opening Range)
Nearest strong liquidity above/below price
Market regime and time-of-day context
Distance to levels (ticks or points)
The HUD is fully optional, positionable, and includes resizable modes (Small / Medium / Large) to fit different chart layouts.
How to use this tool
This indicator is best used as part of a discretionary trading process, for example:
Identifying areas where price is more likely to react or pause
Framing trades around higher-quality structure instead of arbitrary levels
Filtering setups based on session and regime context
Managing expectations near known liquidity rather than chasing price
It is intentionally designed not to provide trade signals.
Limitations and important notes
This script does not predict outcomes or guarantee reactions
High-scoring zones can still fail
Liquidity behavior is context-dependent and probabilistic
No performance claims or backtested results are provided
The indicator should not be used in isolation
Past behavior does not imply future results.
Chart and usage notes
The script is intended for standard time-based charts
Recommended for liquid futures and index products
Use a clean chart for clarity when publishing or sharing
No external indicators are required
Final note
Liquidity Levels Pro (Tool) — v6 is designed to organize complex market structure into a clear, readable framework, allowing traders to focus on execution and risk management rather than raw level detection.
This script reflects an analytical approach to intraday liquidity and structure, not an automated trading system.

Multi-Tool VWAP + EMAs (Multi-Timeframe) + Key LevelsDescription
This indicator combines several commonly used technical analysis tools into a single script, especially useful for traders using the free version of TradingView or anyone looking to reduce the number of indicators on their chart.
The goal is to provide clear visual references for trend, structure, and key levels—without generating buy/sell signals or automated trading functions.
Included Features
1. VWAP (session-anchored)
Source: HLC3
Purple line, thickness 2
Useful as a reference for daily institutional average price.
2. EMAs of the current timeframe
EMA 200 (red, thickness 3)
EMA 9 (green, thickness 1)
These EMAs help visualize long-term trend and short-term momentum.
3. Dynamic EMAs (MTF – Multi-Timeframe)
The indicator displays the 200 EMA from higher timeframes as dynamic horizontal levels:
5 minutes
15 minutes
30 minutes
1 hour
4 hours
1 day
Each level includes a descriptive label such as “15 min EMA 200”.
These EMAs serve as reference points for potential support/resistance areas coming from higher timeframes.
4. Automatic Key Levels
The indicator plots several important price levels:
Previous day:
PDH (Previous Day High)
PDL (Previous Day Low)
Previous Day 50% Fibonacci level
Pre-market (04:00–09:30 exchange time):
PMH (Pre-Market High)
PML (Pre-Market Low)
Current session:
Open (session opening price)
Previous Close (prior day’s closing price)
Purpose and Scope
This script is designed to provide basic visual reference points to support discretionary analysis.
It does not generate signals or trading suggestions, and it is not intended to predict future price movements.
How to Use It
Enable or disable each block in the Inputs section according to your analysis style.
Observe how the levels, EMAs, and VWAP interact with market structure.
Use it as a visual complement to your personal technical analysis.
Limitations
This indicator is not a trading system and does not guarantee results.
It does not include alerts, backtesting, or entry/exit logic.
Some values (such as PMH/PML) depend on the symbol’s exchange trading hours.
Credits
Designed as an educational and analytical tool for traders seeking to simplify their charts without losing key information.

Bappa - Dynamic VWAP Simple Vwap, just dynamic colour Coding added to sense whether VWAP is in uptrend or downtrend. Refer to colour code to enter Call side or Put side, it never disappoints you at any timeframe. Enjoy & happy Trading!!
Better results if used in conjuction with Pivots/ fractals indicator, named as Bappa EMA + BBW (V2) indicator.

AnAn Master: VWAP + EMA9/21 + Spike Arrows (simple)AnAn Master: VWAP + EMA9/21 + Spike Arrows (simple)AnAn Master: VWAP + EMA9/21 + Spike Arrows (simple)

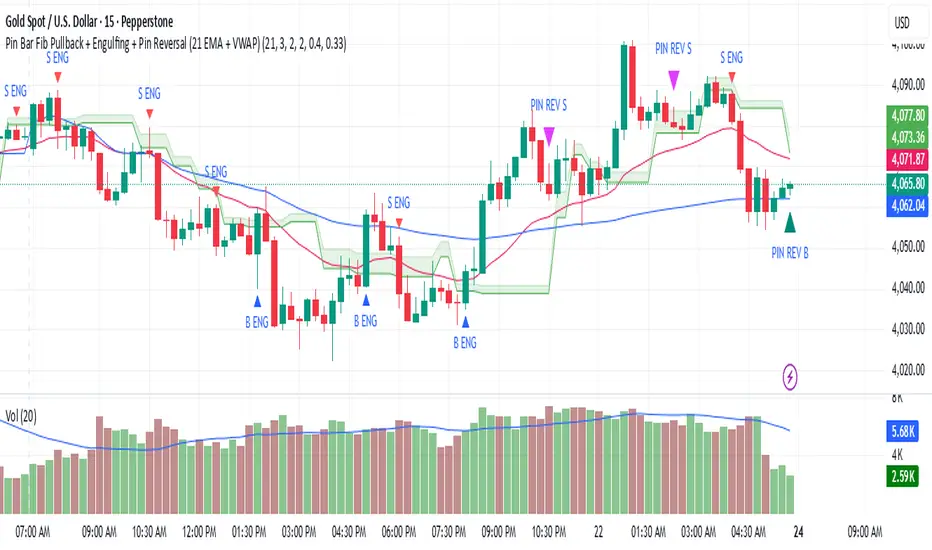
Pin Bar Fib Pullback + Engulfing + Pin Reversal (21 EMA + VWAP)21 EMA = trend filter
VWAP = intraday mean price filter
Fibs = 0.50 & 0.618 “golden pocket” from latest swing range
Signals = Pin bars + Engulfing candles inside that Fib zone, with trend + VWAP filter
Institutional Volume Flow (IVF) with VWAP & Zones. Accumulation Zone (Green Background)Logic: Signals potential institutional buying at the low.Conditions: The current close price is below VWAP $\text{(close} < \text{VWAP)}$, AND there has been at least one Aggressive Buy (IVF) bar within the last $\text{N}$ bars.2. Manipulation Zone (Red Background)Logic: Signals a Stop Hunt or False Breakout where the market briefly takes out a previous extreme before reversing with institutional conviction.Conditions:False Break High: Current high is a new 2-bar high, immediately followed by an Aggressive Sell (IVF) bar.False Break Low: Current low is a new 2-bar low, immediately followed by an Aggressive Buy (IVF) bar.3. Compression Zone (Purple Background)Logic: Signals a period of low volatility where price is "coiling up" for a large move.Conditions: The bar's range $\text{(high} - \text{low)}$ is consistently small (less than a multiplier of the Average True Range (ATR)) for a specific number of bars.The zones are plotted using bgcolor() for a visual area on the chart and plotshape() to mark the specific bar where the condition is met. Manipulation is given the highest plotting priority to ensure it's visible over other zones if conditions overlap.Would you like me to elaborate on the typical trading strategy associated with any of these three zones (Accumulation, Manipulation, or Compression)?

Mag 8 ± VWAP AlertI have been following Mag 7 plus Avgo for directional indicators for overall market. This is a chart that displays those over or under vwap and alerts can be added, ie 4 of 8 are under vwap, etc.

Advanced Intraday Darvas BoxThis indicator applies a modern Darvas Box strategy for intraday traders, using non-repainting pivot detection combined with strong filters to reduce chart noise:
Confirmed swing highs and lows: Boxes only form when genuine swing pivots appear, ensuring fully non-repainting signals.
Minimum box height: Small, "noise" boxes are filtered out using ATR multiples for meaningful zones.
Trend filter: Choose EMA, SMA, or VWAP to lock boxes and breakouts to market direction.
Volume confirmation: Boxes are only confirmed when volume is above a user-defined threshold, highlighting high-participation moves.
Breakout filter: Signals trigger only if the breakout candle closes substantially beyond the box, reducing false breakouts.
Limited box display: Recent boxes only, keeping your chart clean and readable.
Features & Inputs
Pivot sensitivity: Set the number of bars for swing calculation.
Box filtering: Specify the minimum ATR multiple for box size.
Trend selection: EMA, SMA, VWAP, or None.
Volume filter & threshold: Activate for greater breakout confidence.
Breakout/Breakdown strength: Set how far price must close beyond the box to signal power.
Maximum boxes: Control the number of active boxes to keep the chart clear.
How to Add and Use
Add to Chart:
Click the “Add to Favorite Scripts” star to mark this indicator.
Open your desired intraday chart (1m–30m works best).
Click “Indicators,” search for “Advanced Intraday Darvas Box,” and add to your chart.
Customize Inputs:
Use the settings gear ⚙️ to adjust pivot sensitivity, trend logic, box filtering, and volume confirmation.
Lower minimum box height or pivot length for more frequent signals. Raise them for sparser, higher conviction setups.
Reading Darvas Boxes:
Box Edges: Horizontal lines mark resistance (top) and support (bottom) of detected zones.
Shaded regions: Highlight the most relevant trading zones and where price could coil before breakout.
Breakout labels (↑/↓): These appear only when price makes a powerful, confirmed move beyond the box edge—aligned with trend.
Alerts: Turn on chart alerts using the “Strong Bullish Breakout” or “Strong Bearish Breakdown” alert conditions for automated signal monitoring.
Best Practices:
Use Darvas boxes to complement price action analysis. Combine with candlestick patterns, volume spikes, and other price structure.
Only trade strong breakout signals confirmed by volume and market direction.
Avoid excessive boxes—adjust "Max Boxes" and filters for your instrument and timeframe.
Important
This indicator is non-repainting and built for display clarity and clean signals.
No brokerage automation, no external linking, and pure price/volume logic—fully compliant with TradingView House Rules.
Always test settings and confirmations before using for live decision-making.

Weekly Futures VWAP (Major Indices) - StableAutomatically puts the VWAP anchor on Sunday opening of futures at 16:00, you are able to toggle on/off VWAP bands and of course enter alerts

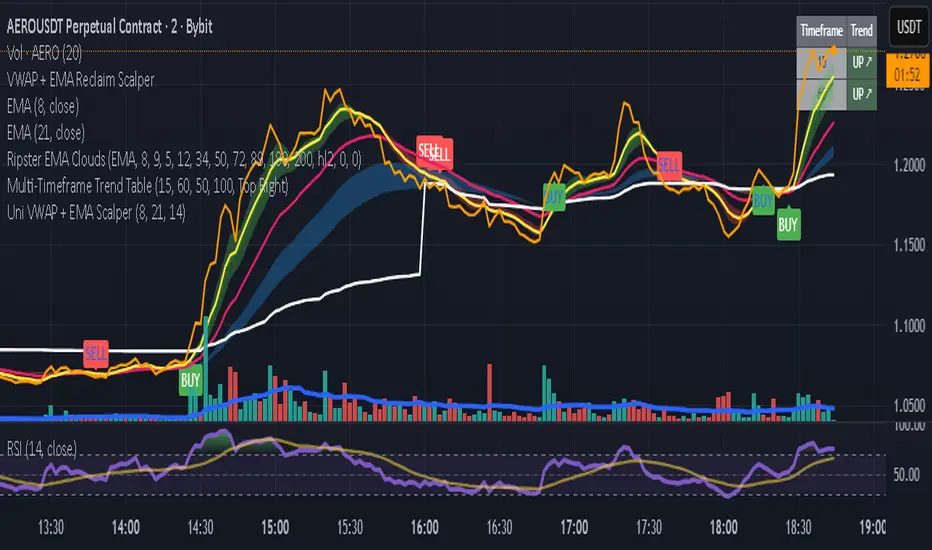
Uni VWAP + EMA ScalperSimple VWAP + EMA crossover test script for personal use and signal experiments.
Prototype tool combining VWAP and EMA crossovers for testing trade timing. Not optimized for live trading.