AnAn Master: VWAP + EMA9/21 + Volume Spike ArrowsAnAn Master: VWAP + EMA9/21 + Volume Spike Arrows to help with spikes
Cerca negli script per "vwap"

Sniper BB + VWAP System (with SMT Divergence Arrows)STEP 1: Load two correlated futures charts.
Example: CL + RB/SI+GC/ NQ+ES
STEP 2: Add Bollinger Bands (20, 2.0) on both.
Optional add (20, 3.0).
STEP 3: Watch for a BB tag on one chart but not the other.
STEP 4: Wait for a reclaim candle back inside the band.
STEP 5: Enter with stop below/above the wick + 3.0 BB.
STEP 6: Scale out midline, then opposite band.
STEP 7: Hold partials when both pairs confirm trend.
*You can take the vwap bands off the chart if it is too cluttered.

TFU Multi-Symbol Screener + VWAP + Table Size Option + Blank RowTFU Multi-Symbol Screener + VWAP + Table Size Option + Blank Row

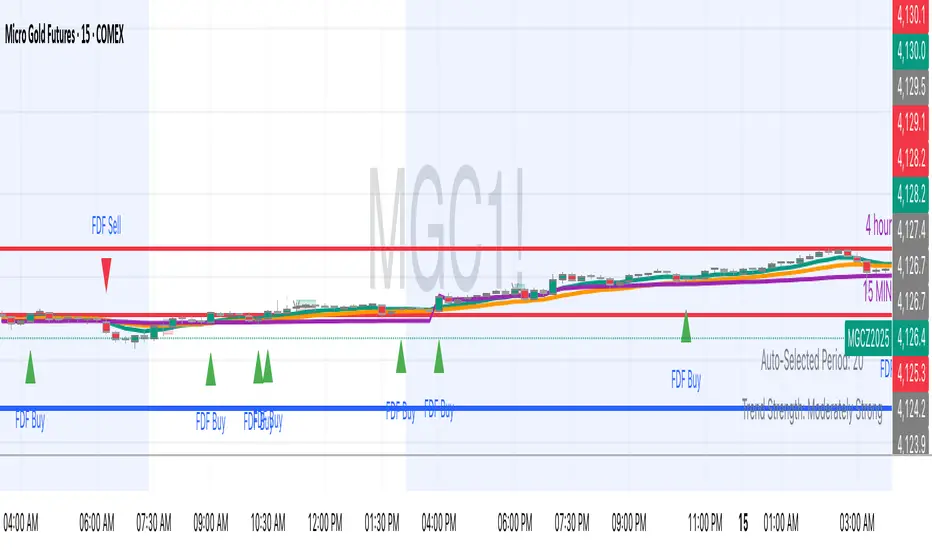
FDF — EMAs+VWAP with setup & entry (stable scale)the 9 and 21, vwap - and support an restianst, marking each entry when it pulling in our out to the 21. used 90% of the candle over the 21
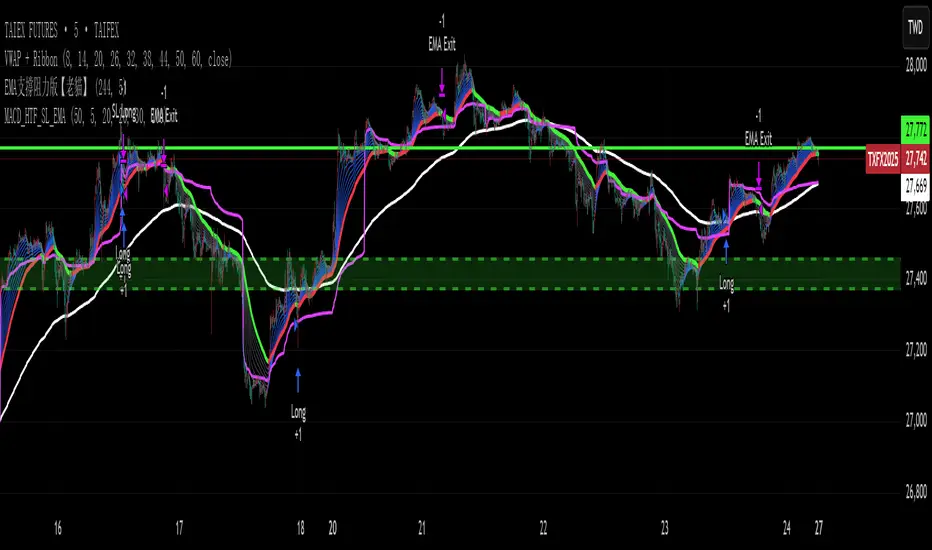
EVWMA VWAP MACD Strategy - HTF Trigger with SL & EMA ExitEVWMA VWAP MACD Strategy - HTF Trigger with SL & EMA Exit

EVWMA VWAP MACD Strategy - HTF Trigger with SL & EMA ExitRENEW TRY IT EVWMA VWAP MACD Strategy - HTF Trigger with SL & EMA Exit
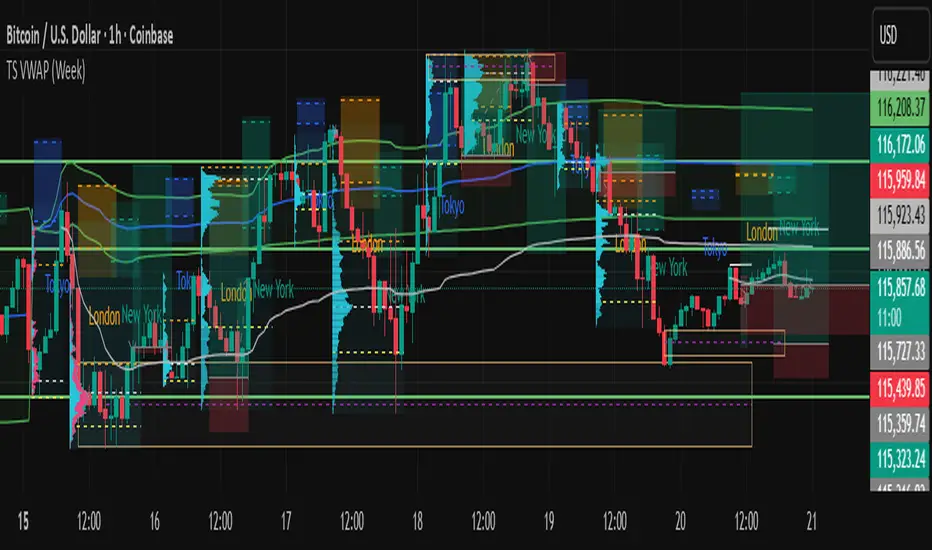
Rolling VWAP x3editable rolling vwap, 3 lines, simple, can edit all 3, preset to 7/30/90 day. Just made it to declutter indicators, good luck.

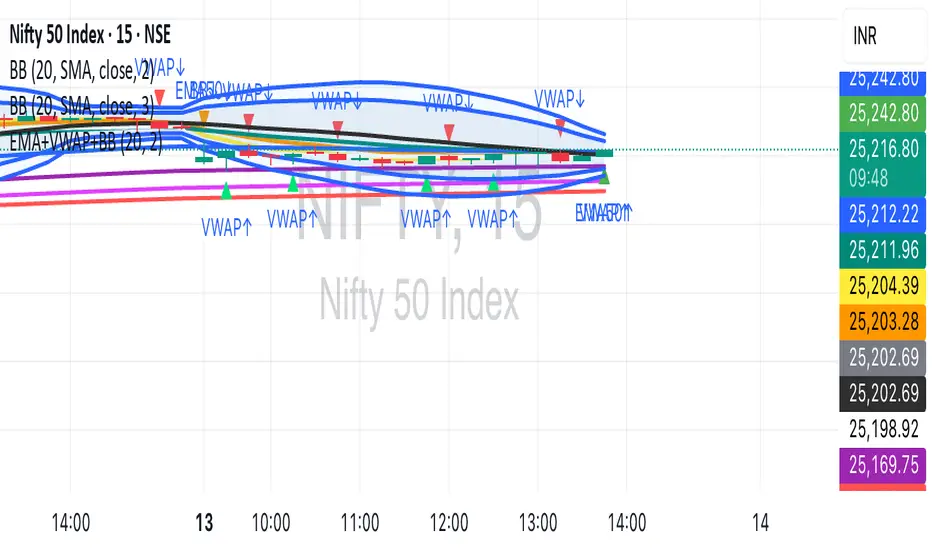
EMA (5, 10, 20, 50, 100, 150, 200)+VWAP+BBEMA Cluster + VWAP + Bollinger Bands + Alerts + Visual Signals (Fixed)
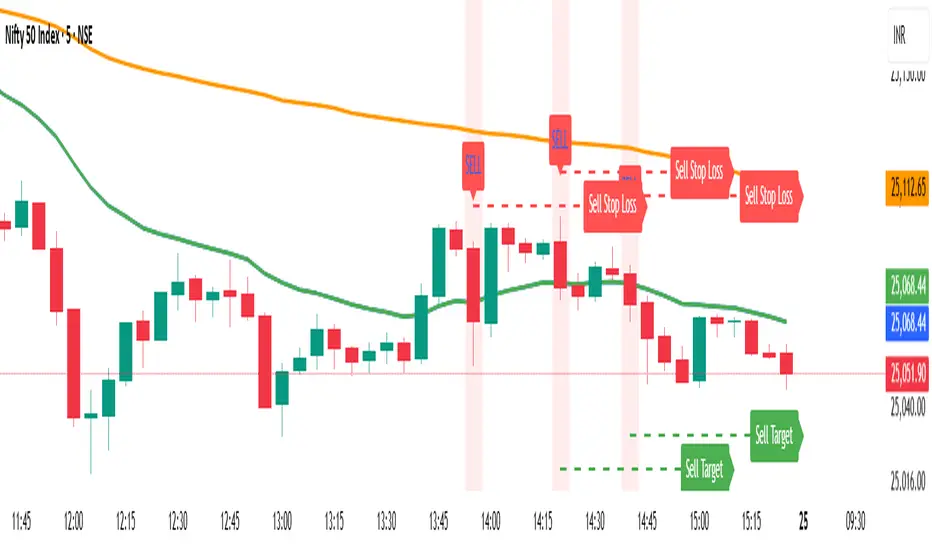
Santhosh VWAP + 3 EMA + Buy Sell AlertI have combined VWAP and EMA , along with this generated buy and sell alert based on ATR . Best for Scalping
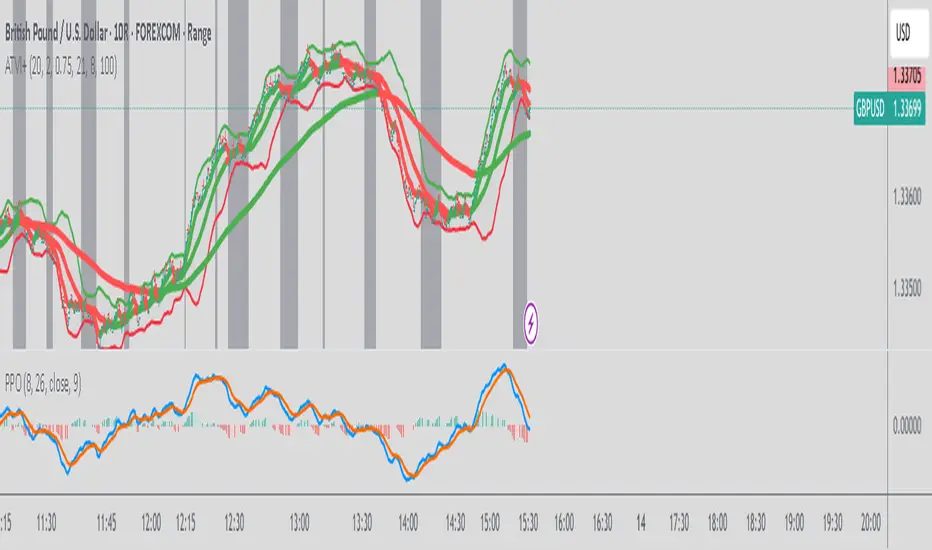
TWAP + VWAP ConvergenceThis script:
Plots VWAP and TWAP
Detects intersections
Highlights candles where they cross beneath price
Optional: Alert condition when intersection occurs


Howard Intraday Edge (JH Edge) - (VWAP + EMA9/EMA21 + RSI)Howard Intraday Edge (JH Edge)
A disciplined intraday trading system by J. Howard.
Uses VWAP, EMA 9/21, RSI, and Optional EMA 200 to confirm trends and momentum.
Automatically plots Clean stop-loss and take profit levels. Built for SPY 0DTE-5DTE options, but works on other liquid tickers.
Focus: 1-3 high probability trades/day with tight risk control.
Best used on 1 or 3 minute timeframes.

OPEN = LOW + VWAP + Volume SurgeTradingView Pine Script that scans for OPEN = LOW, confirms VWAP support, and checks for volume surge — tailored for your intraday breakout strategy

Dwaggy Scalping Trio (VWAP + EMA + RSI)First attempt at pine script this is a scalping indicator that combines VWAP, EMA, and RSI to signal entry/exit for scalping lower time frames

Turnover & RVOL with MA & VWAP This scrip shows
Turnover for the day
Relative Volume
VWAP
Moving Averages
Special : Just hover the cursor over the historic bars to see the values at that point of time instead of using replay option.

Advanced Trend & Volatility Indicator (VWAP & EMA360)Bollinger band with adjustable NO TRADE tool. green buy and red sell signals for 20 moving average added 360 moving average for micro trading. Has VWAP and additional EMA defaulted to 9 (adjust to your style). For confluence use this along with an RSI over bought and over sold WMA with similar green buy and red sell signals.


Multi Time Frame Supporting Candles (with EMA/VWAP)Overview
This script provides a clean and, most importantly, correctly-scaled Multi-Time-Frame (MTF) analysis panel. It displays the candles of a higher timeframe (e.g., 1-hour candles while you are on a 5-minute chart) in a separate pane below your main chart.
Crucially, it solves a common Pine Script scaling issue, allowing you to plot indicators like EMA and VWAP from the higher timeframe alongside the candles without distorting the display. This tool is essential for traders who practice Multi-Time-Frame Analysis, helping you stay aware of the larger trend context while executing trades on a lower timeframe.

Auto AVWAP (Anchored-VWAP) with Breakout ScreenerAuto AVWAP (Anchored-VWAP) with Breakout Screener. fINAL VERSION

EMA 20 and Anchored VWAP with Typical PriceIntraday scalping using EMA 20 and VWAP along with targets and Stoploss
Out of the Noise Intraday Strategy with VWAP [YuL]This is my (naive) implementation of "Beat the Market An Effective Intraday Momentum Strategy for S&P500 ETF (SPY)" paper by Carlo Zarattini, Andrew Aziz, Andrea Barbon, so the credit goes to them.
It is supposed to run on SPY on 30-minute timeframe, there may be issues on other timeframes.
I've used settings that were used by the authors in the original paper to keep it close to the publication, but I understand that they are very aggressive and probably shouldn't be used like that.
Results are good, but not as good as they are stated in the paper (unsurprisingly?): returns are smaller and Sharpe is very low (which is actually weird given the returns and drawdown ratio), there are also margin calls if you enable margin check (and you should).
I have my own ideas of improvements which I will probably implement separately to keep this clean.
