Cerca negli script per "vwap"

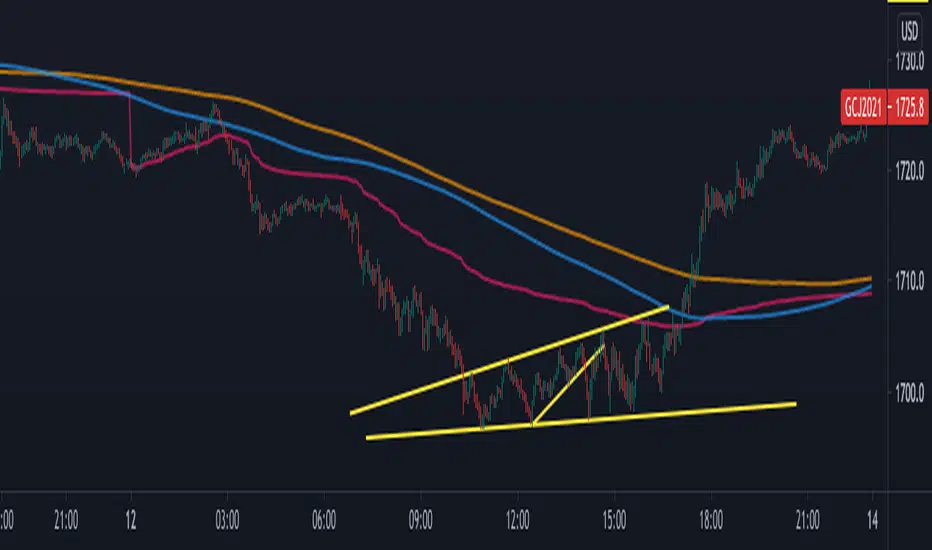
VWAP-ATR-SSLThis is an experimental idea to transform the original script created by @Fleite28 in a kind of SSL with volatility bands.
@Fleite28 has made all script and he have all credits, I just give him this idea.
I'm using this indicator to confirm:
1-potential bull trend (when you have 2x green lines with support)
2-potential bear trend (2x lines red - resistance)
3-consolidations (inside green support and red resistance).
Try to use this with a Market Profile Volume and some trend lines.
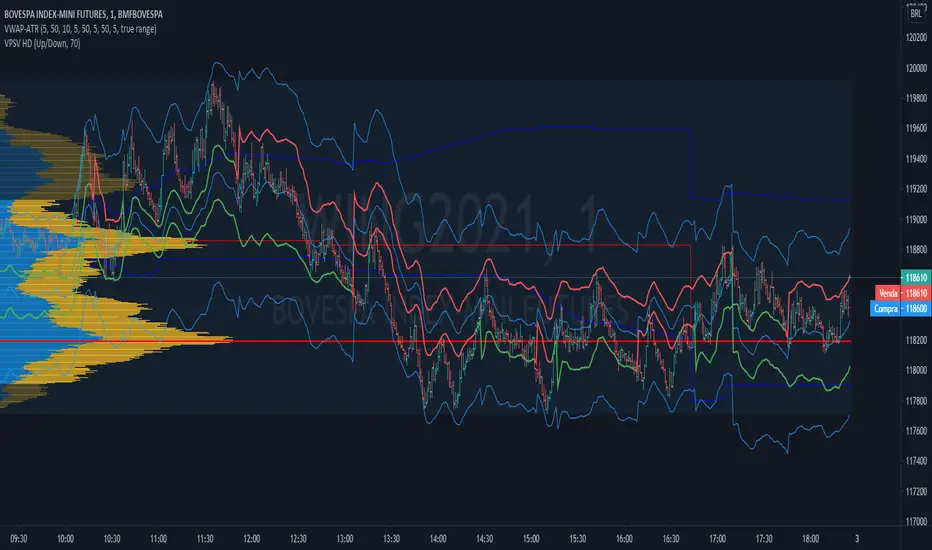
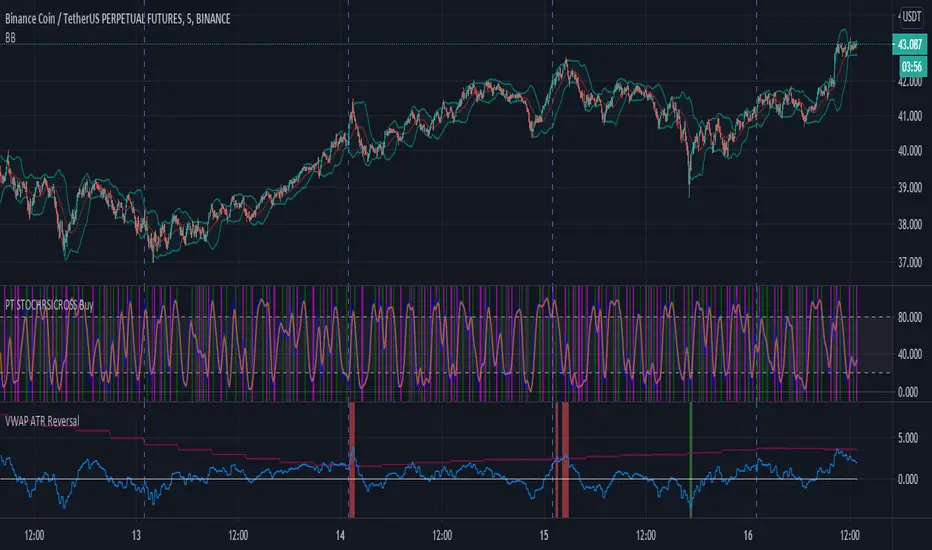
VWAP ATR ReversalThis script finds tops and bottoms using ATR and MVWAP. It works by signaling when price is far away from MVWAP and ATR therefore it is likely to reverse.
VWAP Relative Strength Index [CC]This is a custom indicator of mine that uses the volume weighted average price instead of the close price as the source for calculations of the relative strength index. Buy when the indicator line is green and sell when it is red.
This was a custom request so let me know if there are any other scripts you would like to see me do or if you want something custom done!


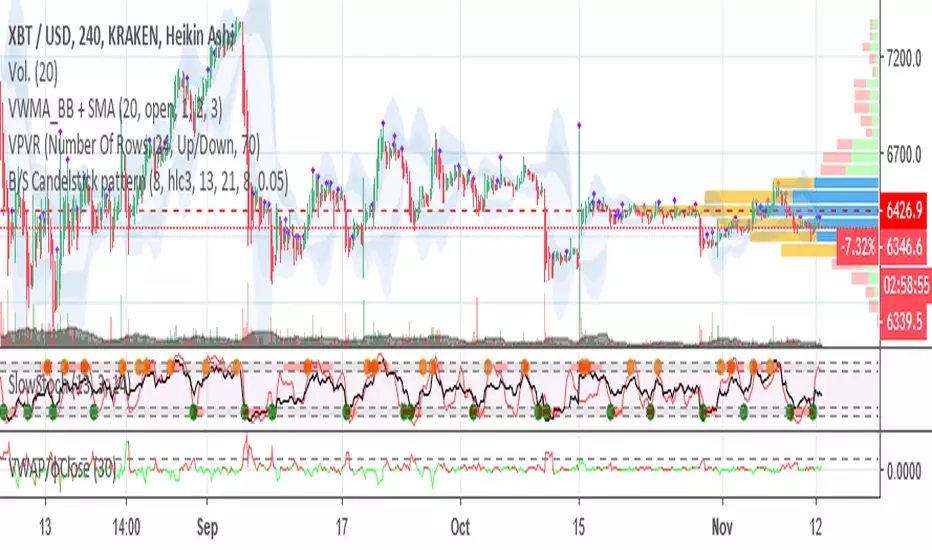
VWAP/CloseHey!
This time I'm going to introduce you to an indicator which catches volume spikes and its respect price change, to give an idea of the following price action.
The logic is pretty simple:
Value > 1 : High Volume that changed a lot the price, next price action will follow that trend.
Value < 1 : Low volume that changed a lot the price, trend is weak.
Value = 1 : Volume and price change is balanced, trend would continue based on the previous values.
If you have any doubt just comment!
φ

Stock ScreenerMissing great trade opportunities is annoying, and unless you have 12 screens or only trade one market, you are missing a lot of trades. To fix that, we created this stock screener so you get notified instantly of potential great trading conditions in real time, right on your chart.
You get notified of trading benchmarks being met by the value being displayed on the scanner as well as a color change so that it grabs your attention and makes you aware that you should take a look at the other market and look for a potential trade. It also has built in alerts so you can have an alert notification go off when any of your trading conditions are met instead of needing to watch the scanner for color changes.
The screener will change the ticker symbol background color to red green when price is above or below the previous daily range and above or below both VWAPs. This signals that the ticker is trending, which typically means it is a great time to trade that market and follow the trend.
This stock screener allows you to scan up to 10 different markets at the same time for various different conditions so you always know what is going on with your favorite trading symbols. If you want to scan more tickers, just add the indicator to your chart again and change the table position to the other side of the screen and update the tickers on the 2nd screener, allowing you to have 20 tickers at a time.
The scanner can be fully customized by changing the markets that it screens and turning on or off as many of them as you would like. You can also turn on or off any of the different data sets so that you only get information about trading conditions that matter to you.
The screener can provide data on any type of market, such as stocks, crypto, futures, forex and more. Each ticker can be adjusted to whatever market you would like it to scan for data in the settings panel, the only limitation is that it will not provide data for the VWAP and volume trend score if the ticker you are screening does not provide volume data.
Screener Features
The scanner will provide the following types of data for each ticker that is turned on:
Volume - Provides a volume score compared to the average volume and notifies you of higher than normal volume and volume spikes on individual bars by changing colors.
Volatility - Provides a volatility score compared to the average volatility and notifies you of higher than normal volatility by changing colors.
Oscillator - Choose between the RSI or CCI. The value of that oscillator will be displayed and will notify you when values are in extreme ranges such as overbought or oversold conditions according to the threshold values you enter in the settings panel. When those thresholds have been breached, you will be notified by it changing color.
Big Candles - Compares the current candle to average previous candle sizes, and changes color to notify you of big candles including a big top wick, big bottom wick, big candle body and big candle high to low range.
Daily Level Touches & Trends - Calculates and displays various daily candle and intraday open price levels that act as support and resistance. Notifies you when price is touching any of the daily levels that are turned on. The levels you can have on are as follows: previous day high, previous day low or previous day open. It also will notify you when price is touching the current day’s open, NY 930am open, Asia 8pm open, London 2am open and NY midnight 12am open. It will also say “Above” if price is above the previous day’s high or it will say “Below” if price is below the previous day’s low. The color of the cell will also change when a level touch is happening or price is above the previous day high or below the previous day low.
VWAP - Choose from 2 different VWAP lengths, default settings are daily and weekly VWAPs. You will get notified if price touches either of the VWAPs and they will also say “Above” or “Below” if price is currently above or below each VWAP.
How To Use The Screener To Help You Trade
The main purpose of the screener is to scan other markets and notify you of potential good trading opportunities such as price bouncing off of the daily levels or VWAPs. It can also be used to know when price is trending according to the VWAPs and daily levels. Lastly, you can use it to know how the volume and volatility trends are currently which gives you more confidence in taking a trade with this data when volume and volatility are present.
Volume Score
When volume is high, this represents a good time to trade because there are many market participants and price is likely to be volatile while there is high volume which can present a lot of good trade setups for you to take.
The volume score shown on the screener measures the current volume trend compared to previous volume trends and calculates that into a score based on 100 being the same as the previous volume trend. So any value above 100 means it is high volume and any value less than 100 means it is lower volume than normal.
In the settings panel, you can adjust the volume threshold that needs to be met for a volume notification to show up. The default setting is at 120, so you will get notified when the current volume trend score is 120 or higher or you can adjust that threshold value to whatever value you prefer.
It also will notify you when there is a volume spike on the current bar. This is determined by calculating an average of the recent volume totals and then checking to see if the current bar is greater than or equal to that average multiplied by 3. So if a single bar has volume that is greater than 3 times what the average volume is, then you will get a notification that says “Spike” to make you aware of that volume spike.
The volume trend threshold, volume spike multiplier and lookback length for the average volume used in volume spike calculations can all be adjusted in the settings panel to fit your desired preferences.
Volatility Score
High volatility can mean it is a great time to trade because the market is moving quickly and providing large enough movements that you can get in and out in a short amount of time, while still accruing decent sized trade PnL.
The volatility score will calculate the current volatility for each market compared to previous conditions and then divide the current volatility by the average volatility to give you a volatility score. Anything over 100 means the market is decently volatile and you should look at that market to find potential trade setups to execute on. Anything below 100 means the market is not very volatile and it is usually best to just wait until volatility returns before you start trading again.
The screener will notify you when the volatility score is above the threshold you set. The default value is set to 90, but can be adjusted to your preference. Pay attention to any market that shows an alert and take a look at that chart because the high volatility may present a good trade setup for you in the near future.
Oscillator Score
The oscillator data can be switched between Relative Strength Index(RSI) and Commodity Channel Index(CCI).
The RSI provides a value between 0 and 100 that indicates the momentum and strength of the recent price action. Many traders use the extremes of the 0-100 range to signal overbought or oversold conditions and use that as a sign to look for price to reverse in the near future. The typical values used for this and the default settings to provide notifications are: 70 for overbought and 30 for oversold. The scanner will notify you when the RSI value is considered overbought or oversold so you know to take a look at the chart and analyze if it is ready for a trade to be taken.
The CCI provides a value that can be used to determine the trend strength of the underlying asset when the oscillator moves above 100 or below -100. These extreme values are outside of the normal accumulation range and signify that price is moving strongly in that direction so it may be a good time to take a trade in the direction of the trend. The scanner will show you the value of the CCI for each market and notify you if that value is above 100 or below -100.
Both RSI and CCI settings can be adjusted in the settings panel to your desired settings so you have the exact oscillator settings you prefer to use as well as the exact values that you want to use for being notified.
Big Candles
Big candles can mean that many traders are buying or selling at the same time and many times indicate a good signal to trade in that same direction. That is why we included this calculation in the screener, so you are always aware when a large candle prints.
It calculates the average size of the recent candles and then uses that average as the benchmark to determine if the current candle is considered big and worthy of notifying you to take a look at that chart.
You can adjust the multiplier used for the big candle threshold to whatever you desire, but the default setting is 3 which means the candle will be considered big and notify you if it is 3 times as large as an average candle.
The big candles data will track the following candle values and notify you with these labels:
High to Low candle size = HL
Candle Body from open to close candle size = OC
Top Wick size = TW
Bottom Wick size = BW
Daily Level Touches & Trend
Daily level touches are excellent levels to watch for price to bounce because they often act as support and resistance levels for intraday trading. The scanner will track each market and notify you when the current candle is touching any of the daily levels that you have turned on in the settings panel.
The main levels that are turned on by default and are useful for all markets and how they will be labeled on the scanner are as follows:
Previous Day High = High
Previous Day Low = Low
Previous Day Open = < Open
Previous Day Close = Close
Current Day Open = Open
We also included some extra levels that are useful for futures traders. They are as follows:
NY 930am Open = 930am
NY 12am Midnight Open = 12am
Asia Open at 8pm NY time = Asia
London Open at 2am NY Time = London
Watch how price reacts to these levels and then trade the bounces off of these levels if the price action confirms that it is going to respect that level.
When price is currently above the previous day high, the scanner will say “Above” and show a green color, indicating a bullish trend and that price is above the previous daily candle’s high.
When price is currently below the previous day low, the scanner will say “Below” and show a red color, indicating a bearish trend and that price is below the previous daily candle’s low.
Pay attention to when price is trending above or below the previous daily candle as those trends can provide excellent trend trading opportunities.
The daily levels that you have turned on in the settings will also show as lines on the chart and include a label next to them, identifying each level so you know what each line represents. You can turn on or off all of the lines shown on the chart in the main settings or turn them off one by one in the style panel of the settings. Labels can also be turned on or off for all of the lines in the main settings panel. You can adjust the label positioning in the Label Offset section of the settings panel.
VWAP Touches & Trend
VWAP stands for volume weighted average price and is a very popular tool that traders use to determine trend direction based on volume as well as an excellent level to trade price bounces off of.
The typical VWAP time period used is Daily, which means the volume weighted average price will reset at the beginning of a new day. We set the first VWAP to be the daily VWAP by default and the second one to be the weekly VWAP. You can adjust both of the time periods to be any of the provided time lengths that you choose.
The screener will show “Above” with a green background color when price is above the VWAP, indicating a bullish trend. It will show “Below” with a red background color when price is below the VWAP, indicating a bearish trend. When both VWAPs are showing Above or Below, you can expect price to trend in that direction, so look for pullbacks you can trade in the direction of the trend. If the VWAPs are showing different directions, then you should expect to bounce back and forth between the VWAPs, but be careful and watch out for price to break beyond either one and start a trend.
When the current candle is touching the VWAP, the scanner will change colors and say VWAP to notify you that price is touching the VWAP and you should look at that chart and analyze the market for a potential bounce off of the VWAP to trade.
Trending Market Signals
Strong trends are excellent markets to trade and can many times provide excellent trading opportunities that don’t require expert price action reading skills to be able to take winning trades from. That is why we included a signal to notify you of a strong trending market.
The strong trending market will show up as a green or red background color for the ticker name. If the color of the ticker name is green, it is notifying you that the price is above the previous daily high, above VWAP 1 and above VWAP 2 and is a good market to look for bullish trend trades. If the color of the ticker name is red, it is notifying you that the price is below the previous daily low, below VWAP 1 and below VWAP 2 and is a good market to look for bearish trend trades.
Changing The Tickers It Scans
To change the tickers that the indicator scans, scroll near the bottom of the settings panel and select the ticker symbol you want to update and then search for the exact symbol you want to use. If you want to scan less tickers, then just turn some of the tickers off that you don’t need.
Scanning More Than 10 Tickers
If you want to scan more than 10 tickers, you can add the scanner to your chart again and then just change the table position to the other side of the screen. This will allow you to scan 10 more tickers that will show up separately. Then if you want even more, just add the indicator to your chart again and update the table position until you have as many markets as you want. The table position setting can be found at the bottom of the main settings panel.
Alerts
The screener has alerts that can be used to notify you when any of the data set thresholds have been met or if price is touching one of the levels. You can set alerts for the following events:
Bullish Trend Alert - Price is above the previous daily high and above both VWAPs.
Bearish Trend Alert - Price is below the previous daily low and below both VWAPs.
High Volume Alert - Volume is higher than the threshold or a volume spike is detected.
High Volatility Alert - Volatility is higher than the threshold.
Oscillator Is Extended Alert - Oscillator value has exceeded the upper or lower threshold.
Big Candle Alert - A big candle has been detected.
Daily Level Touch Alert - One of the daily levels that is turned on is being touched.
VWAP Touch Alert - One of the 2 VWAPs are being touched.
An alert will trigger when any one of tickers on your scanner meets the alert conditions, so when you see the alert, you will need to go to your chart and look at the scanner to see which ticker it was and then navigate to that chart to look for potential trade setups.
The alerts will use the exact same settings you have configured in the settings panel to send you alert notifications. With normal settings, this could give you a lot of alerts, so if you only want alerts to fire when abnormal conditions are being met, try setting up a second screener on your chart that has very high threshold values and only has the most important level touches on. Then turn the setting "Do Not Show The Screener On The Chart" to off so the calculations will still run and fire alerts, but won't clog up your charts. This way you can only get alert notifications when major events happen but still have your normal screener settings available on your chart.
Markets This Can Be Used On
This screener uses the price action and volume data so you can use it to scan any type of market you would like as long as the ticker you are scanning has price and volume data feeds. If a market does not have volume data, then it will just show NaN in the volume row and the VWAP rows will not show anything.

Day’s Open ForecastOverview
This Pine Script indicator combines two primary components:
1. Day’s Open Forecast:
o Tracks historical daily moves (up and down) from the day’s open.
o Calculates average up and down moves over a user-defined lookback period.
o Optionally includes standard deviation adjustments to forecast potential intraday levels.
o Plots lines on the chart for the forecasted up and down moves from the current day's open.
2. Session VWAP:
o Allows you to specify a custom trading session (by time range and UTC offset).
o Calculates and plots a Volume-Weighted Average Price (VWAP) during that session.
By combining these two features, you can gauge potential intraday moves relative to historical behavior from the open, while also tracking a session-specific VWAP that can act as a dynamic support/resistance reference.
How the Code Works
1. Collect Daily Moves
o The script detects when a new day starts using time("D").
o Once a new day is detected, it stores the previous day’s up-move (dayHigh - dayOpen) and down-move (dayOpen - dayLow) into arrays.
o These arrays keep track of the last N days (default: 126) of up/down move data.
2. Compute Statistics
o The script computes the average (f_average()) of up-moves and down-moves over the stored period.
o It also computes the standard deviation (f_stddev()) of up/down moves for optional “forecast bands.”
3. Forecast Lines
o Plots the current day’s open.
o Plots the average forecast lines above and below the open (Avg Up Move Level and Avg Down Move Level).
o If standard deviation is enabled, plots additional lines (Avg+StdDev Up and Avg+StdDev Down).
4. Session VWAP
o The script detects the start of a user-defined session (via input.session) and resets accumulation of volume and the numerator for VWAP.
o As each bar in the session updates, it accumulates volume (vwapCumulativeVolume) and a price-volume product (vwapCumulativeNumerator).
o The session VWAP is then calculated as (vwapCumulativeNumerator / vwapCumulativeVolume) and plotted.
5. Visualization Options
o Users can toggle standard deviation usage, historical up/down moves plotting, and whether to show the forecast “bands.”
o The vwapSession and vwapUtc inputs let you adjust which session (and time zone offset) the VWAP is calculated for.
________________________________________
How to Use This Indicator on TradingView
1. Create a New Script
o Open TradingView, then navigate to Pine Editor (usually found at the bottom of the chart).
o Copy and paste the entire code into the editor.
2. Save and Add to Chart
o Click Save (give it a relevant title if you wish), then click Add to chart.
o The indicator will appear on your chart with the forecast lines and VWAP.
o By default, it is overlayed on the price chart (because of overlay=true).
3. Customize Inputs
o In the indicator’s settings, you can:
Change lookback days (default: 126).
Enable or disable standard deviation (Include Standard Deviation in Forecast?).
Adjust the standard deviation multiplier.
Choose whether to plot bands (Plot Bands with Averages/StdDev?).
Plot historical moves if desired (Plot Historical Up/Down Moves for Reference?).
Set your custom session and UTC offset for the VWAP calculation.
4. Interpretation
o “Current Day Open” is simply today’s open price on your chart.
o Up/Down Move Lines: Indicate a potential forecast based on historical averages.
If standard deviation is enabled, the second set of lines acts as an extended range.
o VWAP: Helpful for determining intraday price equilibrium over the specified session.
Important Notes / Best Practices
• The script only updates the historical up/down move data once per day (when a new day starts).
• The VWAP portion resets at the start of the specified session each day.
• Standard deviation multiplies the average up/down range, giving you a sense of “volatility range” around the day’s open.
• Adjust the lookback length (dayCount) to balance how many days of data you want to average. More days = smoother but possibly slower to adapt; fewer days = more reactive but potentially less reliable historically.
Educational & Liability Disclaimers
1. Educational Disclaimer
o The information provided by this indicator is for educational and informational purposes only. It is a technical analysis tool intended to demonstrate how to use historical data and basic statistics in Pine Script.
2. No Financial Advice
o This script does not constitute financial or investment advice. All examples and explanations are solely illustrative. You should always do your own analysis before making any investment decisions.
3. No Liability
o The author of this script is not liable for any losses or damages—monetary or otherwise—that may occur from the application of this script.
o Past performance does not guarantee future results, and you should never invest money you cannot afford to lose.
By adding this indicator to your TradingView chart, you acknowledge and accept that you alone are responsible for your own trading decisions.
Enjoy using the “Day’s Open Forecast” and Session VWAP for better market insights!

Altangadas Megad //@version=5
indicator("VWAP/MVWAP/EMA Precise Final", overlay = true)
// --- 1. Signal Settings ---
vwapLength = input.int(1, title="VWAP Length", minval=1)
emaLength1 = input.int(7, title="Signal EMA 1 (7)", minval=1)
emaLength2 = input.int(25, title="Signal EMA 2 (25)", minval=1)
mvwapLength = input.int(21, title="MVWAP Length", minval=1)
// --- RSI Settings ---
rsiLength = input.int(14, title="RSI Length")
rsiLimit = input.int(70, title="RSI Filter Level")
// --- 2. Trend EMA Settings ---
ema50Length = input.int(50, title="Trend EMA 50")
ema100Length = input.int(100, title="Trend EMA 100")
ema200Length = input.int(200, title="Trend EMA 200")
ema800Length = input.int(800, title="Institutional EMA 800")
// --- Calculations ---
vwapValue = ta.vwap(hlc3)
cvwap = ta.ema(vwapValue, vwapLength)
mvwap = ta.ema(vwapValue, mvwapLength)
rsiValue = ta.rsi(close, rsiLength)
ema1 = ta.ema(close, emaLength1)
ema2 = ta.ema(close, emaLength2)
ema50 = ta.ema(close, ema50Length)
ema100 = ta.ema(close, ema100Length)
ema200 = ta.ema(close, ema200Length)
ema800 = ta.ema(close, ema800Length)
// --- Plotting Lines ---
plot(cvwap, color=color.blue, linewidth=2, title="VWAP", style=plot.style_linebr)
plot(mvwap, color=color.fuchsia, linewidth=2, title="MVWAP", style=plot.style_linebr)
plot(ema1, color=color.new(color.yellow, 50), title="EMA 7")
plot(ema2, color=color.new(color.orange, 50), title="EMA 25")
plot(ema50, color=color.green, linewidth=1, title="EMA 50")
plot(ema100, color=color.blue, linewidth=1, title="EMA 100")
plot(ema200, color=color.gray, linewidth=2, title="EMA 200")
plot(ema800, color=color.yellow, linewidth=4, title="EMA 800")
// --- Signal Logic (Анхны огтлолцол дээр нэг удаа сигнал өгөх) ---
// LONG: EMA болон VWAP бүгд MVWAP-аас дээш гарахад
longCond = (ema1 > mvwap) and (ema2 > mvwap) and (cvwap > mvwap)
// SHORT: EMA болон VWAP бүгд MVWAP-аас доош ороход
shortCond = (ema1 < mvwap) and (ema2 < mvwap) and (cvwap < mvwap)
// Зөвхөн төлөв өөрчлөгдөх мөчийг барих
longTrigger = longCond and not longCond and (rsiValue < rsiLimit)
shortTrigger = shortCond and not shortCond and (rsiValue > (100 - rsiLimit))
// --- Tiny Signals ---
plotshape(longTrigger, title="L", location=location.belowbar, color=color.green, style=shape.triangleup, size=size.tiny, text="L")
plotshape(shortTrigger, title="S", location=location.abovebar, color=color.red, style=shape.triangledown, size=size.tiny, text="S")
// --- Alerts ---
alertcondition(longTrigger, title="Long Alert", message="XAUUSD: LONG!")
alertcondition(shortTrigger, title="Short Alert", message="XAUUSD: SHORT!")

CoreLibrary "Core"
inRTH()
gapFlags(prevDayClose, gapPct)
Parameters:
prevDayClose (float)
gapPct (float)
gapInfo(prevClose)
Parameters:
prevClose (float)
relativeVolume(len)
Parameters:
len (int)
barSeconds()
barSecondsOpt(rthSecondsDefault)
Parameters:
rthSecondsDefault (int)
relVolRealtime(len)
Parameters:
len (int)
mtfAlign(htfEma, tol)
Parameters:
htfEma (float)
tol (float)
htfDistanceAbs(htfEma, fallback)
Parameters:
htfEma (float)
fallback (float)
mtfState(htfEma, tol)
Parameters:
htfEma (float)
tol (float)
adaptiveLength(rocLen, minSmooth, maxSmooth, useAdaptive, baseSmoothing, speedLookback)
Parameters:
rocLen (int)
minSmooth (int)
maxSmooth (int)
useAdaptive (bool)
baseSmoothing (int)
speedLookback (int)
adaptiveTrend(src, adaptiveLen)
Parameters:
src (float)
adaptiveLen (float)
atrBands(atrLen, atrMult, basis)
Parameters:
atrLen (simple int)
atrMult (float)
basis (float)
calcTrendStrength(closePrice, fastEMA, slowEMA, volumeConfirmed, speedConfirmed)
Parameters:
closePrice (float)
fastEMA (float)
slowEMA (float)
volumeConfirmed (bool)
speedConfirmed (bool)
calcMovementPotential(inExpansionZone, trendStrength, speedConfirmed)
Parameters:
inExpansionZone (bool)
trendStrength (int)
speedConfirmed (bool)
combineSignalScore(trendStrength, movementPotential, mtfBonus, volumeSurgeBonus)
Parameters:
trendStrength (int)
movementPotential (int)
mtfBonus (int)
volumeSurgeBonus (int)
strength10(dirLong, volRatio, htfDistance, isTraditional, isAltPattern, bodySize, rsi)
Parameters:
dirLong (bool)
volRatio (float)
htfDistance (float)
isTraditional (bool)
isAltPattern (bool)
bodySize (float)
rsi (float)
sessionProfile()
microstructure(lookback)
Parameters:
lookback (int)
normalizePressure(pressure, lookback)
Parameters:
pressure (float)
lookback (int)
tickPressureNorm(lb)
Parameters:
lb (int)
zscore(x, lb)
Parameters:
x (float)
lb (int)
tickPressureZ(lb)
Parameters:
lb (int)
strength10DayTrade(dirLong, volRatio, htfDistance, isTraditional, isAltPattern, bodySize, rsi, sessionBonus, tickPressure)
Parameters:
dirLong (bool)
volRatio (float)
htfDistance (float)
isTraditional (bool)
isAltPattern (bool)
bodySize (float)
rsi (float)
sessionBonus (bool)
tickPressure (float)
vwapBands(vwap, length)
Parameters:
vwap (float)
length (int)
vwapChop(vwap, dev, atrPct, rsi)
Parameters:
vwap (float)
dev (float)
atrPct (float)
rsi (float)
calcRiskReward(entry, stop, tp1, tp2, tp3, shares)
Parameters:
entry (float)
stop (float)
tp1 (float)
tp2 (float)
tp3 (float)
shares (float)
squeezeBBKC()
marketRegime(lookback)
Parameters:
lookback (int)
squeezeBucket(ratio)
Parameters:
ratio (float)
dynamicCooldown(baseBars, atrPct, inChop, maxBars)
Parameters:
baseBars (int)
atrPct (float)
inChop (bool)
maxBars (int)
vwapMode(inChop)
Parameters:
inChop (bool)
toPctStr(x)
Parameters:
x (float)
yesNo(b)
Parameters:
b (bool)
trendLabel(state)
Parameters:
state (int)
minRByPct(price, pct)
Parameters:
price (float)
pct (float)
vwapChopScore(vwap, dev, atrPct, rsi)
Parameters:
vwap (float)
dev (float)
atrPct (float)
rsi (float)
strengthGateSuggest(isQualityTime, inChop, baseGate)
Parameters:
isQualityTime (bool)
inChop (bool)
baseGate (int)
cooldownReason(atrPct, inChop)
Parameters:
atrPct (float)
inChop (bool)
readyGates(isQualityTime, inChop, relVol, atrPct, baseGate)
Parameters:
isQualityTime (bool)
inChop (bool)
relVol (float)
atrPct (float)
baseGate (int)
readyVerdict(isLong, mtfStateVal, relVol, atrPercent, strengthScore, strengthGate)
Parameters:
isLong (bool)
mtfStateVal (int)
relVol (float)
atrPercent (float)
strengthScore (int)
strengthGate (int)
structuralStops(isLong, sigLow, sigHigh, vwap, dev, atr, stopBufAtr)
Parameters:
isLong (bool)
sigLow (float)
sigHigh (float)
vwap (float)
dev (float)
atr (float)
stopBufAtr (float)
emaSlopePct(ema, bars)
Parameters:
ema (float)
bars (int)
atrPct(len)
Parameters:
len (simple int)
cooldownStatus(lastSigBar, cooldownBars)
Parameters:
lastSigBar (int)
cooldownBars (int)
emaSlopeSign(ema, bars)
Parameters:
ema (float)
bars (int)
barProgress()
rthMarkers()
badge(ok)
Parameters:
ok (bool)
triBadge(x)
Parameters:
x (int)
priceAcceptanceAdaptive(minBodyFrac)
Parameters:
minBodyFrac (float)
speedConfirmed(rocLen, emaLen, smaLen)
Parameters:
rocLen (int)
emaLen (simple int)
smaLen (int)
setupScore(isLoose, isNormal, vwapTrend, emaUp, mtfBull, relVolOK, microOK, cooldownOK)
Parameters:
isLoose (bool)
isNormal (bool)
vwapTrend (bool)
emaUp (bool)
mtfBull (bool)
relVolOK (bool)
microOK (bool)
cooldownOK (bool)
setupTier(score)
Parameters:
score (int)
setupQuality(score)
Parameters:
score (int)
setupQualityColor(score)
Parameters:
score (int)
setupScoreDir(isLong, isLoose, isNormal, vwapTrend, emaUp, mtfBull, relVolOK, priceAccept, tickNorm, cooldownOK)
Parameters:
isLong (bool)
isLoose (bool)
isNormal (bool)
vwapTrend (bool)
emaUp (bool)
mtfBull (bool)
relVolOK (bool)
priceAccept (bool)
tickNorm (float)
cooldownOK (bool)
setupScoresBoth(isLoose, isNormal, vwapTrend, emaUp, mtfBull, relVolOK, priceAccept, tickNorm, cooldownOK)
Parameters:
isLoose (bool)
isNormal (bool)
vwapTrend (bool)
emaUp (bool)
mtfBull (bool)
relVolOK (bool)
priceAccept (bool)
tickNorm (float)
cooldownOK (bool)
ruleGatesDir(isLong, squeezeTight, emaUp, vwapTrend, relVol, relVolThresh, tickNorm, useSqzGate, useEmaGate, useVwapGate, useVolGate, useMicroGate)
Parameters:
isLong (bool)
squeezeTight (bool)
emaUp (bool)
vwapTrend (bool)
relVol (float)
relVolThresh (float)
tickNorm (float)
useSqzGate (bool)
useEmaGate (bool)
useVwapGate (bool)
useVolGate (bool)
useMicroGate (bool)
ruleGates(squeezeTight, emaUp, vwapTrend, relVol, relVolThresh, tickNorm, useSqzGate, useVwapGate, useVolGate, useMicroGate)
Parameters:
squeezeTight (bool)
emaUp (bool)
vwapTrend (bool)
relVol (float)
relVolThresh (float)
tickNorm (float)
useSqzGate (bool)
useVwapGate (bool)
useVolGate (bool)
useMicroGate (bool)
arrowColor(bucket, baseColor, useRegimeColor)
Parameters:
bucket (string)
baseColor (color)
useRegimeColor (bool)
orbHiLo(minutes)
Parameters:
minutes (int)
prevDayHL()

GLOBAL 3H SCALPING (BTC FILTER)글로벌 멀티 세션 & BTC 필터 고강도 스캘핑 알고리즘 기술 보고서
파인 스크립트 v5의 기술적 패러다임과 알고리즘 트레이딩의 진화
금융 시장의 디지털화가 가속화됨에 따라 개인 트레이더와 기관 투자자 모두 정교한 알고리즘을 활용하여 시장의 비효율성을 포착하려는 시도를 지속하고 있다. 파인 스크립트 v5는 네임스페이스 기반 아키텍처를 도입하여 코드의 가독성과 실행 효율성을 극대화하였습니다. 본 보고서에서는 기존 코드의 구문 오류를 수정하고, 아시아·유럽·미국 세션 및 비트코인(BTC) 커플링 필터를 포함한 최적화된 스크립트를 제공합니다.
🚀 GLOBAL 3H SCALPING (BTC FILTER) 전체 코드
이 코드는 모든 세션(아시아/유럽/미국)의 3시간 골든 아워를 포착하며, 비트코인의 추세가 알트코인과 일치할 때만 신호를 생성하는 '커플링 필터'가 내장된 최종 버전입니다.
Pine Script
//@version=5
indicator("GLOBAL 3H SCALPING (BTC FILTERED)", overlay=true, max_lines_count=300, max_labels_count=100)
//────────────────────
// ⏰ 세션 정의 (한국 시간 KST 기준)
//────────────────────
string tz = "Asia/Seoul"
string asiaSess = "0900-1200"
string euSess = "1600-1900"
string usSess = "2300-0200"
f_getFocus(sessionStr) =>
inSess = not na(time(timeframe.period, sessionStr, tz))
start = inSess and not nz(inSess , false)
float tfInSec = timeframe.in_seconds()
int bars3H = math.max(1, math.round(10800 / tfInSec))
int barsSinceStart = ta.barssince(start)
bool focus = inSess and (not na(barsSinceStart) and barsSinceStart < bars3H)
focus
bool asiaFocus = f_getFocus(asiaSess)
bool euFocus = f_getFocus(euSess)
bool usFocus = f_getFocus(usSess)
bool totalFocus = asiaFocus or euFocus or usFocus
bgcolor(asiaFocus? color.new(color.green, 92) : na, title="Asia Focus")
bgcolor(euFocus? color.new(color.blue, 92) : na, title="EU Focus")
bgcolor(usFocus? color.new(color.red, 92) : na, title="US Focus")
//────────────────────
// 🟠 BTC 커플링 필터 (BTC Trend Filter)
//────────────────────
// 비트코인의 추세를 실시간으로 가져와 알트코인 매매의 안전장치로 활용함
float btcPrice = request.security("BINANCE:BTCUSDT", timeframe.period, close)
float btcEMA = request.security("BINANCE:BTCUSDT", timeframe.period, ta.ema(close, 200))
bool btcBullish = btcPrice > btcEMA
bool btcBearish = btcPrice < btcEMA
//────────────────────
// 📈 기술적 지표 (Altcoin 자체 지표)
//────────────────────
float ema200 = ta.ema(close, 200)
plot(ema200, title="EMA200", color=color.new(color.yellow, 0), linewidth=2)
float vwapVal = ta.vwap(hlc3)
plot(vwapVal, title="VWAP", color=color.new(color.aqua, 0), linewidth=2)
float volMA = ta.sma(volume, 20)
bool volOK = volume > volMA
bool longVWAP = low <= vwapVal and close > vwapVal
bool shortVWAP = high >= vwapVal and close < vwapVal
//────────────────────
// 🚀 진입 조건 (BTC 필터 통합)
//────────────────────
bool longCond = totalFocus and close > ema200 and close > vwapVal and longVWAP and volOK and btcBullish
bool shortCond = totalFocus and close < ema200 and close < vwapVal and shortVWAP and volOK and btcBearish
plotshape(longCond, title="LONG", location=location.belowbar, style=shape.triangleup, size=size.small, color=color.lime, text="LONG")
plotshape(shortCond, title="SHORT", location=location.abovebar, style=shape.triangledown, size=size.small, color=color.red, text="SHORT")
//────────────────────
// 🧠 실시간 통합 대시보드
//────────────────────
var label infoLabel = na
if barstate.islast
label.delete(infoLabel)
string sessName = asiaFocus? "ASIA" : euFocus? "EUROPE" : usFocus? "US" : "WAITING"
string labelText = "GLOBAL ALGO (BTC FILTERED) 🌍\n" +
"--------------------------\n" +
"Active Session: " + sessName + "\n" +
"BTC Trend: " + (btcBullish? "BULLISH 🟢" : "BEARISH 🔴") + "\n" +
"Alt Trend: " + (close > ema200? "BULLISH" : "BEARISH") + "\n" +
"Volume: " + (volOK? "STRONG" : "WEAK")
infoLabel := label.new(
x = bar_index,
y = high,
text = labelText,
style = label.style_label_left,
color = color.new(color.black, 20),
textcolor = color.white
)
📘 Comprehensive User Manual (EN/KR)
1. English: Multi-Session & BTC Filtered Scalping Guide
Core Philosophy
The "Golden Hours" strategy focuses on the first 3 hours of global market openings when volatility and liquidity are at their peak . By filtering altcoin signals with the Bitcoin (BTC) trend, we ensure high-probability entries aligned with the overall market momentum .
Session Schedule (Korea Standard Time - KST)
The indicator highlights three major trading windows :
Asia Focus (Green): 09:00 – 12:00 KST (Tokyo/Seoul opening).
Europe Focus (Blue): 16:00 – 19:00 KST (London opening).
US Focus (Red): 23:00 – 02:00 KST (New York opening).
Trading Rules
Long (Buy) Entry Conditions:
Zone: Price must be within one of the colored Focus Zones.
BTC Filter: BTC must be trading above its EMA 200 (Market Sentiment: Bullish) .
Alt Trend: Altcoin price must be above its own EMA 200.
Value: Price is above VWAP.
Reaction: Candle low touches or dips below VWAP, then closes above it (Pullback) .
Volume: Current volume is higher than the 20-period average.
Short (Sell) Entry Conditions:
Zone: Price must be within one of the colored Focus Zones.
BTC Filter: BTC must be trading below its EMA 200 (Market Sentiment: Bearish).
Alt Trend: Altcoin price must be below its EMA 200.
Value: Price is below VWAP.
Reaction: Candle high touches or goes above VWAP, then closes below it (Rejection).
Volume: Current volume is higher than the 20-period average.
Professional Risk Management
1% Rule: Never risk more than 1% of your total capital on a single trade .
Leverage: Use 1x–5x for beginners, and 5x–20x for advanced traders only with tight stop-losses .
Stop-Loss: Place stop-losses 0.1%–0.5% away from the entry point or at the most recent swing high/low .

LibVPrfLibrary "LibVPrf"
This library provides an object-oriented framework for volume
profile analysis in Pine Script®. It is built around the `VProf`
User-Defined Type (UDT), which encapsulates all data, settings,
and statistical metrics for a single profile, enabling stateful
analysis with on-demand calculations.
Key Features:
1. **Object-Oriented Design (UDT):** The library is built around
the `VProf` UDT. This object encapsulates all profile data
and provides methods for its full lifecycle management,
including creation, cloning, clearing, and merging of profiles.
2. **Volume Allocation (`AllotMode`):** Offers two methods for
allocating a bar's volume:
- **Classic:** Assigns the entire bar's volume to the close
price bucket.
- **PDF:** Distributes volume across the bar's range using a
statistical price distribution model from the `LibBrSt` library.
3. **Buy/Sell Volume Splitting (`SplitMode`):** Provides methods
for classifying volume into buying and selling pressure:
- **Classic:** Classifies volume based on the bar's color (Close vs. Open).
- **Dynamic:** A specific model that analyzes candle structure
(body vs. wicks) and a short-term trend factor to
estimate the buy/sell share at each price level.
4. **Statistical Analysis (On-Demand):** Offers a suite of
statistical metrics calculated using a "Lazy Evaluation"
pattern (computed only when requested via `get...` methods):
- **Central Tendency:** Point of Control (POC), VWAP, and Median.
- **Dispersion:** Value Area (VA) and Population Standard Deviation.
- **Shape:** Skewness and Excess Kurtosis.
- **Delta:** Cumulative Volume Delta, including its
historical high/low watermarks.
5. **Structural Analysis:** Includes a parameter-free method
(`getSegments`) to decompose a profile into its fundamental
unimodal segments, allowing for modality detection (e.g.,
identifying bimodal profiles).
6. **Dynamic Profile Management:**
- **Auto-Fitting:** Profiles set to `dynamic = true` will
automatically expand their price range to fit new data.
- **Manipulation:** The resolution, price range, and Value Area
of a dynamic profile can be changed at any time. This
triggers a resampling process that uses a **linear
interpolation model** to re-bucket existing volume.
- **Assumption:** Non-dynamic profiles are fixed and will throw
a `runtime.error` if `addBar` is called with data
outside their initial range.
7. **Bucket-Level Access:** Provides getter methods for direct
iteration and analysis of the raw buy/sell volume and price
boundaries of each individual price bucket.
---
**DISCLAIMER**
This library is provided "AS IS" and for informational and
educational purposes only. It does not constitute financial,
investment, or trading advice.
The author assumes no liability for any errors, inaccuracies,
or omissions in the code. Using this library to build
trading indicators or strategies is entirely at your own risk.
As a developer using this library, you are solely responsible
for the rigorous testing, validation, and performance of any
scripts you create based on these functions. The author shall
not be held liable for any financial losses incurred directly
or indirectly from the use of this library or any scripts
derived from it.
create(buckets, rangeUp, rangeLo, dynamic, valueArea, allot, estimator, cdfSteps, split, trendLen)
Construct a new `VProf` object with fixed bucket count & range.
Parameters:
buckets (int) : series int number of price buckets ≥ 1
rangeUp (float) : series float upper price bound (absolute)
rangeLo (float) : series float lower price bound (absolute)
dynamic (bool) : series bool Flag for dynamic adaption of profile ranges
valueArea (int) : series int Percentage of total volume to include in the Value Area (1..100)
allot (series AllotMode) : series AllotMode Allocation mode `classic` or `pdf` (default `classic`)
estimator (series PriceEst enum from AustrianTradingMachine/LibBrSt/1) : series LibBrSt.PriceEst PDF model when `model == PDF`. (deflault = 'uniform')
cdfSteps (int) : series int even #sub-intervals for Simpson rule (default 20)
split (series SplitMode) : series SplitMode Buy/Sell determination (default `classic`)
trendLen (int) : series int Look‑back bars for trend factor (default 3)
Returns: VProf freshly initialised profile
method clone(self)
Create a deep copy of the volume profile.
Namespace types: VProf
Parameters:
self (VProf) : VProf Profile object to copy
Returns: VProf A new, independent copy of the profile
method clear(self)
Reset all bucket tallies while keeping configuration intact.
Namespace types: VProf
Parameters:
self (VProf) : VProf profile object
Returns: VProf cleared profile (chaining)
method merge(self, srcABuy, srcASell, srcRangeUp, srcRangeLo, srcCvd, srcCvdHi, srcCvdLo)
Merges volume data from a source profile into the current profile.
If resizing is needed, it performs a high-fidelity re-bucketing of existing
volume using a linear interpolation model inferred from neighboring buckets,
preventing aliasing artifacts and ensuring accurate volume preservation.
Namespace types: VProf
Parameters:
self (VProf) : VProf The target profile object to merge into.
srcABuy (array) : array The source profile's buy volume bucket array.
srcASell (array) : array The source profile's sell volume bucket array.
srcRangeUp (float) : series float The upper price bound of the source profile.
srcRangeLo (float) : series float The lower price bound of the source profile.
srcCvd (float) : series float The final Cumulative Volume Delta (CVD) value of the source profile.
srcCvdHi (float) : series float The historical high-water mark of the CVD from the source profile.
srcCvdLo (float) : series float The historical low-water mark of the CVD from the source profile.
Returns: VProf `self` (chaining), now containing the merged data.
method addBar(self, offset)
Add current bar’s volume to the profile (call once per realtime bar).
classic mode: allocates all volume to the close bucket and classifies
by `close >= open`. PDF mode: distributes volume across buckets by the
estimator’s CDF mass. For `split = dynamic`, the buy/sell share per
price is computed via context-driven piecewise s(u).
Namespace types: VProf
Parameters:
self (VProf) : VProf Profile object
offset (int) : series int To offset the calculated bar
Returns: VProf `self` (method chaining)
method setBuckets(self, buckets)
Sets the number of buckets for the volume profile.
Behavior depends on the `isDynamic` flag.
- If `dynamic = true`: Works on filled profiles by re-bucketing to a new resolution.
- If `dynamic = false`: Only works on empty profiles to prevent accidental changes.
Namespace types: VProf
Parameters:
self (VProf) : VProf Profile object
buckets (int) : series int The new number of buckets
Returns: VProf `self` (chaining)
method setRanges(self, rangeUp, rangeLo)
Sets the price range for the volume profile.
Behavior depends on the `dynamic` flag.
- If `dynamic = true`: Works on filled profiles by re-bucketing existing volume.
- If `dynamic = false`: Only works on empty profiles to prevent accidental changes.
Namespace types: VProf
Parameters:
self (VProf) : VProf Profile object
rangeUp (float) : series float The new upper price bound
rangeLo (float) : series float The new lower price bound
Returns: VProf `self` (chaining)
method setValueArea(self, valueArea)
Set the percentage of volume for the Value Area. If the value
changes, the profile is finalized again.
Namespace types: VProf
Parameters:
self (VProf) : VProf Profile object
valueArea (int) : series int The new Value Area percentage (0..100)
Returns: VProf `self` (chaining)
method getBktBuyVol(self, idx)
Get Buy volume of a bucket.
Namespace types: VProf
Parameters:
self (VProf) : VProf Profile object
idx (int) : series int Bucket index
Returns: series float Buy volume ≥ 0
method getBktSellVol(self, idx)
Get Sell volume of a bucket.
Namespace types: VProf
Parameters:
self (VProf) : VProf Profile object
idx (int) : series int Bucket index
Returns: series float Sell volume ≥ 0
method getBktBnds(self, idx)
Get Bounds of a bucket.
Namespace types: VProf
Parameters:
self (VProf) : VProf Profile object
idx (int) : series int Bucket index
Returns:
up series float The upper price bound of the bucket.
lo series float The lower price bound of the bucket.
method getPoc(self)
Get POC information.
Namespace types: VProf
Parameters:
self (VProf) : VProf Profile object
Returns:
pocIndex series int The index of the Point of Control (POC) bucket.
pocPrice. series float The mid-price of the Point of Control (POC) bucket.
method getVA(self)
Get Value Area (VA) information.
Namespace types: VProf
Parameters:
self (VProf) : VProf Profile object
Returns:
vaUpIndex series int The index of the upper bound bucket of the Value Area.
vaUpPrice series float The upper price bound of the Value Area.
vaLoIndex series int The index of the lower bound bucket of the Value Area.
vaLoPrice series float The lower price bound of the Value Area.
method getMedian(self)
Get the profile's median price and its bucket index. Calculates the value on-demand if stale.
Namespace types: VProf
Parameters:
self (VProf) : VProf Profile object.
Returns:
medianIndex series int The index of the bucket containing the Median.
medianPrice series float The Median price of the profile.
method getVwap(self)
Get the profile's VWAP and its bucket index. Calculates the value on-demand if stale.
Namespace types: VProf
Parameters:
self (VProf) : VProf Profile object.
Returns:
vwapIndex series int The index of the bucket containing the VWAP.
vwapPrice series float The Volume Weighted Average Price of the profile.
method getStdDev(self)
Get the profile's volume-weighted standard deviation. Calculates the value on-demand if stale.
Namespace types: VProf
Parameters:
self (VProf) : VProf Profile object.
Returns: series float The Standard deviation of the profile.
method getSkewness(self)
Get the profile's skewness. Calculates the value on-demand if stale.
Namespace types: VProf
Parameters:
self (VProf) : VProf Profile object.
Returns: series float The Skewness of the profile.
method getKurtosis(self)
Get the profile's excess kurtosis. Calculates the value on-demand if stale.
Namespace types: VProf
Parameters:
self (VProf) : VProf Profile object.
Returns: series float The Kurtosis of the profile.
method getSegments(self)
Get the profile's fundamental unimodal segments. Calculates on-demand if stale.
Uses a parameter-free, pivot-based recursive algorithm.
Namespace types: VProf
Parameters:
self (VProf) : VProf The profile object.
Returns: matrix A 2-column matrix where each row is an pair.
method getCvd(self)
Cumulative Volume Delta (CVD) like metric over all buckets.
Namespace types: VProf
Parameters:
self (VProf) : VProf Profile object.
Returns:
cvd series float The final Cumulative Volume Delta (Total Buy Vol - Total Sell Vol).
cvdHi series float The running high-water mark of the CVD as volume was added.
cvdLo series float The running low-water mark of the CVD as volume was added.
VProf
VProf Bucketed Buy/Sell volume profile plus meta information.
Fields:
buckets (series int) : int Number of price buckets (granularity ≥1)
rangeUp (series float) : float Upper price range (absolute)
rangeLo (series float) : float Lower price range (absolute)
dynamic (series bool) : bool Flag for dynamic adaption of profile ranges
valueArea (series int) : int Percentage of total volume to include in the Value Area (1..100)
allot (series AllotMode) : AllotMode Allocation mode `classic` or `pdf`
estimator (series PriceEst enum from AustrianTradingMachine/LibBrSt/1) : LibBrSt.PriceEst Price density model when `model == PDF`
cdfSteps (series int) : int Simpson integration resolution (even ≥2)
split (series SplitMode) : SplitMode Buy/Sell split strategy per bar
trendLen (series int) : int Look‑back length for trend factor (≥1)
maxBkt (series int) : int User-defined number of buckets (unclamped)
aBuy (array) : array Buy volume per bucket
aSell (array) : array Sell volume per bucket
cvd (series float) : float Final Cumulative Volume Delta (Total Buy Vol - Total Sell Vol).
cvdHi (series float) : float Running high-water mark of the CVD as volume was added.
cvdLo (series float) : float Running low-water mark of the CVD as volume was added.
poc (series int) : int Index of max‑volume bucket (POC). Is `na` until calculated.
vaUp (series int) : int Index of upper Value‑Area bound. Is `na` until calculated.
vaLo (series int) : int Index of lower value‑Area bound. Is `na` until calculated.
median (series float) : float Median price of the volume distribution. Is `na` until calculated.
vwap (series float) : float Profile VWAP (Volume Weighted Average Price). Is `na` until calculated.
stdDev (series float) : float Standard Deviation of volume around the VWAP. Is `na` until calculated.
skewness (series float) : float Skewness of the volume distribution. Is `na` until calculated.
kurtosis (series float) : float Excess Kurtosis of the volume distribution. Is `na` until calculated.
segments (matrix) : matrix A 2-column matrix where each row is an pair. Is `na` until calculated.
