multiday auto vwapwork in progress script to automatically generate multi vwaps - starting with current day and generating the prior 2 days to that.
Cerca negli script per "vwap"

Mag 7 VWAP TableThe **Mag 7 VWAP Table** is a real-time monitoring dashboard for the "Magnificent Seven" stocks. It provides a clean, professional table on your chart showing whether each stock is trading above or below its daily VWAP, its current price, and its intraday performance compared to yesterday's close.
---
## **Indicator Overview**
This script acts as a **market health dashboard**. By tracking the seven most influential stocks in the NASDAQ (AAPL, MSFT, GOOGL, AMZN, NVDA, META, TSLA), it gives traders an immediate sense of market sentiment. If the majority of these stocks are "ABOVE VWAP" and green, the broader market is likely in a strong bullish state.
### **Core Utility & Value**
* **Institutional Alignment:** VWAP (Volume Weighted Average Price) is the primary benchmark used by institutional traders. Knowing if the Mag 7 are above or below this level tells you if big money is buying or selling the "generals" of the market.
* **Screen Real Estate Efficiency:** Instead of opening seven different charts, you can monitor the most important tickers in the corner of your main trading screen.
* **Performance Tracking:** Real-time percentage change allows you to spot which of the tech giants is leading or lagging during the session.
---
## **Key Technical Features**
| Feature | Description |
| --- | --- |
| **Multi-Symbol Data** | Uses `request.security` to pull live data for all seven tickers simultaneously. |
| **Precision VWAP** | Calculates VWAP from a **1-minute base** (configurable). This ensures the "Daily VWAP" is hyper-accurate and resets exactly at the session open. |
| **Visual Alerts** | Uses a color-coded system (Teal/Red) for instant visual recognition of VWAP status. |
| **Zero-Lag Table** | Built using the `table` object, which remains fixed on your screen regardless of where you scroll on the chart. |
| **Version 6 Optimized** | Written in the latest **Pine Script v6**, ensuring maximum performance and compatibility with new TradingView features. |
---
## **How to Read the Table**
1. **Stock:** The ticker symbol (NASDAQ prefix removed for cleanliness).
2. **Price:** The current live market price of the asset.
3. **VWAP Status:** * **ABOVE VWAP (Teal):** Bullish. The stock is trading higher than the average price paid by all traders today, weighted by volume.
* **BELOW VWAP (Red):** Bearish. The stock is underperforming its daily average.
4. **% Change:** The net gain or loss since yesterday's 4:00 PM EST close. Includes dynamic arrows (**▲/▼**) for quick reading.
---
## **Pro Tip for Usage**
Since these stocks represent over **40% of the NASDAQ-100's weight**, use this table as a **confluence filter**. For example, if you are looking to take a "Long" trade on the QQQ or NQ futures, you would ideally want to see at least 5 out of the 7 stocks in this table showing **"ABOVE VWAP"**.

Timeframe-Independent Anchored VWAPAn anchored VWAP (Volume Weighted Average Price) that produces identical values (down to the tick!) across different timeframes (unlike, for example, TradingView's built-in Anchored VWAP).
Advantages
This indicator calculates identical values whether you view it on 1m, 5m, 15m, or any other timeframe within reasonable ranges. Even challenging non-integer timeframe ratios like calculating on 2m while viewing on 3m are handled perfectly. In High or Low mode, VWAP will anchor precisely at the selected candle's high/low. As usual for AVWAP, up to 3 standard deviation bands are supported.
How to Use
Setting the Anchor: When the indicator is added, select your anchor time. This is typically placed at a significant swing high/low or session open.
Source Selection: Choose whether to anchor from High, Low, or Close price.
Calculation Timeframe: Select the timeframe used for VWAP calculation.
For intraday trading (1m-1H charts): Just keep the default setting (1m)
For swing trading (4H-D charts): Use 5m or 15m calculation timeframe
For position trading (D-W charts): Use 1H calculation timeframe
Important: Lower calculation timeframes provide more precise data but may hit Pine Script's bar limit on very long timeframes
Standard Deviation Bands: Enable additional band sets as needed for your trading style.
Technical Implementation
The indicator achieves timeframe independence through the following algorithm:
Lower Timeframe Sampling: Uses Pine Script's request.security_lower_tf() to retrieve bar data at the specified calculation timeframe, regardless of the viewing timeframe. This provides consistent data resolution across all chart timeframes.
Anchor Detection: Scans the lower timeframe data to identify the exact bar containing the selected anchor price. The algorithm handles both simple cases (where anchor falls on a complete bar) and complex cases (where anchor falls within a split bar in non-integer timeframe ratios like calculating on 2m while viewing on 3m).
FIFO Buffer Management: Maintains a First-In-First-Out buffer of lower timeframe bars. On each chart bar:
Adds new lower timeframe bars to the buffer
Processes exactly one period worth of bars (matching the viewing timeframe)
Removes processed bars from the buffer
This approach ensures consistent calculation regardless of viewing timeframe.
First Bar Initialization: On the anchor bar, processes only the single anchor bar to ensure the VWAP starts exactly at the anchor price. Subsequent bars process the full period, maintaining mathematical accuracy.
VWAP Calculation: Applies the standard volume-weighted average price formula:
VWAP = Σ(Price × Volume) / Σ(Volume)
StdDev = √(Σ(Price² × Volume) / Σ(Volume) - VWAP²)
All calculations accumulate from the anchor point forward.
Visual Continuity: For edge cases where the anchor falls in an incomplete bar (e.g., calculating on 2m while viewing on 3m), displays the anchor price as a visual placeholder until the actual calculation begins on the next bar. This ensures the line always starts visually at the anchor point.

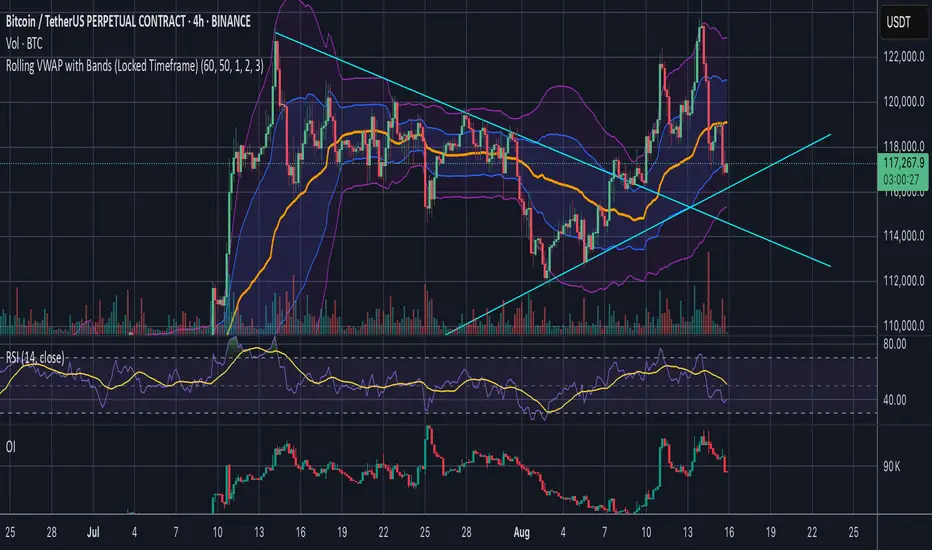
Rolling VWAP with Bands (Locked Timeframe)Rolling VWAP with Customizable Bands — Locked Timeframe
This indicator plots a rolling Volume Weighted Average Price (VWAP) over a fixed, user-selected timeframe — so it stays consistent no matter what chart timeframe you’re viewing. Unlike the standard anchored VWAP, this one works like a moving average weighted by volume, providing a smoother, more adaptive central price line that doesn’t reset each session.
It also includes up to three optional deviation bands, each with its own toggle and multiplier setting. The bands are based on standard deviation, helping you quickly identify when price is stretched above or below its mean.
Features:
Locked-timeframe VWAP — calculation stays fixed to your chosen resolution (e.g., 1H, 4H, Daily)
Adjustable lookback length for VWAP calculation
Up to 3 standard deviation bands, each with:
On/Off toggle
Independent multiplier control
Works on any chart timeframe without changing shape
Optional filled shading between bands for clarity
Uses:
Spot overbought/oversold conditions relative to VWAP
Identify dynamic support & resistance
Confirm trend strength or mean reversion setups
Keep a consistent reference line across multiple chart timeframes
HTB NY Session VWAP with Prev CloseVisual Distinction: The current VWAP is a bold pink line that moves with price, while the previous VWAP appears as a static, thin gray line, providing a clear "anchor" from yesterday's value.
Many institutional traders look for "Value Area" relationships. If today's price opens above the Previous Session VWAP, the market is considered "internally bullish." If it fails to hold that level and crosses below it, it often signals a "mean reversion" or a trend reversal.
Would you like me to add an alert that triggers specifically when the current price touches the Previous Session VWAP line?

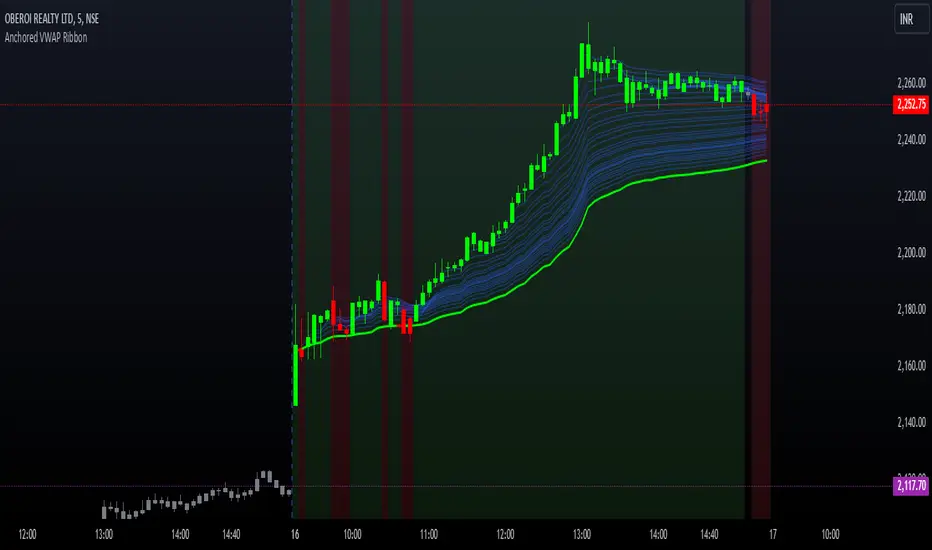
Options Series - Anchored VWAP Ribbon➤ AVWAP On different chart symbols:
⭐ Overview and Key Features:
Anchored VWAP Calculation:
The script implements the Anchored Volume Weighted Average Price (AVWAP), a tool used by professional traders to identify key price levels weighted by volume, starting from a specific timestamp (anchor point).
Bullish and Bearish Analysis:
It determines the dominance of bullish or bearish momentum based on the relationship between the close price and AVWAP levels across multiple time points.
Dynamic Visualization:
The background of the chart changes color based on overall bullish or bearish sentiment, making it easier to interpret market trends.
Multi-Time Anchors:
By defining multiple anchor points (e.g., 09:15, 09:20), the script calculates a series of AVWAP values for fine-grained intraday analysis.
Customizable Inputs:
Users can select the source price (e.g., hlc3), date, and time for AVWAP calculation.
⭐ How It Works and Functionality:
AVWAP Logic:
Uses the timestamp() function to establish a reference (anchor point).
Calculates the cumulative weighted price (price * volume) and cumulative volume from this anchor point.
The ratio of these sums gives the AVWAP, which updates dynamically with new bars.
Bullish and Bearish Signals:
Binary flags (1 or 0) are set for each time point depending on whether the closing price is above or below the AVWAP for that time.
Aggregates these flags into AVWAP_bull and AVWAP_bear to represent the overall market sentiment.
Decision Logic:
Determines final market conditions (bullish or bearish dominance) based on aggregated scores.
Visual feedback (background and bar colors) is applied accordingly.
⭐ Visualizations and User Experience:
Background Colors:
Green or red background highlights the overall sentiment (bullish or bearish), providing a quick market overview.
Bar Coloring:
Bars are color-coded based on bullish, bearish, or neutral conditions, making it easier to identify trends directly on the chart.
AVWAP Levels:
The calculated AVWAP values are plotted as colored lines for each anchor point, giving precise intraday levels of significance.
Bright colors (fluorescent green/red) are used for additional clarity when the close price is above or below these levels.
🎨 Settings and Customization:
Anchor Point:
Fully customizable anchor points allow users to set specific dates and times (e.g., 09:15 on December 13, 2024) for AVWAP calculations.
Source Price:
Users can choose from hlc3, close, or any other price source to calculate the AVWAP, tailoring the indicator to their strategy.
Visual Appearance:
The transparency, colors, and line styles are adjustable, enabling users to customize the chart to match their trading preferences.
Dynamic Signals:
The script accommodates numerous AVWAP levels, providing flexibility for scalpers and swing traders alike.
⭐ Uniqueness of the Concept:
Precise Intraday Analysis:
Unlike static VWAP, this script allows anchoring to specific times during the day, offering granular insights into market behavior.
Cumulative Sentiment Approach:
Aggregates signals across multiple time intervals, providing a comprehensive view of intraday momentum rather than a single-point reference.
Blending AVWAP with Visual Feedback:
Combines traditional AVWAP calculations with visually impactful features like background shading and bar coloring to enhance decision-making.
Scalability:
Supports adding multiple additional anchor points and customization for broader applicability in different market conditions.
🚀 Conclusion:
The Anchored VWAP Ribbon script is a powerful tool for traders seeking to analyze price behavior relative to volume-weighted levels anchored at specific times. It provides a visually intuitive way to assess intraday market sentiment, combining traditional technical indicators with customizable visualization features. The script’s flexibility makes it suitable for a variety of trading styles, from scalping to swing trading, while its unique cumulative sentiment logic sets it apart from conventional VWAP tools.
NQ Futures VWAP on QQQOverlay NQ1 vwap for QQQ
Track NQ future's vwap on your QQQ chart to scale with optional bands

Cumulative VWAPThis indicator plots the cumulative VWAP from the first bar loaded on the chart. Unlike the traditional daily VWAP that resets at the start of each trading session, this version continuously aggregates price and volume over the full visible chart history.
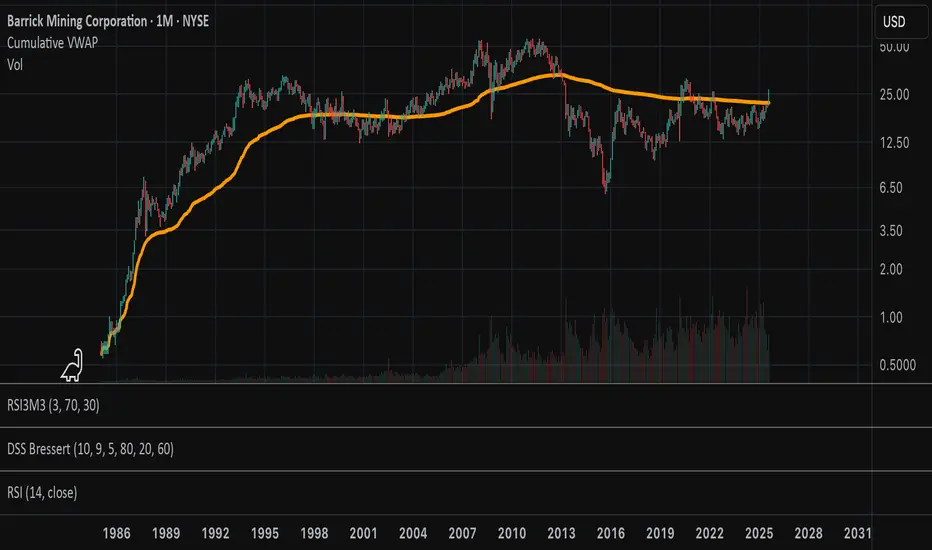
Chart Wolf WLR Toolkit (VWAP + PDH/PDL + Kill Zone)Overview
This indicator is a single, unified trading framework that combines context → levels → confirmation → execution into one workflow. It is not a “mashup” of unrelated indicators — each component feeds the next step of the decision process so you can make the same type of decision every day with less chart clutter.
What makes it original
Most indicators independently display signals (trend, sessions, levels, etc.). This script is original in that it links components into a structured sequence:
Context (where and when): identifies market session/time context and key reference zones.
Key Levels (what matters): plots specific levels that price reacts to (e.g., previous day levels, value area levels, VWAP / anchors, etc.).
Confirmation (why now): requires price behavior to confirm acceptance/rejection around those levels instead of firing signals randomly.
Execution (how to trade it): provides clear entry/exit visualization and risk reference points once confirmation conditions are met.
How it works (conceptual logic)
The script follows a simple cause-and-effect model:
Reference levels define “decision areas” (places where liquidity and reactions commonly happen).
Price interacting with a decision area triggers state tracking (e.g., approaching level → testing level → rejection/acceptance).
A signal only appears when a complete sequence occurs (example: sweep/test → rejection/acceptance confirmation → continuation cue).
Optional filters (session, volatility, trend bias, etc.) reduce low-quality signals by requiring trades to occur in the intended conditions.
How to use it (step-by-step)
Choose your market & timeframe
Recommended: use a higher timeframe for context, lower timeframe for entries.
Example workflow: 15m for context + 5m/1m for execution.
Mark the decision areas
Use the plotted levels as “zones of interest.”
Your job is to wait for price to interact with these zones.
Wait for confirmation
Only take signals that occur at or near decision areas.
If price is chopping in the middle (between key levels), avoid trading.
Execute with defined risk
Stops should be placed beyond the rejection/sweep point or beyond the decision zone (depending on your strategy).
Targets can be the next major level plotted by the script.
Settings (what to adjust)
Session filter: turn on if you only trade specific hours (e.g., NY open).
Level visibility: hide levels you don’t use to reduce clutter.
Signal strictness: increase strictness to reduce frequency and improve quality; decrease for more signals.
Alerts: enable alerts for confirmed signals only (recommended).
Best practices
This tool performs best when you treat signals as confirmation, not “auto-trades.”
Always prioritize trades that occur at major levels during high-liquidity hours.
Backtest your market/timeframe combo before using it live.
Notes / limitations
Like all indicators, it does not predict the future; it organizes decision-making around recurring market behaviors.
Signals can appear during news volatility; consider disabling trading during major scheduled events.

Current and Previous Period Anchored VWAPanchored VVWAPS and previous month VWAP extend out into the following month. Includes 1SD for both

Koalafied VWAP D/W/M/Q/Y Volume Weighted Average Price (VWAP) for multiple periods with Standard Deviation band selection - Daily, Weekly, Monthly, Quarterly, Yearly

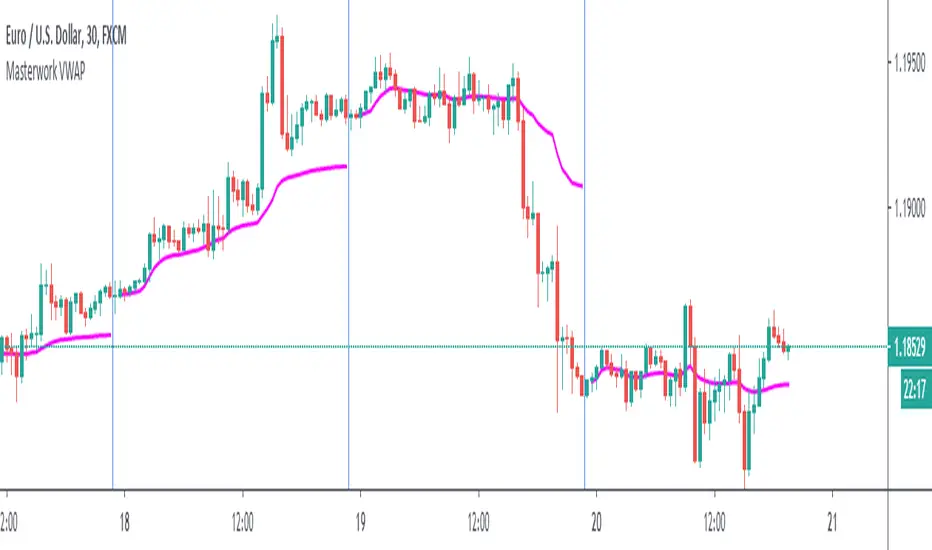
Masterwork VWAPWhen the session ends, built-in VWAP connects the line to the open of a new session. This transmission from session to another session very ugly. My script solves that.
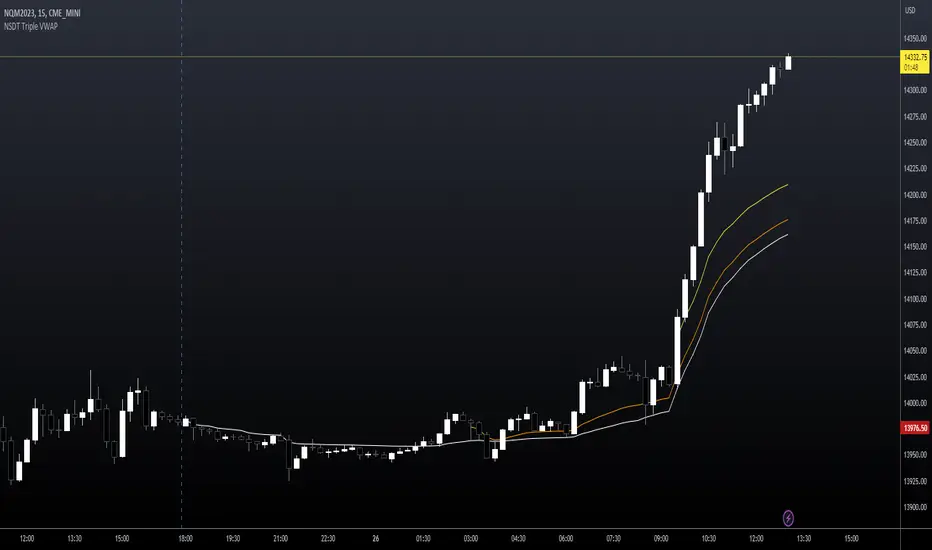
NSDT Triple VWAP with Adjustable Start TimesAllows you to plot 3 VWAP's with 3 different start times. Very useful for trading futures where there are multiple sessions involved. Can also be used with stocks to set as previous day, pre-market, and market open.
Anchored VWAPPine implementation of VWAP, similar to build-in, with anchors to Session, Week, Month and Year

VWAP Tension Bands + Osc Sigma Gap [MAXmks]Hello Traders,
This indicator started as an accident. I was building a different tool — a multi-metric dashboard — and added VWAP deviation as one of the components. I expected it to help catch falling knives. It didn't.
But I noticed something else. During cooling-off periods — when volatility fades and price just sits there, not really going anywhere — VWAP deviation on lower timeframes would start climbing quietly. And more often than not, a pullback followed. Sometimes a liquidity sweep first, then a pullback. I watched this pattern for months before deciding to build a dedicated tool around it, adding oscillator confirmation to filter the noise.
This is that tool.
The core idea
Markets act like a rubber band around VWAP — the further price stretches, the higher the tension. But raw deviation isn't enough. The real question: is momentum confirming the stretch, or lagging behind?
The σ-Gap captures when these two disagree — price pushed hard, but internals haven't caught up. That's where mean-reversion setups tend to appear.
The indicator tracks VWAP deviation across 2m / 5m / 15m simultaneously and compares it against a composite of momentum oscillators (Williams %R, CVD-based metrics). Signals require multi-timeframe consensus — no single timeframe can trigger alone.
Adaptive thresholds
What counts as "extreme" isn't fixed. Distance is measured in standard deviations (σ) , not pips or percentages — so the indicator adapts to volatility automatically. Thresholds scale with regime and historical distribution, adjusting to current market conditions in real time.
Two modes
Standard — adaptive thresholds, more signals. Good for active sessions and exploration.
High Precision — adds divergence confirmation from multiple oscillators (MFI, Delta RSI, CVD Z-Score). Fewer signals, higher selectivity.
Extreme Tension
When σ-Gap exceeds 1.6× the threshold, the indicator can fire without full confirmation. Rare, but these are the "overstretched" moments worth watching.
Filters (so you don't trade ghosts)
RVOL filter blocks signals during low activity. Session close filter avoids entries near VWAP reset. 24h volume filter skips illiquid instruments. Cooldown prevents signal clustering in the same direction.
Best use case
Built for short-term mean-reversion — quick snapback plays on 5m–15m charts where price overextends and reverts within a few candles. The engine is optimized for this rhythm, not for trend-following or swings.
On-chart
Tension Bands show dynamic threshold zones around VWAP. Signals are non-repainting and confirmed on bar close. Compact HUD displays all metrics, filter states, and signal status in real time.
Alerts
Pre-signal alerts when conditions start forming. Confirmed signal alerts with full breakdown: VWAP deviation values, σ-Gap readings, divergences detected, current mode.
Volume matters
This is a VWAP-based indicator. No volume data = no signal. If your instrument shows "No Volume" in the dashboard, switch to a data feed that provides it (crypto spot, futures, stocks with real volume).
A note on expectations
I use this logic in my own research and it has shown useful results for me in my backtesting scenarios. But this is an indicator for analysis , not a magic button. Your execution, fees, slippage, and market regime all matter. Treat signals as context, not commands. DYOR.
Feedback welcome.
For educational and analysis purposes only. Not financial advice.

VWAP Suite, Session Cloud RevOverview
The VWAP Suite with Standard Deviation Strategy is a comprehensive indicator designed to help traders make informed trading decisions based on the Volume Weighted Average Price (VWAP) and its associated standard deviation bands. This indicator provides multiple VWAP calculations for different timeframes (Session, Day, Week, Month) and incorporates standard deviation bands to identify potential trade entry and exit points.
Components
VWAP Calculation:
Session VWAP: VWAP calculated based on the current trading session.
Day VWAP: VWAP calculated for the daily timeframe.
Week VWAP: VWAP calculated for the weekly timeframe.
Month VWAP: VWAP calculated for the monthly timeframe.
Standard Deviation Bands:
The indicator includes three standard deviation bands (StDev 1, StDev 2, and StDev 3) around the VWAP. These bands help identify the dispersion of price from the VWAP, providing insight into potential overbought or oversold conditions.
Additional VWAP Lines:
VWAP 2: An additional VWAP line with a customizable timeframe (Day, Week, Month).
VWAP 3: Another VWAP line for further analysis with a customizable timeframe (Day, Week, Month).
Strategy Description
The primary strategy implemented in this indicator revolves around the second standard deviation band (StDev 2). The key aspects of this strategy include:
Entry Points:
Long Entry: Consider entering a long position when the price moves below the lower StDev 2 band and then starts to revert back towards the VWAP. This indicates a potential oversold condition.
Short Entry: Consider entering a short position when the price moves above the upper StDev 2 band and then starts to revert back towards the VWAP. This indicates a potential overbought condition.
Exit Points:
Long Exit: Exit the long position when the price moves back up to the VWAP or the upper StDev 1 band, indicating a normalization of the price.
Short Exit: Exit the short position when the price moves back down to the VWAP or the lower StDev 1 band, indicating a normalization of the price.
Risk Management:
Set stop-loss levels slightly beyond the StDev 3 bands to protect against significant adverse price movements.
Use trailing stops to lock in profits as the price moves favorably.
Customization
The VWAP Suite allows for extensive customization, enabling traders to adjust the following settings:
VWAP Mode: Select the timeframe for the primary VWAP calculation (Session, Day, Week, Month).
Line Widths and Colors: Customize the line widths and colors for VWAP and standard deviation bands.
Fill Opacity: Adjust the opacity of the fill between standard deviation bands for better visual clarity.
Additional VWAPs: Enable and customize additional VWAP lines (VWAP 2 and VWAP 3) for further analysis.
Multi-VWAP System🚀 Multi-VWAP System — Anchored VWAP & Deviation Bands
Overview
The Multi-VWAP System provides traders with a professional-grade approach to anchored VWAP analysis. Inspired by Brian Shannon's pioneering work on Anchored VWAP, this indicator automatically calculates and plots:
Current Session VWAP
Previous Session VWAP (also known as "2-Day VWAP")
High-of-Day (HOD) Anchored VWAP
Each VWAP can also display optional Standard Deviation Bands to highlight statistically significant deviations from the volume-weighted average price.
🔍 Why Anchored VWAP Matters
Volume Weighted Average Price (VWAP) is among the most critical institutional indicators, as it represents the average price paid for a stock adjusted by trading volume. This makes VWAP crucial for identifying fair value and significant areas of institutional activity.
Institutions utilize VWAP extensively to guide their execution algorithms. For instance, if price dips below a 2-day anchored VWAP (anchored to the previous session's open), many institutions interpret this as a discounted entry, potentially triggering large-scale buy programs. Conversely, sustained movement above VWAP signals strong buying pressure and bullish sentiment.
📌 Why Multiple Anchors?
Traders commonly anchor VWAPs at critical reference points:
Current Session VWAP:
Essential for day traders as a reference for intraday sentiment. Price action above this line generally indicates bullish sentiment, while price below signals bearish sentiment.
Previous Session (2-Day) VWAP:
Heavily used by institutions and swing traders, it provides insight into multi-session sentiment. Institutions commonly activate buy or sell programs based on whether price is trading at a premium or discount relative to this VWAP.
High-of-Day (HOD) VWAP:
Frequently used by momentum traders, this anchor captures sentiment after the most recent intraday high. Price above the HOD VWAP suggests sustained bullish momentum, while price below might signal weakening momentum.
🌟 Standard Deviation Bands
Each anchored VWAP in this indicator includes optional Standard Deviation Bands, highlighting statistical extremes. Traders use these bands to:
Identify potentially overextended moves (beyond +2σ or +3σ).
Gauge momentum strength (holding above +1σ).
Spot mean-reversion setups when price returns to VWAP after extreme moves.
🎨 Dynamic Background and Momentum Colorization
To visually highlight strength or weakness in price action relative to VWAP:
Dynamic Background Fill between Current and Previous VWAPs:
Green background appears when the Current VWAP is above the Previous VWAP and the linear regression slope (adjustable length) is positive, indicating bullish sentiment.
Red background appears when the Current VWAP is below the Previous VWAP and the slope is negative, indicating bearish sentiment.
No fill when conditions are mixed or momentum is uncertain.
Gold Fill above HOD VWAP:
When price action is above the High-of-Day VWAP and momentum (linear regression slope) is positive, a subtle gold shading appears, quickly highlighting bullish momentum.
⚙ Fully Customizable Settings
Session Times: Adjust session start and end times to match your specific market hours.
Standard Deviation Bands: Enable or disable each VWAP’s deviation bands individually and select how many bands (1σ, 2σ, or 3σ) you'd like to display.
Momentum Slope Length: Adjustable lookback for linear regression slope calculation—giving you full control of trend sensitivity.
🎯 Who Should Use This Indicator?
This indicator is perfect for:
Day Traders who want quick insights into intraday sentiment shifts.
Swing Traders tracking institutional footprints and seeking optimal entry/exit points.
Momentum Traders who rely on clearly visible momentum signals from HOD anchored VWAPs.
Institutional Traders and Professionals seeking sophisticated, institutionally-inspired VWAP analysis without manual anchoring.
📈 Summary of Features
✅ Automatic VWAP Anchors (Current Session, Previous Session, High-of-Day)
✅ Optional Standard Deviation Bands for each VWAP anchor
✅ Dynamic Background Coloring based on price action and momentum conditions
✅ Gold Momentum Highlight for quick bullish momentum identification above HOD VWAP
✅ Fully Customizable Inputs for precise personalization and flexibility
📢 Conclusion
The Multi-VWAP System isn't just another VWAP indicator. It's an institutional-level, dynamic, multi-dimensional analysis tool inspired by the work of Brian Shannon and leading institutional traders. It takes the guesswork out of anchoring and analysis, leaving you free to focus on identifying and executing high-probability trade setups.
Enjoy trading smarter—not harder. Happy Trading! 🚀📊

Luxy VWAP Magic - MTF Projection EngineThis indicator transforms the classic VWAP into a comprehensive trading system. Instead of switching between multiple indicators, you get everything in one place: multi-timeframe analysis, statistical bands, momentum detection, volume profiling, session tracking, and divergence signals.
What Makes This Different
Traditional VWAP indicators show a single line. This tool treats VWAP as a foundation for complete market analysis. The indicator automatically detects your asset type (stocks, crypto, forex, futures) and adjusts its behavior accordingly. Crypto traders get 24/7 session tracking. Stock traders get proper market hours handling. Everyone gets institutional-grade analytics.
Anchor Period Options
The anchor period determines when VWAP resets and recalculates. You have three categories of options:
Time-Based Anchors:
Session - Resets at market open. Best for intraday stock trading where you want fresh VWAP each day.
Day - Resets at midnight UTC. Standard option for most traders.
Week / Month / Quarter / Year - Longer reset periods for swing traders and position traders who want broader context.
Rolling Window Anchors:
Rolling 5D - A sliding 5-day window that never resets. Solves the Monday problem where weekly VWAP equals daily VWAP on first day of week.
Rolling 21D - Approximately one month of trading data in continuous calculation. Excellent for crypto and forex markets that trade 24/7 without clear session breaks.
Event-Based Anchors:
Dividends - Resets on ex-dividend dates. Track institutional cost basis from dividend events.
Splits - Resets on stock split dates. Useful for analyzing post-split trading behavior.
Earnings - Resets on earnings report dates. See where volume-weighted trading occurred since last quarterly report.
Standard Deviation Bands
Three sets of bands surround the main VWAP line:
Band 1 (Aqua) - Plus and minus one standard deviation. Approximately 68% of price action occurs within this range under normal distribution. Touches suggest minor extension.
Band 2 (Fuchsia) - Plus and minus two standard deviations. Only 5% of trading should occur outside this range statistically. Touches here indicate significant overextension and high probability of mean reversion.
Band 3 (Purple) - Plus and minus three standard deviations. Touches are rare (0.3% probability) and represent extreme conditions. Often marks climax moves or panic selling/buying.
Each band can be toggled independently. Most traders show Band 1 by default and add Band 2 and 3 for specific setups or volatile instruments.
Multi-Timeframe VWAP System
The MTF section plots previous period VWAPs as horizontal support and resistance levels:
Daily VWAP - Previous day's final VWAP value. Key intraday reference level.
Weekly VWAP - Previous week's final VWAP. Important for swing traders.
Monthly VWAP - Previous month's final VWAP. Institutional benchmark level.
Quarterly VWAP - Previous quarter's final VWAP. Major support/resistance for position traders.
Previous Day VWAP - Yesterday's closing VWAP specifically, separate from current daily calculation.
The Confluence Zone percentage setting determines how close multiple VWAPs must be to trigger a confluence alert. When two or more timeframe VWAPs converge within this threshold, you get a high-probability support/resistance zone.
Session VWAPs for Global Markets
For forex, crypto, and futures traders who operate in 24/7 markets, the indicator tracks three major global sessions:
Asia Session - UTC 21:00 to 08:00. Gold colored line. Typically lower volatility, range-bound action that sets overnight levels.
London Session - UTC 08:00 to 17:00. Orange colored line. Often determines daily direction with high volume European participation.
New York Session - UTC 13:00 to 22:00. Blue colored line. Highest volume session globally. Sharp directional moves common.
Previous session VWAP values display as horizontal lines when each session closes, acting as intraday support and resistance. The table shows which sessions are currently active with checkmarks.
On-Chart Labels and Signals
The indicator plots several types of labels directly on price action when significant events occur:
Volume Spike Labels
Fire when current bar volume exceeds configurable thresholds relative to both the previous bar and the 20-bar average. Default settings require 300% of previous bar AND 200% of average volume. Green labels indicate bullish candles. Red labels indicate bearish candles. These spikes often mark institutional entry points.
Momentum Shift Labels
Appear when VWAP acceleration changes direction. The Slowing label warns when an active trend loses steam, often preceding reversal. The Accelerating label confirms trend continuation or potential bottom during downtrends. Filters available to show only reversal signals in existing trends.
VWAP Squeeze Labels
Detect when standard deviation bands contract relative to ATR (Average True Range). Low volatility compression often precedes explosive breakout moves. When the squeeze fires (releases), a label appears with directional prediction based on VWAP slope.
Divergence Labels
Mark price/volume divergences using CVD (Cumulative Volume Delta) analysis:
Bullish divergence: Price makes lower low, but CVD makes higher low. Hidden accumulation despite price weakness.
Bearish divergence: Price makes higher high, but CVD makes lower high. Hidden distribution despite price strength.
Dynamic VWAP Coloring
The main VWAP line changes color based on its slope direction:
Green - VWAP is rising. Institutional buying pressure. Volume-weighted price increasing.
Red - VWAP is falling. Institutional selling pressure. Volume-weighted price decreasing.
Gray - VWAP is flat. Consolidation or balance between buyers and sellers.
This coloring can be disabled for a static blue line if you prefer cleaner visuals. The VWAP label next to the line shows the current trend direction and delta percentage.
Calculated Projection Cone
One of the most powerful features is the Calculated Projection Cone. Unlike traditional extrapolation methods that simply extend a trend line forward, this system analyzes what actually happened in similar market conditions throughout the chart's history.
How It Works:
The system classifies each bar into one of 27 unique market states:
Z-Score Level - LOW (oversold), MID (fair value), or HIGH (overbought) based on configurable thresholds
Trend Direction - DOWN, FLAT, or UP based on VWAP slope
Volume Profile - LOW (below 80%), NORMAL (80-150%), or HIGH (above 150%) relative volume
When you look at the current bar, the indicator:
1. Identifies the current market state (e.g., LOW Z-Score + UP Trend + HIGH Volume)
2. Searches through all historical bars on the chart that had the same state
3. Calculates what happened in those bars X bars later (where X is your projection horizon)
4. Shows you the probability of up/down and the average move size
Visual Elements:
Probability Cone - Colored green (bullish probability above 55%), red (bearish below 45%), or gold (neutral). The cone width represents the historical range of outcomes (roughly the 20th to 80th percentile).
Center Line - Shows the average expected price based on historical outcomes in similar conditions.
Probability Label - Displays direction probability and average move. Example: "67% UP (+0.8%)" means 67% of similar past cases moved up, averaging 0.8% gain.
Fallback System:
When the exact 27-state match has insufficient historical data:
First fallback: Uses Z-Score plus Trend only (9 broader states, ignoring volume)
Second fallback: Uses Z-Score only (3 states)
When fallback is active, confidence automatically adjusts
Settings:
Projection Horizon - How many bars forward to analyze outcomes (5, 10, 15, or 20 bars, default 10)
Lookback Period - Historical data window in days (30-252, default 60)
Minimum Samples - Cases needed before using fallback (5-30, default 10)
Z-Score Threshold - Bucket boundary for LOW/MID/HIGH classification (1.0, 1.5, or 2.0 sigma)
Cloud Transparency - Adjust visibility (50-95%)
Colors - Customize bullish, bearish, and neutral cone colors
Confidence Levels:
HIGH - 30 or more similar historical cases found
MEDIUM - 15-29 similar cases
LOW - Fewer than 15 cases (more uncertainty)
IMPORTANT DISCLAIMER:
The Calculated Projection is based on past patterns only. It is NOT a price prediction or financial advice. Similar market states in the past do not guarantee similar outcomes in the future. The probability shown is historical frequency, not a guarantee. Always combine with other analysis and never rely solely on projections for trading decisions.
Alert Conditions
The indicator includes over 20 pre-built alert conditions:
Price vs VWAP:
Price crosses above VWAP
Price crosses below VWAP
Band Touches:
Price touches plus or minus one sigma band
Price touches plus or minus two sigma band (extreme)
Price touches plus or minus three sigma band (very extreme)
Z-Score Extremes:
Z-Score crosses above plus two (overbought extreme)
Z-Score crosses below minus two (oversold extreme)
Momentum and Trend:
Momentum slowing
Momentum accelerating
Trend turns bullish/bearish/neutral
Volume:
Volume spike detected
CVD Direction:
Buyers take control
Sellers take control
High Probability Signals:
Bullish reversal signal (oversold plus accelerating momentum)
Bearish reversal signal (overbought plus slowing momentum)
MTF and Special:
MTF confluence zone entry
VWAP squeeze fired
Bullish/Bearish divergence detected
Any significant signal (catch-all)
All signals use confirmed bar data to prevent false alerts from incomplete candles.
Settings Overview
Settings are organized into logical groups:
VWAP Settings
Anchor Period selection
Show/Hide VWAP line
Dynamic coloring toggle
VWAP label visibility
Bands Visibility
Toggle each of three bands independently
Info Table
Show/Hide table
Table position (9 options)
Text size
Volume spike label settings with adjustable thresholds
Momentum label settings with filters
Signal labels limited to 5 most recent (auto-managed)
Probability engine lookback period
Multi-Timeframe VWAP
Enable/Disable MTF system
Show MTF in table
Show MTF lines on chart
Individual timeframe toggles
Confluence zone threshold
Squeeze detection toggle
Session VWAPs
Enable/Disable session tracking
Apply to all assets option
Show session labels
Divergence Detection
Enable/Disable divergence
Pivot lookback period
Show divergence labels
Calculated Projection
Enable/Disable projection cone
Projection horizon (5, 10, 15, or 20 bars)
Lookback period in days (30-252)
Minimum samples threshold
Z-Score classification threshold (1.0, 1.5, or 2.0 sigma)
Cloud transparency adjustment
Bullish, bearish, and neutral colors
The Info Table - Your Trading Dashboard
The right side of your chart displays a compact table with up to twelve metrics.
Row-by-Row Breakdown:
Asset and Period - Shows what the indicator detected (US Stock, Crypto, Forex, etc.) and your selected anchor period. The detection happens automatically based on exchange data, so VWAP resets and calculations match your actual trading instrument.
Delta Percentage - How far current price sits from VWAP, expressed as a percentage. Positive means price trades above fair value. Negative means below. Large delta values (beyond 1-2%) often precede mean reversion moves. Day traders watch this for overextension.
Z-Score - Statistical deviation from VWAP measured in standard deviations. Unlike raw delta, Z-Score accounts for volatility. A 2% move in a volatile biotech stock differs from 2% in a stable utility. Z-Score normalizes this. Values beyond plus or minus two sigma occur only 5% of the time statistically.
Trend Direction - Whether VWAP itself is rising, falling, or flat. Rising VWAP means the volume-weighted average price is increasing, which indicates institutional accumulation. Falling VWAP suggests distribution. This differs from price trend since it weights by volume.
Momentum State - Is the trend accelerating or slowing down? This measures the rate of change in VWAP slope. When an uptrend shows slowing momentum, it often precedes reversal. Accelerating momentum in a downtrend can signal capitulation and potential bottom.
Relative Volume - Current bar volume compared to the 20-bar average, shown as percentage. Values above 150% indicate above-average activity. Spikes above 200-300% often mark institutional involvement. Low volume (below 80%) warns of potential fake moves.
MTF Bias - Four checkmarks or X marks showing whether price sits above or below Daily, Weekly, Monthly, and Quarterly VWAP. Four checkmarks means strong bullish alignment across all timeframes. Four X marks indicates bearish alignment. Mixed readings suggest consolidation or transition.
Band Probabilities - Historical statistics showing how often price touched each standard deviation band over your lookback period. This helps you understand if mean reversion or trend following works better for your specific instrument.
Session Status - Which global trading sessions are currently active (Asia, London, New York). Shows checkmarks for active sessions. Important for forex and crypto traders who need to know when major liquidity windows open and close.
Divergence State - Whether the indicator detects bullish or bearish divergence between price and cumulative volume delta. Bullish divergence occurs when price makes lower lows but buying pressure (CVD) makes higher lows, suggesting hidden accumulation.
Confidence Score - A weighted composite of all factors displayed as a progress bar and percentage. Combines MTF alignment, Z-Score, trend direction, volume delta, momentum, and relative volume into a single 0-100 score. Higher scores indicate stronger conviction setups.
Calculated Projection - When the Projection Cone is enabled, shows the historical probability of price direction and expected move. For example: "▲ 67% (+0.8%)" means in similar market states historically, price moved up 67% of the time with an average gain of 0.8%. The system analyzes 27 unique market states based on Z-Score, Trend, and Volume conditions.
Recommended Use Cases
Day Trading Stocks:
Use Session anchor with Band 1 visible. Watch for price returning to VWAP after morning move. Volume spikes near VWAP often mark institutional accumulation zones.
Swing Trading:
Use Weekly or Rolling 21D anchor. Enable MTF lines for Daily and Weekly levels. Trade pullbacks to these levels in direction of MTF bias.
Crypto and Forex:
Enable Session VWAPs. Use Rolling anchors to avoid artificial resets. Monitor session transitions for breakout opportunities.
Mean Reversion:
Focus on Z-Score reaching plus or minus two. Add Band 2 visibility. Combine with slowing momentum for highest probability reversals.
Trend Following:
Watch MTF bias alignment. Four checkmarks plus accelerating momentum plus high volume confirms trend continuation setups.
Projection Planning:
Enable the Calculated Projection to see what happened historically in similar market conditions. Use 5-10 bars for intraday setups, 15-20 bars for swing trade planning. Focus on high probability readings (above 60%) with HIGH confidence (30 or more samples). The cone shows the probable range of outcomes based on actual historical data. Combine with other factors like MTF alignment and volume for higher conviction setups.
Important Notes
The indicator does not repaint. MTF values use previous period's confirmed data.
Rolling VWAP works best on 15-minute timeframes and above due to bar lookback requirements.
Session VWAPs apply to global markets by default (forex, crypto, futures). Enable the all-assets option for stocks if desired.
Volume data for forex represents tick volume, not actual traded volume.
All alert conditions fire only on confirmed (closed) bars to prevent false signals.
The Calculated Projection updates each bar as market state changes. This is expected behavior. The projection shows probabilities based on similar past conditions, not a fixed prediction.
Q AND A
Q: Does this indicator repaint?
A: No. The main VWAP calculation uses standard TradingView VWAP methodology. Multi-timeframe values use previous period's confirmed data with appropriate lookahead settings. All alert signals require bar confirmation.
Q: Why does my Rolling VWAP look different on 1-minute versus 15-minute charts?
A: Rolling VWAP calculates across a fixed number of trading days. On very short timeframes, the bar lookback may hit TradingView limits. For best Rolling VWAP accuracy, use 15-minute or higher timeframes.
Q: Can I use this on any instrument?
A: Yes. The indicator automatically detects asset type and adjusts behavior. Stocks use standard market hours. Crypto uses 24/7 calculations. Forex uses tick volume. Everything adapts automatically.
Q: What does the Confidence Score actually measure?
A: The score combines six weighted factors: MTF alignment (25%), Z-Score position (20%), Trend direction (20%), CVD pressure (15%), Momentum state (10%), and Relative volume (10%). Higher scores indicate more factors aligned in one direction.
Q: Why are Session VWAPs not showing on my stock chart?
A: Session VWAPs apply to 24-hour markets by default (forex, crypto, futures). For stocks, enable the Use for All Assets option in Session VWAP settings.
Q: The Divergence labels appear delayed. Is this a bug?
A: Divergence detection requires pivot confirmation, which needs bars on both sides of the pivot point. The label appears at the actual pivot location (several bars back) once confirmed. This is intentional and prevents false signals.
Q: Can I change the band colors?
A: Yes. Each of the three bands has its own color input setting. You can customize Band 1, Band 2, and Band 3 colors to match your preferences. The defaults are Aqua, Fuchsia, and Purple. The main VWAP line color adapts dynamically based on slope direction or can be set to static blue.
Q: How do I set up alerts?
A: Right-click on the chart, select Add Alert, choose this indicator, and select your desired condition from the dropdown. All conditions include descriptive alert messages with relevant data.
Q: What is the Probability Engine lookback period?
A: This setting determines how many trading days the indicator analyzes to calculate band touch rates and mean reversion statistics. Default is 60 days (approximately 3 months). Longer periods provide more stable statistics but may miss recent behavior changes.
Q: Why do I see fewer labels than expected?
A: Signal labels (Volume, Momentum, Squeeze, Divergence) are limited to 5 most recent labels on the chart to keep it clean. When a new label appears, the oldest one is automatically removed. Additionally, momentum labels have several filters: check the slope multiplier setting (higher values require stronger trends) and the Only Reversal Signals option (when enabled, labels only appear for potential reversals, not trend confirmations).
Q: What is the Calculated Projection and how accurate is it?
A: The Calculated Projection analyzes what happened in past market conditions similar to the current state. It classifies each bar by Z-Score level, Trend direction, and Volume profile (27 unique states), then shows the historical probability of up vs down and the average move size. It is NOT a price prediction or guarantee. The probability shown is how often similar conditions led to up/down moves historically, not a future guarantee. Always use it as one input among many.
Q: Why does the Projection probability change?
A: The projection updates on each bar as market state changes. If Z-Score moves from LOW to MID, or trend shifts from UP to FLAT, the system looks up a different historical category. This is expected behavior. The projection shows what happened in similar past conditions to the current bar's state.
Q: The Projection shows LOW confidence. What does that mean?
A: Confidence levels indicate sample size: HIGH means 30 or more historical cases found, MEDIUM means 15-29 cases, LOW means fewer than 15 cases. When sample size is low, the system uses a fallback: first aggregating by Z-Score plus Trend only (ignoring volume), then by Z-Score only. LOW confidence means less statistical reliability, so weight other factors more heavily in your decision.
Q: Why does the cone sometimes show 50/50 probability?
A: A 50/50 reading means that in similar past market states, price moved up roughly half the time and down half the time. This indicates a neutral or balanced condition where historical patterns provide no directional edge. Consider waiting for a higher probability setup or using other analysis methods.
CREDITS AND ACKNOWLEDGMENTS
Methodology Foundation:
VWAP (Volume Weighted Average Price) - Standard institutional benchmark calculation, widely used since the 1980s for algorithmic execution and fair value assessment
Standard Deviation Bands - Statistical volatility measurement applying normal distribution principles to price deviation from mean
Z-Score Analysis - Classic statistical normalization technique for comparing values across different volatility regimes
Cumulative Volume Delta (CVD) - Order flow analysis concept measuring aggressive buying versus selling pressure
Concept Integration:
Mean reversion probability engine - Custom historical statistics tracking for band touch rates
Momentum acceleration detection - Second derivative analysis of VWAP slope changes
VWAP Squeeze - Volatility compression concept adapted from TTM Squeeze methodology applied to VWAP bands versus ATR
Confidence scoring system - Weighted composite scoring combining multiple technical factors
Calculated Projection Cone - Probability-based projection using 27-state market classification (Z-Score, Trend, Volume) with historical outcome analysis and weighted fallback system
All calculations use standard public domain formulas and TradingView built-in functions. No proprietary third-party code was used.
For questions, feedback, or feature requests, please comment below or send a private message.
Happy Trading!

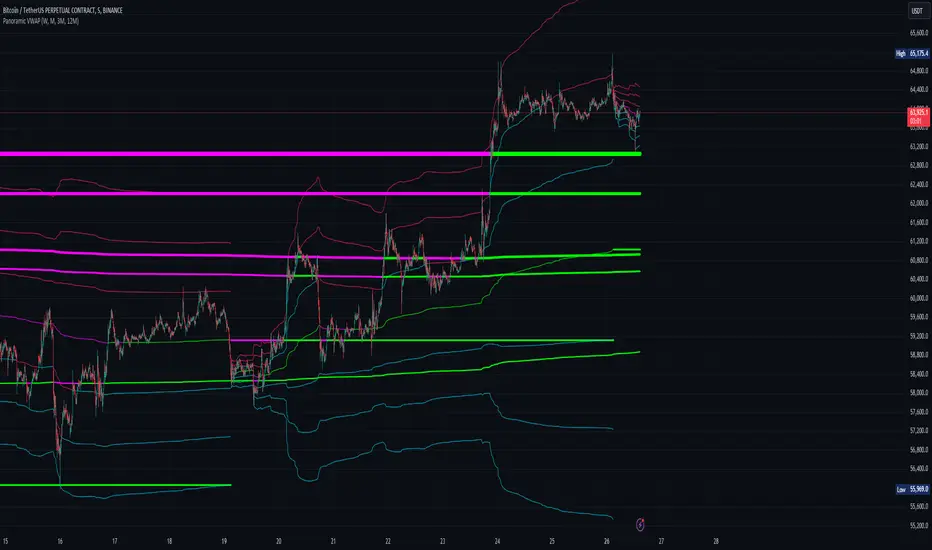
Panoramic VWAP### Panoramic VWAP Indicator Overview
The Panoramic VWAP indicator provides a way to display up to four Volume Weighted Average Price (VWAP) lines on a chart, each anchored to different timeframes. This indicator also includes options for displaying standard deviation bands and close lines, offering a comprehensive view of price action across multiple time horizons.
### Key Features
Quad VWAPs : The indicator allows for the display of four VWAP lines simultaneously. Each line can be set to a different timeframe, enabling traders to analyze market conditions across various periods on a single chart.
Standard Deviation Bands : Users can enable bands around each VWAP line, which represent standard deviations or percentage levels from the VWAP. These bands help in assessing volatility and identifying potential overbought or oversold conditions.
Close Lines : The indicator includes an option to show close lines, marking the price's closing level relative to the VWAP. This feature is useful for examining how the market closes in relation to VWAP, which can be important for understanding trend strength or potential reversals.
### How It Looks
VWAP Lines : Multiple VWAP lines are displayed, each reflecting different timeframes. The lines change color depending on whether the price is above or below the VWAP, indicating bullish or bearish momentum.
Bands : Optional bands around the VWAP lines provide a visual indication of volatility, with the potential to identify overbought or oversold areas.
Close Lines : These lines represent the price's closing level relative to the VWAP and can be displayed to add further context to the analysis.
### How to Use It
Trend Analysis :
- Price above a VWAP line indicates bullish momentum .
- Price below a VWAP line suggests bearish momentum .
Support and Resistance :
- VWAP lines often act as dynamic support and resistance. Price approaching a VWAP line from above may find support, while approaching from below may encounter resistance.
Volatility Assessment :
- Bands around the VWAP lines can signal areas of potential reversal. Upper bands may indicate overbought conditions, while lower bands may indicate oversold conditions.
Multiple Timeframe Analysis :
- The ability to display VWAPs from different timeframes simultaneously allows for the identification of confluence zones, where multiple VWAP levels align, indicating potentially significant support or resistance levels.
Customization :
- The indicator settings are customizable, allowing users to choose which VWAP lines, bands, and close lines to display, along with adjustments for visual preferences like line thickness and colors.
### Practical Application
Intraday Trading : Traders can use the VWAPs and bands to identify potential entry and exit points during the trading day based on price interactions with these levels.
Swing Trading : Monitoring VWAP lines across different timeframes can help identify key levels where price might reverse or gain momentum, aiding in decisions about holding or exiting positions.
Long-Term Analysis : VWAP lines on higher timeframes can serve as dynamic support or resistance levels, providing context for long-term trend analysis and investment decisions.
The Panoramic VWAP indicator allows for a detailed analysis of price trends and levels across multiple timeframes, combining VWAPs, standard deviation bands, and close lines in a single, customizable tool.
VWAP Multi-TimeframeThis is a multi-timeframe VWAP indicator that provides volume weighted average price calculations for the following time periods:
15min
30min
1H
2H
4H
6H
8H
12H
1D
1W
1M
3M
6M
1Y
You can use the lower timeframes for short term trend control areas and use the longer timeframes for long term trend control areas. Trade in the direction of the trend and watch for price reactions that you can trade when price gets close to or touches any of these levels.
This indicator will provide a data plot value of 1 for bullish when price is above all VWAPs that are turned on, -1 for bearish when price is below all VWAPs that are turned on and 0 for neutral when price is not above or below all VWAPs. Use this 1, -1, 0 value as a filter on your signal generating indicators so that you can prevent signals from coming in unless they are in the same direction as the VWAP trend.
Features
Trend direction value of 1, -1 or 0 to send to external indicators so you can filter your signal generating indicators using the VWAP trend.
Trend table that shows you whether price is above or below all of the major VWAPs. This includes the daily, weekly, monthly and yearly VWAPs.
Trend coloring between each VWAP and the close price of each candle so you can easily identify the trend direction.
Customization
Set the source value to use for all of the VWAP calculations. The default is HLC3.
Turn on or off each VWAP.
Change the color of each VWAP line.
Change the thickness of each VWAP line.
Turn on or off labels for each VWAP or turn all labels on or off at once.
Change the offset length from the current bar to the label text.
Change the label text color.
Turn on or off trend coloring for each VWAP.
Change the color for up trends and down trends.
Turn on or off the trend direction display table.
Change the location of the trend direction display table.
Adjust the background and text colors on the trend direction display table.
How To Use The Trend Direction Filtering Feature
The indicator will provide a data plot value of 1 for bullish when price is above all of the VWAPs that are turned on, a value of -1 for bearish when price is below all of the VWAPS that are turned on and a value of 0 for neutral when price is above and below some of the VWAPs that are turned on.
The name of the value to use with your external indicators will show up as: VWAP Multi-Timeframe: Trend Direction To Send To External Indicators
Make sure to use that as your source on your external indicators to get the correct values.
This 1, -1 or 0 value can then be used by another external indicator to tell the indicator what is allowed to do. For instance if you have another indicator that provides buy and sell signals, you can use this trend direction value to prevent your other indicator from giving a sell signal when the VWAP trend is bullish or prevent your other indicator from giving a buy signal when the VWAP trend is bearish.
You will need to program your other indicators to use this trend filtering feature, but this indicator is already set up with this filtering code so you can use it with any other indicator that you choose to filter(if you know how to customize pine script).
Markets You Can Use This Indicator On
This indicator uses volume and price to calculate values, so it will work on any chart that provides volume and price data.

Session VWAPs [cryptalent]This indicator provides a more granular and timely analysis of market structure compared to traditional daily Volume Weighted Average Price (VWAP). It splits the 24-hour trading day into four distinct, customizable sessions (T1, T2, T3, T4), calculating an independent Session VWAP and Standard Deviation Bands for each segment.
🌟 Key Features and Functionality
1. Segmented VWAP Calculation
Purpose: To track the true Volume Weighted Average Price (Fair Value) specific to the participants and trading activities within different global market sessions (e.g., Asian, European, US sessions).
Design: By default, the 24 hours (based on UTC time) are divided into T1 (00:00-06:00), T2 (06:00-12:00), T3 (12:00-20:00), and T4 (20:00-00:00).
Mechanism: The VWAP calculation resets at the start of each designated session, offering a clearer, segment-specific view of market consensus and volume absorption.
2. Standard Deviation Bands
Calculation: Each Session VWAP line is accompanied by upper and lower standard deviation bands.
Control: The width of these bands is controlled by the user input "Band Multiplier" (default is 1.0, representing one standard deviation).
Application: These bands measure the Volume-Weighted Volatility and define the expected "normal" trading range for the current session.
- Price within the bands suggests consolidation or a normal auction process.
- Price breaking out of the bands indicates strong directional momentum or an extreme/overbought/oversold condition for that specific session.
3. High Customization (User Inputs)
Session Timing: All four session start and end times (in UTC) are customizable, allowing traders to align the indicator with specific market hours or individual trading strategies.
Price Source: The source price used for the VWAP calculation is selectable (default is close).
💡 Trading Applications
1. Fair Value Identification: The VWAP line serves as the "Fair Value" or "Volume-Weighted Consensus Cost" for the active session.
Price above VWAP: Buyers are in control during that session.
Price below VWAP: Sellers are in control during that session.
2. Dynamic Support & Resistance: Both the VWAP and the Standard Deviation Bands often act as reliable dynamic support and resistance levels.
3. Volatility Assessment: The width of the bands reflects the volume-weighted volatility of the current session. Narrow bands suggest range-bound trading; wide bands imply strong directional activity.
4. Trend Strength: Sustained price action outside of the standard deviation bands is a key measure of the strength and commitment behind a current trend.
