Vwap Daily By SamsungTitle
Daily VWAP with Historical Lookback (Logic Fix)
Description
This script calculates and plots the daily Volume-Weighted Average Price (VWAP), an essential tool for intraday traders.
What makes this indicator special is its robust plotting logic. Unlike many simple VWAP scripts that struggle to show data for previous days, this version includes a crucial fix that allows you to reliably display historical VWAP lines for as many days back as you need. This allows for more comprehensive backtesting and analysis of how price has interacted with the VWAP on previous trading days.
This is an indispensable tool for traders who use VWAP as a dynamic level of support/resistance, a benchmark for trade execution quality, or a gauge of the day's trend.
Key Features
Historical VWAP Display: Easily plot VWAP for multiple past days on your chart. Simply set the number of lookback days in the settings.
Accurate Daily Calculation: The VWAP calculation correctly resets at the beginning of each new trading session (00:00 server time).
Fully Customizable: You have full control over the appearance of the VWAP line, including its color, width, and style (Solid or Stepped).
Robust Plotting Engine: This script solves the common Pine Script issue where conditionally plotted historical lines fail to render. It works reliably on all intraday timeframes.
Built-in Debug Mode: For advanced users or those curious about the inner workings, a comprehensive debug mode can be enabled to display raw VWAP values, cumulative volume, and timeframe warnings.
How to Use
Add the "Daily VWAP with Historical Lookback" indicator to your chart.
IMPORTANT: Make sure you are on an intraday timeframe (e.g., 1H, 30M, 15M, 5M, 1M). This indicator is designed for intraday analysis and will display a warning if used on a daily or higher timeframe.
Open the indicator's settings.
In the "VWAP Settings" tab, adjust the "Lookback Days to Display" to set how many previous days of VWAP you want to see. (e.g., 0 for today only, 1 for today and yesterday, 10 for the last 10 days).
Customize the line's appearance in the "Line Style" tab.
The "Logic Fix" Explained (For Developers)
A common challenge in Pine Script is conditionally plotting data for historical bars. Many scripts attempt this by dynamically changing the plot color to na (transparent) for bars that shouldn't be displayed. This method is often unreliable and can result in the entire plot failing to render.
This script employs a more robust and standard approach: manipulating the data series itself.
The Problem: plot(vwap, color = shouldPlot ? color.red : na) can be buggy.
The Solution: plot(shouldPlot ? vwap : na, color = color.red) is reliable.
Instead of changing the color, we create a new data series (plotVwap). This series contains the vwapValue only on the bars that meet our date criteria. On all other bars, its value is na (Not a Number). The plot() function is designed to handle na values by simply "lifting the pen," creating a clean break in the line. This ensures that the VWAP is drawn only for the selected days, with 100% reliability across all historical data.
Settings Explained
Lookback Days to Display: Sets the number of past days (from the last visible bar) for which to display the VWAP.
Line Color, Width, and Style: Standard cosmetic settings for the VWAP line.
Enable Debug Mode (Master Switch): Toggles all debugging features on or off. It is enabled by default to help new users.
Display Debug: Cumulative Volume: When enabled, it shows the daily cumulative volume in a gray area on a separate pane.
Display Debug: Raw VWAP Value: When enabled, it plots the raw, unfiltered VWAP calculation for all days on the chart, helping to verify the core logic.
This script is provided for educational and informational purposes. Trading involves significant risk. Always conduct your own research and analysis before making any trading decisions.
If you find this script useful, a 'Like' is always appreciated! Happy trading
Cerca negli script per "vwap"
Auto Anchored Swing VWAP'sThe Auto Anchored Swing VWAP's indicator automatically anchors Volume-Weighted Average Price (VWAP) lines to recent swing highs and swing lows. VWAPs often act as key support or resistance levels because they represent the average price at which the majority of trading volume has occurred over a given time.
What is VWAP? VWAP is an essential tool in trading, representing the average price of a security over a specific period, weighted by volume. It helps traders identify the average price at which most trades have been executed, providing a balanced view of price action over time.
Anchored VWAPs: Unlike traditional VWAPs, which start from the beginning of the day, anchored VWAPs allow traders to "anchor" the calculation to a specific point in time or a pivot on the chart, in this case a swing high and swing low. This version of VWAP follows the price action from a selected point forward.
When the price is above the VWAP, it indicates that the majority of traders have paid less for the asset, creating a potential support zone as buyers may step in at or near this level. On the other hand, when the price is below the VWAP, it suggests that most traders have paid a higher price, which can lead to a resistance level where sellers may appear to defend their positions.
Anchored VWAPs, in particular, provide more precise support and resistance levels by starting from a specific swing high, swing low, or other significant point on the chart. This allows traders to track how price interacts with these levels after a certain bar.
The selectable pivot lookback length in this indicator defines the number of bars to the left and right of a potential swing high or swing low that must be lower (for a swing high) or higher (for a swing low) in order to confirm the pivot. In other words, it controls how many surrounding bars need to validate a local price extreme before it is considered a true swing point.
For example, if the lookback length is set to 9, a swing high is identified when there are 9 bars to the left and 9 bars to the right that all have lower highs than the current bar. The same logic applies for swing lows, where the price must be lower than the highs of the bars to the left and right for it to be considered a swing low.
This parameter allows traders to control the sensitivity of the swing points used to anchor VWAPs. A smaller lookback value will identify more frequent and short-term swing highs and lows, making the VWAPs more responsive to recent price action. Conversely, a larger lookback value will result in fewer but more significant swing points.
Pine Script
Utilization of Pine Script’s Enum Feature: This indicator leverages Pine Script's new enum feature for the selection of the VWAP lines (solid, dashed, or dotted) style.
VWAP Bands - Event Based [LuxAlgo]This indicator returns VWAP bands with a degree of smoothness resetting based on various user-selected events. The bands are constructed using a VWAP based naive standard deviation.
The indicator can be anchored or start from the first bar and can be used as trailing support/resistance, in a moving average crossover system, or as source for external indicators.
Settings
Start: VWAP anchor point
Start At First Bar: Display the VWAP from the first bar instead of a specified anchor point
VWAP
Length: Controls certain characteristics of the user-selected event
Mult: Multiplicative factor for the VWAP standard deviation
Source: Price source of the indicator
Event
Event: Determines the event resetting the degree of smoothness of the VWAP
External Cross/Event: Input source used for external crosses/events
Further details about the available events are given below.
Details
Various event conditions are available to the users. When the selected event occurs, the VWAP equals the current closing price.
By default, the event is periodic, that is the VWAP resets periodically, with a period determined by the Length setting.
The Higher High event resets the VWAP when a new higher high occurs.
The Lower Low event resets the VWAP when a new lower low occurs.
The Trend Change event is similar however resets the VWAP only once a higher high or lower low occurs. Higher highs and lower lows are given by Donchian channels with a period determined by the Length setting.
The Start event reset the VWAP at the selected anchor point (or first bar if the "Start At First Bar" setting is selected). This can be useful if one only needs a regular anchored VWAP band indicator.
The External Cross event resets the VWAP when the Source price crosses the series selected in the External Cross/Event setting. In the image above the VWAP resets when the price crosses the volatility stop indicator.
The External Event resets the indicator when a series selected in the External Cross/Event setting is not equal to 0. This allows using a custom event in order to reset the VWAP. In the above example the VWAP is reset during a new session due to the External Session indicator.
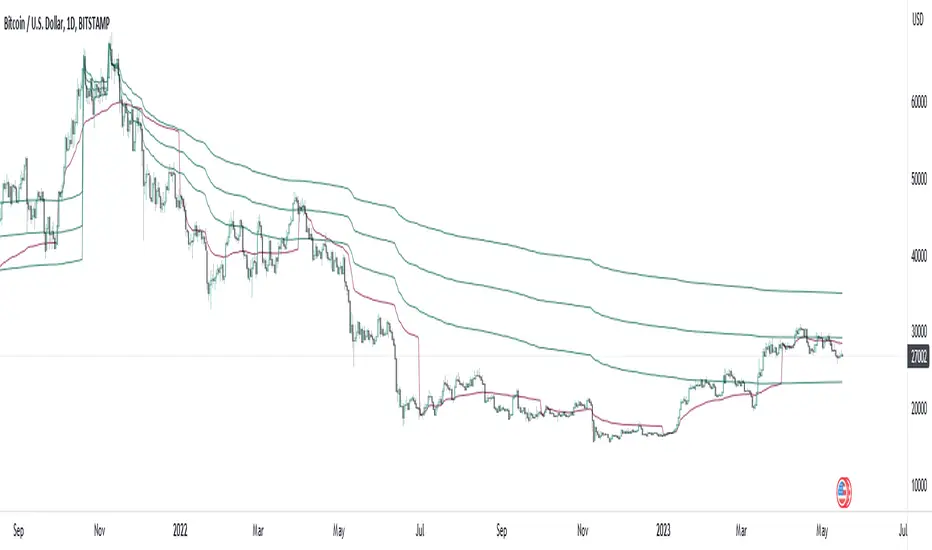
MTF VWAP + Fibo Incremental deviationsI made a Fibo variant of my first script "VWAPs + devs" :
This new indicator give you the possibility to plot multi timeframes VWAP (D, W, M, 3M and 12M ) and Fibo deviations for each one.
VWAP is a powerfull indicator which is used by big players to get informations if the price is "overbought" or "oversold". Deviations give the opportunity to have supports and resistances in those "over"-zones.
I searched for better results and found those defaults values :
Fib 1 level : 0.618
Fib 2 level : 0.786
Fib 3 level : 1.000
Fib 4 level : 1.618
Fib 5 level : 2.618
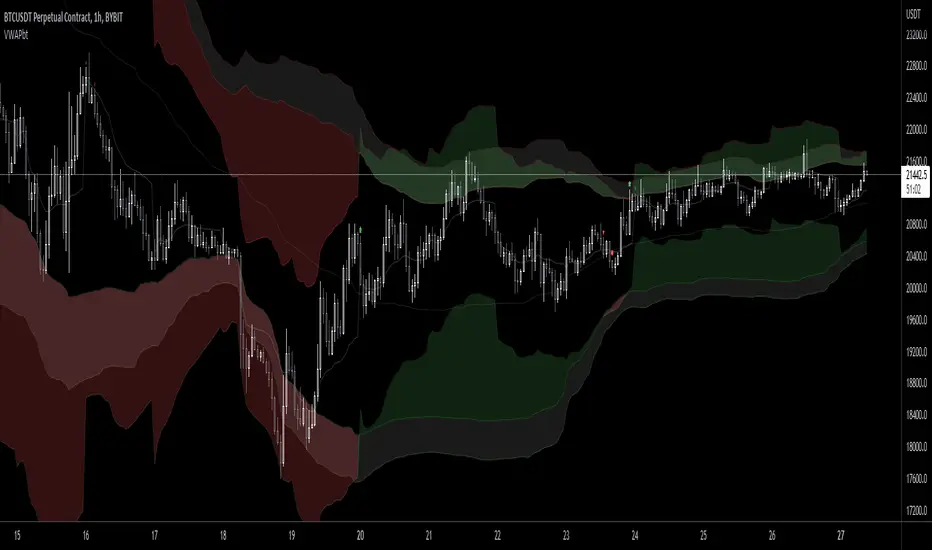
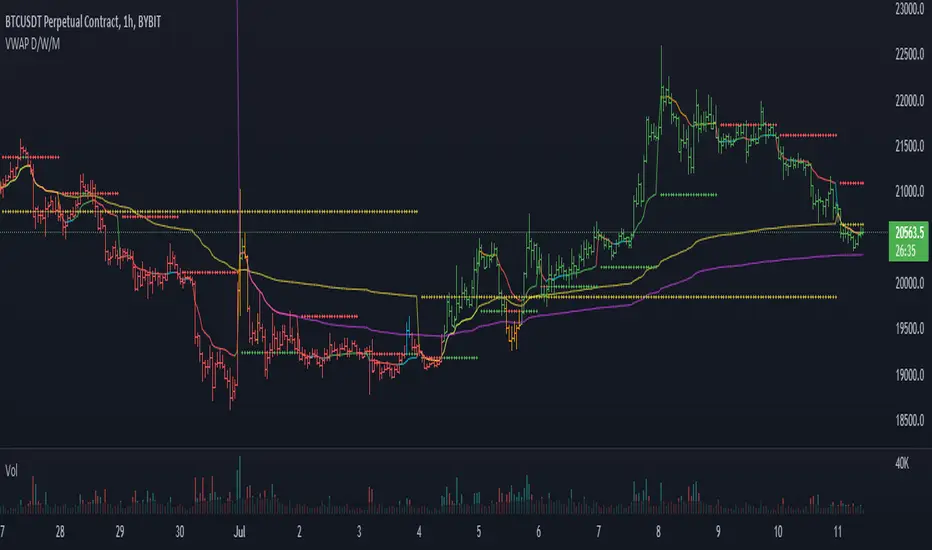
In the thumbnail, we can see that the 1.618 deviation level made a great support on the last uptrend for BTCUSDT .
You can change each values but low ones as 0.382 and 0.5 don't give really interesting supports/resistances.
I made this script as clear and simple as possible with only one menu in the parameters.
Some examples of what you can do :
BTCUSDT (Binance) H4 / D, W, M, 3M ,12M VWAP without devs
BTCUSDT (Binance) M5 / Daily VWAP + Fibo devs
Hope this will be useful for you !

Multi VWAPsMulti VWAPs Inspired by Biran Shannon and his book:
"MAXIMUM TRADING GAINS WITH ANCHORED VWAP . The Perfect Combination of Price, Time & Volume."
(ISBN 9798986868004)
A comprehensive VWAP (Volume Weighted Average Price) indicator that combines multiple timeframes and sessions in one view. Perfect for day trading and swing trading across different markets.
Features:
• Multiple VWAP Timeframes:
- Daily VWAP
- Weekly VWAP
- Monthly VWAP
- Quarterly VWAP
- Yearly VWAP
• Session-specific VWAPs:
- London Session (3:00 AM - 11:30 AM NY time)
- New York Session (9:30 AM - 4:00 PM NY time)
• Additional Indicators:
- Midnight Price Line (Previous day's closing price)
- 5-Day Moving Average
- 50-Day Moving Average
• Customization Options:
- Toggle individual VWAPs and indicators
- Customize colors for each component
- Adjustable label positioning
- MA smoothing settings
- Option to show/hide previous day's midnight price
• Smart Features:
- Auto-adjusting calculations based on timeframe
- Clear session boundaries
- Optimized for all chart timeframes
- Clean label system
Perfect for:
• Day traders tracking multiple timeframe momentum
• Swing traders using longer-term VWAPs
• Session traders focusing on London/NY hours
• Multi-timeframe analysis
• Price action trading with VWAP support/resistance
This indicator combines essential trading tools in one clean interface, helping you make informed decisions without cluttering your chart.
VWAP CALENDARThe VWAP CALENDAR indicator plots up to 20 anchored Volume-Weighted Average Price (VWAP) lines on your chart, each starting from a user-defined date and time (e.g., April 20, 2024). Designed for simplicity, it helps traders visualize VWAPs for key events or dates, with customizable labels and colors. The indicator is optimized for crypto markets (e.g., BTC/USD) but works with any symbol providing volume data.
Features: Multiple VWAPs: Configure up to 20 independent VWAPs, each with a custom anchor date and time.
Dynamic Labels: Labels update in real-time, aligning precisely with each VWAP line’s price level, positioned to the right of the chart for clarity.
Customizable Settings: Adjust label text (e.g., “Event A”), line colors, line widths (1–5 pixels), text colors, and text sizes (8–40 points, default 22).
Bubble or No-Background Labels: Choose between bubble-style labels (with colored backgrounds) or plain text labels without backgrounds.
Timeframe Support: Accurate on daily, 4-hour, 1-hour, and 30-minute charts for anchors within ~1.5 years (e.g., April 20, 2024, from August 2025).
Limitations: VWAP accuracy for anchors like April 20, 2024 (~477 days back) is reliable on 1-hour and larger timeframes. Below 30-minute (e.g., 15-minute, 24-minute), VWAPs may start later or be unavailable due to TradingView’s 5,000-bar historical data limit. For distant anchors, use 4-hour or daily charts to ensure accuracy.
Requires sufficient chart history (e.g., premium account or deep exchange data) for older anchors on 1-hour or 30-minute charts.
Usage Notes: Set anchor dates via the indicator settings (e.g., “2024-04-20 00:00”).
Enable/disable individual VWAPs as needed.
Zoom out to load maximum chart history for best results, especially on 1-hour or 30-minute timeframes.
Ideal for crypto symbols with continuous trading data, but verify data availability for other markets.
Disclaimer:
This is a free indicator provided as-is.
VWAP Bands [UAlgo]The "VWAP Bands " indicator is designed to provide traders with valuable insights into market trends and potential support/resistance levels using Volume Weighted Average Price (VWAP) bands. This indicator integrates the core concepts of VWAP with additional trend analysis features, making it a versatile tool for both range trading and trend-following strategies.
The VWAP bands are plotted based on the standard deviation multipliers, creating upper and lower bands around the VWAP. These bands serve as dynamic support and resistance levels. When the price approaches these bands, traders can anticipate potential reversals or continuations of the current trend. Additionally, the indicator provides visual cues for trend strength and potential trend changes, helping traders make informed decisions in various market conditions.
🔶 Settings
Source (Data Source): The data source for VWAP calculations. The default setting is the typical price (HLC3), which is the average of the high, low, and close prices.
Length: The number of bars used in the VWAP calculation. This determines the lookback period for the indicator.
Standard Deviation Multiplier: The multiplier applied to the standard deviation to create the primary upper and lower VWAP bands. This setting controls the distance of the bands from the VWAP.
Secondary Standard Deviation Multiplier: The multiplier applied to the standard deviation to create the secondary upper and lower VWAP bands, providing additional levels of support and resistance.
Display Trend: A toggle to enable or disable the display of the trend analysis feature. When enabled, the indicator highlights trend strength and potential trend changes.
Display Trend Crossovers: A toggle to enable or disable the display of trend crossover signals. When enabled, the indicator plots shapes to indicate where trend switches are likely occurring.
🔶 Calculations
The calculations behind the "VWAP Bands " indicator begin with determining the Volume Weighted Average Price (VWAP), which provides a comprehensive view of the average price of an asset, weighted by trading volume. This gives a more accurate representation of the asset's true average price over a specified period.
The first step in this process involves summing the trading volume over a chosen period, typically represented by the length parameter. Simultaneously, the product of the price (usually an average of the high, low, and close prices) and the trading volume is calculated and summed. By dividing this cumulative price-volume product by the total volume, we obtain the VWAP value. This VWAP serves as the central anchor around which the price action oscillates.
To enhance the utility of VWAP, we introduce standard deviation calculations. Standard deviation measures the extent of price dispersion from the VWAP, providing insight into price volatility. By calculating the variance (which involves the squared deviations of price) and then taking its square root, we derive the standard deviation. This helps in understanding how far prices typically stray from the VWAP.
With the VWAP and standard deviation in hand, we then establish upper and lower bands by adding and subtracting multiples of the standard deviation from the VWAP. These bands act as dynamic support and resistance levels, adapting to changes in market volatility. The primary bands, set by the first standard deviation multiplier, are augmented by secondary bands defined by a larger multiplier, offering additional layers of potential support and resistance.
It also integrates trend analysis, highlighting areas where the price action suggests a strong or weak trend. This is achieved by overlaying colored zones above and below the bands, indicating the strength and direction of the trend. When the price crosses these bands, it signals potential trend changes, aiding traders in making timely decisions.
🔶 Disclaimer
The "VWAP Bands " indicator is provided for educational and informational purposes only. It is not intended as financial advice and should not be construed as such.
Trading involves significant risk and may not be suitable for all investors. Before using this indicator or making any investment decisions, it is important to conduct thorough research and consider your financial situation.

VWAP Divergence | dobofulopOverview :
This script identifies potential bullish and bearish divergence signals using the Volume Weighted Average Price (VWAP). It calculates VWAP resets based on a selected “Anchor Period” (Session, Week, Month, Quarter, Year, Decade, Century, or corporate events like Earnings, Dividends, Splits). When price action and VWAP move in opposite directions with a sufficiently large ATR-based move over a chosen lookback period, the script plots divergence dots on the chart.
Key Features:
VWAP Anchoring : Choose an anchor period for resetting VWAP. This could be daily, weekly, monthly, or based on specific corporate events (Earnings, Dividends, Splits).
Divergence Detection : Looks for instances where the price is moving up while VWAP moves down (potential bullish divergence), and vice versa for bearish divergence.
ATR Filter : Uses the ATR (Average True Range) to filter out minor or insignificant price moves, helping to reduce noise.
Gap Check : Automatically invalidates signals if large price gaps occur within the lookback range.
Visual Signals : Bullish divergences are plotted below the bar, while bearish divergences are plotted above, making it easy to spot potential reversal zones.
How to Us
Inputs:
- Anchor Period (Session, Week, Month, etc.) – determines when the VWAP calculation restarts.
- Source (Default: HLC3) – Price source for the VWAP.
- ATR Multiplier and Lookback Period – Fine-tune the threshold for detecting significant moves vs. VWAP.
Interpretation:
- Bullish Divergence Dot: Suggests potential price strength when price moves higher but VWAP moves lower.
- Bearish Divergence Dot: Suggests potential price weakness when price moves lower but VWAP moves higher.
Disclaimer:
This script is provided for educational purposes only and should not be interpreted as financial advice. Past performance does not guarantee future results. Always conduct your own analysis and consider consulting a financial professional before making trading decisions.

Multi-Day Rolling VWAP [Intraday]Ideas from Brian Shannon's book "Anchored VWAP"
The Multi-Day Rolling VWAP indicator for intraday timeframes allows you to track the Volume Weighted Average Price (VWAP) over multiple days, specifically for 1-day, 2-day, 3-day, 4-day, and 5-day periods. This indicator beyond the standard daily VWAP provides a broader perspective on price trends and market sentiment.
Features:
- Multi-day VWAPs: Analyze VWAP over several days to observe longer-term price movements.
- Customizable display: Choose which VWAP periods to display on the chart
- Colorize: Choose different colors for each VWAP to easily distinguish between periods.
- Adjustable settings: Change the line thickness and select the price source for VWAP calculations.
- Works with Replay Mode
- Works in any intraday timeframe on any asset with volume and price
Benefits:
- Trend identification: Compare current prices with multi-day rolling VWAPs to spot trends.
- Spot reversals: Look for potential price reversals or support when prices cross VWAP lines.
VWAP RangeThe VWAP Range indicator is a highly versatile and innovative tool designed with trading signals for trading the supply and demand within consolidation ranges.
What's a VWAP?
A VWAP (Volume Weighted Average Price) represents an equilibrium point in the market, balancing supply and demand over a specified period. Unlike simple moving averages, VWAP gives more weight to periods with higher volume. This is crucial because large volumes indicate significant trading activity, often by institutional traders, whose actions can reflect deeper market insights or create substantial market movements. The VWAP is also often used as a benchmark to evaluate the efficiency of executed trades. If a trader buys below the VWAP and sells above it, they are generally considered to have transacted favourably.
This is how it works:
Multiple VWAP Anchors:
This indicator uses multiple VWAPs anchored to different optional time periods, such as Daily, Weekly, Monthly, as well as to the highest high a lowest low within those periods. This multiplicity allows for a comprehensive view of the market’s average price based on volume and price, tailored to different trading styles and strategies.
Dynamic and Fixed Periods:
Traders can choose between using dynamic ranges, which reset at the start of each selected period, and specifying a date and time for a particular fixed range to trade. This flexibility is crucial for analyzing price movements within specific ranges or market phases.
Fixed ranges allow VWAPs to be calculated and anchored to a significant market event, the beginning of a consolidation phase or after a major news announcement.
Signal Generation:
The indicator generates buy and sell signals based on the relationship of the price to the VWAPs. It also allows for setting a maximum number of signals in one direction to avoid overtrading or pyramiding. Be sure to wait for the candle close before trading on the signals.
Average Buy/Sell Signal Lines:
Lines can be plotted to display the average buy and sell signal prices. The difference between the lines shows the average profit per trade when trading on the signals in that range. It's a good way to see how profitable a range is on average without backtesting the signals. The lines will also often turn into support and resistance areas, similar to value areas in a volume profile.
Customizable Settings:
Traders have control over various settings, such as the VWAP calculation method and bar color. There are also tooltips for every function.
Hidden Feature:
There's a subtle feature in this indicator: if you have 'Indicator values' turned on in TradingView, you'll see a Sell/Buy Ratio displayed only in the status line. This ratio indicates whether there are more sell signals than buy signals in a range, regardless of the Max Signals setting. A red value above 1 suggests that the market is trending upward, indicating you might want to hold your long positions a bit longer. Conversely, a green value below 1 implies a downward trend.

VWAP and previous VWAP for Support & Resistance for D W MI overhauled my old multi timeframe VWAP script to make the VWAP OC-Check work for all timeframes. Now only one function is used to calculate the 3 preset VWAPs.
Previous VWAPS = the price where the last session closed sometimes work as Support and Resistance.
The OC-Check Mode theory examines if the VWAP from the Open is above or below the VWAP from Close
and if price is above or below normal VWAP (HLC3).
This way we have 4 states:
Red = Strong Downtrend
Orange = Weak Downtrend
Blue = Weak Uptrend
Green = Strong Uptrend
As always it is just a theory - nothing is set in stone regarding any indicator.
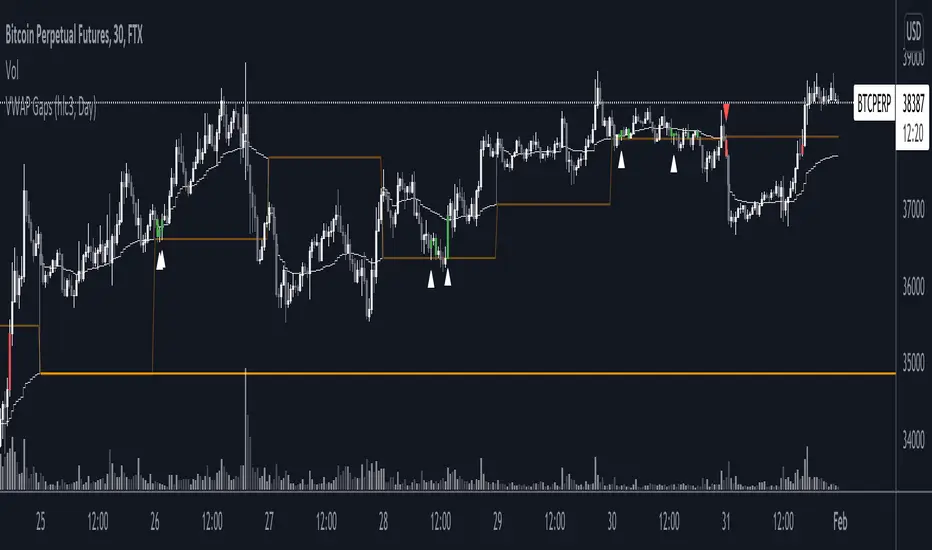
VWAP GapsTheory of untested previous VWAPs acting in similar way to nPOC, where agreed previous 'value' based on volume acts as a liquidity area to be retested.
Indicator shows
- User selected VWAP
- Untested previous VWAPs. The line will disappear once price crosses it's value
- Sweeps of previous VWAPs. Show by both bar colours and plotted arrows under different conditions.
Sweep Filters
1. Bull or Bear Bar (required for an arrow plot)
2. Sweep Conditions i.e. open below line, high above line, and close below line
3. If current VWAP is below/above the previous VWAP value.
[ASFX] Free Automatic VWAPsAutomatic VWAP & Key Levels
Overview
This indicator is designed to help traders evaluate VWAP interactions in context, rather than treating every VWAP touch as a trade opportunity. It combines VWAP with a momentum-based directional filter to highlight situations where price interaction with VWAP is supported by broader intraday momentum. This indicator also shows you the initial balance and opening range each day.
Concept and Originality
VWAP is commonly used as an institutional reference level, but VWAP alone does not distinguish between meaningful acceptance/rejection and random intraday chop. This script addresses that limitation by conditioning VWAP interactions with a momentum filter. Signals are only displayed when price location and momentum alignment occur together, allowing traders to focus on higher-quality VWAP reactions instead of monitoring multiple indicators separately.
How It Works
• VWAP is used as the primary price reference level.
• A momentum filter evaluates directional bias and participation.
• Visual signals appear only when price is interacting with VWAP and momentum confirms acceptance or rejection in the same direction.
• No signals are shown during low-momentum or sideways conditions around VWAP.
How to Use
This indicator is best used as a confirmation tool, not as a standalone trading system. It is intended to assist traders in filtering VWAP-based trade ideas by highlighting when conditions are aligned versus when price is simply chopping around VWAP.
Markets and Timeframes
• Designed for index futures such as ES and NQ
• Optimized for intraday trading
• Works best on lower timeframes (1–5 minute charts)
Limitations
• Not predictive
• Not a complete trading strategy
• Does not replace price action analysis, trade management, or risk control
• Signals should be evaluated alongside market structure and context

VWAP with CharacterizationThis indicator is a visual representation of the VWAP (Volume Weighted Average Price), it calculates the weighted average price based on trading volume. Essentially, it provides a measure of the average price at which an asset has traded during a given period, but with a particular focus on trading volume. In our case, the indicator calculates the VWAP for the current trading symbol, using a predefined simple moving average (SMA) with a period of 14. This volume-weighted moving average offers a clearer view of the behavior of the VWAP and, of consequence of market dynamics.
One of the distinctive features of this indicator is its ability to provide a more "linear" representation of the data. This means that the data is "smoothed" to remove noise, allowing you to more easily identify the direction of the market trend. This smoother representation is especially useful because the financial market can be subject to significant fluctuations and volatility, and this indicator can help get a more stable view of the trend.
The indicator also offers a visualization of the market trend in a very intuitive way. Using an evaluation of the highs and lows of the last 10 days, determine whether the market is in an uptrend, downtrend, or no trend at all. To make this evaluation even clearer and more immediate, the indicator line is colored dynamically. When the trend is bullish, the line is blue, while in case of a bearish trend, it takes on a distinctive color, such as pink. If the trend is not defined, the line will be colored differently, for example light yellow. This coloration gives traders an immediate visual indication of the prevailing trend, allowing them to make more informed decisions regarding trading operations.
One potential strategy involves watching candles when they cross the VWAP line strongly. If, for example, a candlestick breaks above the VWAP line, we may look for retest areas near key support levels to gauge a potential long entry. In other words, we would consider that the price may have the potential to rise further after breaking above the VWAP line, and we would look to enter a long position to take advantage of this opportunity.
On the other hand, if a candlestick crosses below the VWAP line, we might consider looking for retest areas near the VWAP line itself, which now serves as potential resistance. This could indicate a possible short entry opportunity, as the price may struggle to break above the resistance represented by the VWAP line after breaking it down. In this case, we would look to take advantage of the expected continuation of the downtrend.
In both cases, the idea is to exploit significant movements across the VWAP line as signals of potential reversal or continuation of the trend. This strategy can help identify key entry points based on price behavior relative to the VWAP line.

All-In-One Auto Anchored VWAPsA chart isn't trendy without a VWAP (which stands for volume weighted average price).
This indicator allows you to choose 3 different anchored VWAPs, and customize the anchor period from one of many different options, including:
- Daily
- Weekly
- Monthly
- Quarterly
- Yearly
- All Time
- Specific Pivots
- Specific Sessions
You can then choose whether you want to anchor to the open, highest or lowest value within that period.
The indicator will automatically update every time a new anchor point is triggered. Every VWAP has colors and standard deviation bands as an optional setting.
As interest in the script grows I will continue to add new features.
VWAP Trendfollow Strategy [wbburgin]This is an experimental strategy that enters long when the instrument crosses over the upper standard deviation band of a VWAP and enters short when the instrument crosses below the bottom standard deviation band of the VWAP. I have added a trend filter as well, which stops entries that are opposite to the current trend of the VWAP. The trend filter will reduce total false breakouts, thus improving the % profitable while maintaining the overall returns of the strategy. Because this is a trend-following breakout strategy, the % profitable will typically be low but the average % return will be higher. As a rule, be sure to look at the average winning trade % compared to the average losing trade %, and compare that to the % profitable to judge the effectiveness of a strategy. Factor in fees and slippage as well.
This strategy appears to work better with the lower timeframes, and I was impressed with its results. It also appears to work on a wide range of asset classes. There isn't a stop loss or take profit built-in (other than the reversal signals, which close the current trade), so I would encourage you to expand on the strategy based on your own trading parameters.
You can toggle off the bar colors and the trend filter if you so desire.
Future updates to this script (or ideas of improving on it) might include a take profit level set at one standard deviation past the current level and a stop loss level set at one standard deviation closer to the vwap from the current level - or applying a multiple to the two based off of your reward/risk ratio.
About the strategy results below: this is with commissions of 0.5 % per trade.

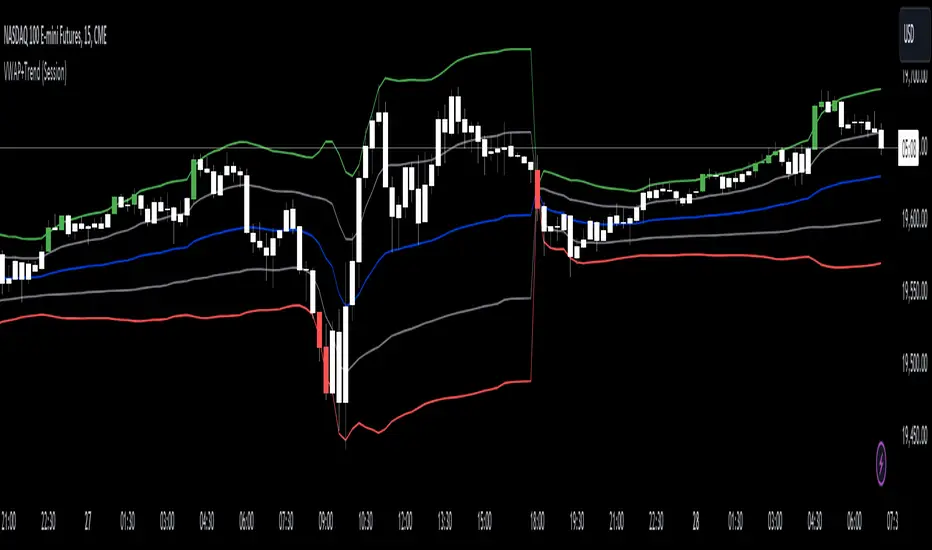
VWAP with Trend Alerts [CrossTrade]The VWAP with Trend Alerts indicator is designed to provide a comprehensive visual and analytical tool for traders using the Volume Weighted Average Price (VWAP) along with additional features like custom bar coloring and trend-based signal alerts.
Key Components and Functionalities:
1. VWAP Calculation: The core of this indicator is the VWAP, which represents the average price of an asset, weighted by volume. It's a popular tool among traders to identify the general direction and strength of a trend, and for assessing entry and exit points.
2. Standard Deviation Bands: Surrounding the VWAP are multiple bands calculated based on standard deviation values. These bands serve as dynamic support and resistance levels. The script allows up to three bands, each with customizable multipliers, giving insights into price volatility and potential breakout or reversal points.
3. Bar Coloring Options:
- Color All Bars: When enabled, all bars on the chart are colored based on whether they close above (green) or below (red) the VWAP.
- Trend Bars Only: This option, when selected, colors only the bars that close beyond the second standard deviation band. It helps in identifying stronger trends and significant market movements.
4. Buy and Sell Signal Conditions: The script includes conditions for buy and sell signals specifically tailored for trend bars. A buy signal is generated when a bar closes above both the VWAP and the upper second standard deviation band, indicating a potential strong uptrend. Conversely, a sell signal is triggered when a bar closes below both the VWAP and the lower second standard deviation band, suggesting a strong downtrend.
5. Alert Conditions: To aid in timely decision-making, the script features alert conditions corresponding to the buy and sell signals.
Usage and Application:
- For Trend Identification: The VWAP and its bands can help identify the prevailing market trend. Bars closing consistently above the VWAP suggest an uptrend, while those closing below indicate a downtrend.
- Volatility Assessment: The standard deviation bands provide a visual representation of market volatility. Narrower bands suggest low volatility, while wider bands indicate high volatility.
- Signal Alerts for Trading: The buy and sell signals, especially those filtered by the trend bars condition, can be valuable for traders looking for strong movement confirmations.
Flexibility and Customization:
This indicator is highly customizable and builds off of the core logic found in standard VWAP indicators. By allowing traders to adjust the standard deviation multipliers and choose their preferred bar coloring strategy. It caters to various trading styles, whether focusing on the broader market trend or pinpointing significant trend-based movements.
VWAP Volume Profile [BigBeluga]🔵 OVERVIEW
VWAP Volume Profile is an advanced hybrid of the VWAP and volume profile concepts. It visualizes how volume accumulates relative to VWAP movement—separating rising (+VWAP) and declining (−VWAP) activity into two mirrored horizontal profiles. It highlights the dominant price bins (POCs) where volume peaked during each directional phase, helping traders spot hidden accumulation or distribution zones.
🔵 CONCEPTS
VWAP-Driven Profiling: Unlike standard volume profiles, this tool segments volume based on VWAP movement—accumulating positive or negative volume depending on VWAP slope.
Dual-Sided Profiles: Profiles expand horizontally to the right of price. Separate bins show rising (+) and falling (−) VWAP volume.
Bin Logic: Volume is accumulated into defined horizontal bins based on VWAP’s position relative to price ranges.
Gradient Coloring: Volume bars are colored with a dynamic gradient to emphasize intensity and direction.
POC Highlighting: The highest-volume bin in each profile type (+/-) is marked with a transparent box and label.
Contextual VWAP Line: VWAP is plotted and dynamically colored (green = rising, orange = falling) for instant trend context.
Candle Overlay: Price candles are recolored to match the VWAP slope for full visual integration.
🔵 FEATURES
Dual-sided horizontal volume profiles based on VWAP slope.
Supports rising VWAP , falling VWAP , or both simultaneously.
Customizable number of bins and lookback period.
Dynamically colored VWAP line to show rising/falling bias.
POC detection and labeling with volume values for +VWAP and −VWAP.
Candlesticks are recolored to match VWAP bias for intuitive momentum tracking.
Optional background boxes with customizable styling.
Adaptive volume scaling to normalize bar length across markets.
🔵 HOW TO USE
Use POC zones to identify high-volume consolidation areas and potential support/resistance levels.
Watch for shifts in VWAP direction and observe how volume builds differently during uptrends and downtrends.
Use the gradient profile shape to detect accumulation (widening volume below price) or distribution (above price).
Use candle coloring for real-time confirmation of VWAP bias.
Adjust the profile period or bin count to fit your trading style (e.g., intraday scalping or swing trading).
🔵 CONCLUSION
VWAP Volume Profile merges two essential concepts—volume and VWAP—into a single, high-precision tool. By visualizing how volume behaves in relation to VWAP movement, it uncovers hidden dynamics often missed by traditional profiles. Perfect for intraday and swing traders who want a more nuanced read on market structure, trend strength, and volume flow.

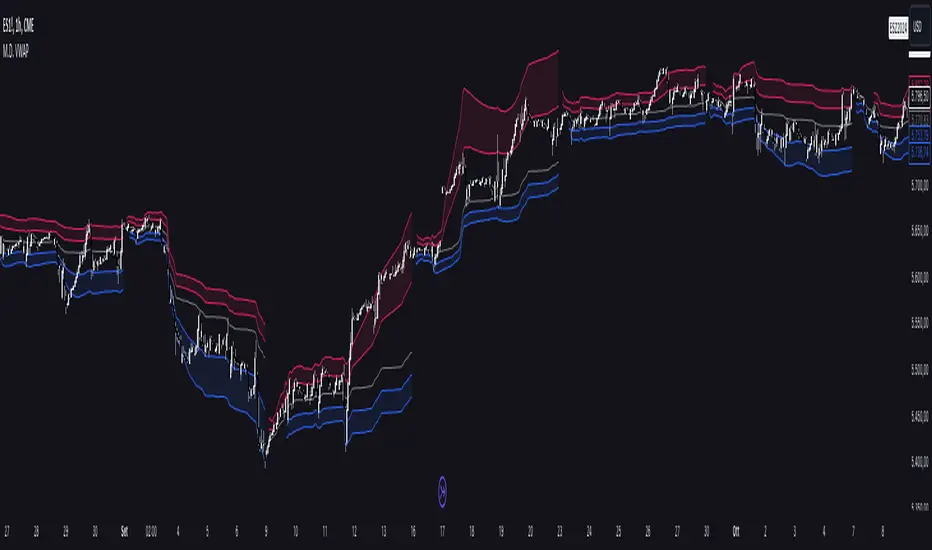
Multi Deviation VWAP [OmegaTools]The Multi Deviation VWAP is an original variation of the traditional VWAP indicator, designed to enhance your trading experience by providing more precise market insights. While the conventional VWAP calculates a single price level based on volume and price over a given period, the Multi Deviation VWAP goes a step further by introducing dynamic upper and lower bands that adapt to market conditions. These bands give traders a more comprehensive understanding of volatility and price action, making it an ideal tool for various trading strategies, especially for identifying potential price reversals or trend continuations.
Key Features:
Separate Calculation of Deviation Bands:
Unlike traditional VWAP bands, where both the upper and lower bands are symmetrically calculated using a single deviation value, the Multi Deviation VWAP calculates the deviations independently for the upper and lower bands. This allows for a more accurate reflection of market dynamics.
The upper deviation band is based on the average distance of closing prices above the VWAP, while the lower deviation band considers the average distance of closing prices below the VWAP.
This separation provides a more tailored approach, adapting to whether the market is showing bullish or bearish momentum, as opposed to a fixed, equal deviation in both directions.
Internal and External Bands:
Two sets of deviation bands are plotted: Internal Bands and External Bands, controlled by user inputs (factorone for internal and factortwo for external). These bands offer multiple levels of support and resistance based on market volatility.
The Internal Bands are closer to the VWAP and act as the first level of support/resistance, suitable for short-term or tighter trading ranges.
The External Bands are further from the VWAP and capture more significant market swings, useful for identifying larger trends or setting wider stop-losses.
Timeframe Flexibility:
The indicator allows traders to select the desired timeframe (1D by default) over which the VWAP and its deviation bands are calculated. This flexibility enables users to adapt the indicator to different trading styles, from intraday scalping to longer-term trend analysis.
Visual Enhancements:
Bullish and Bearish Colors: The bands are color-coded for quick visual interpretation. Bullish bands (lower deviations) are colored blue, while bearish bands (upper deviations) are colored red, making it easy to differentiate between market conditions at a glance.
Plot Fill: The area between the internal and external bands is shaded, providing clear visual zones of potential price containment, aiding in understanding the market structure and anticipating price movements.
How It Differs from a Standard VWAP:
Traditional VWAP provides a single price line that represents the volume-weighted average price over a given period, often used to identify general price trends.
In contrast, the Multi Deviation VWAP introduces upper and lower bands calculated separately based on price deviations above and below the VWAP, giving a more nuanced view of market volatility.
Symmetrical bands in traditional VWAP may not always accurately reflect the market's true behavior, especially in trending markets, where upward and downward price movements aren't always equal. By splitting the deviation calculations, this tool provides a more dynamic and realistic view of price action, adapting to whether the market is showing stronger upward or downward pressure.
Use Cases:
Trend Identification: The VWAP line acts as a central trend line, while the deviation bands offer levels of potential support and resistance. When price moves beyond the external bands, it may indicate overextension and potential reversal.
Volatility Trading: Traders can use the internal and external bands to set dynamic take-profit or stop-loss levels, allowing for flexible risk management depending on market conditions.
Range Trading: In consolidating markets, the Multi Deviation VWAP can help traders identify optimal buy and sell zones as the price oscillates between the upper and lower bands.
By incorporating independent deviation bands, this indicator provides traders with a more responsive tool that reflects market behavior more accurately, helping them make informed trading decisions with enhanced precision.
Anchored VWAP Hand-OffBrian Shannon's "VWAP hand off" strategy, Has been my "go to" for some time now. Version 5 makes this much easier, with drag and drop placement.
When price taps the base anchored VWAP, a second VWAP is plotted at that point. When price taps the second, a third is plotted, and so on.
Each consecutive VWAP can be used to identify trend and future pivot points as trend continues.
IF the VWAPS look messy, price action is choppy and a trend hasnt yet started.
Multi-Day VWAP V2Updated from V1.
Chart the multi-day Volume Weighted Average Price ( VWAP ). Normally, the VWAP is tracked for the current day, from the first bar of the day (regular or extended session). The VWAP shows the current value of:
-> sum(hlc3 * volume , barsForDay) / sum( volume , barsForDay),
-> where 'barsForDay' is the total number bars that have elapsed during the day for the chart interval.
The multi-day version tracks the VWAP for N days back, by averaging the previous N - 1 day bars VWAP and the current VWAP for the current bar (chart interval).
This is very different that simply using a volume weighted moving average , since the closing VWAP values are used for the historical day bars. The results are interesting for intraday trades... especially for values of 1, 2, 3, 4, and 5 days.
Version 2 includes the closing VWAP for the previous day. There are enough instances where the price chooses to bounce from the previous day's closing VWAP value that it is worth discussing. Usually this value is at or near the daily pivot, but sometimes not. Circled in the chart are some areas of recent SPY bounces on the previous day's closing VWAP.
It seems that when the 5-Day VWAP and normal VWAP have "enough" percentage separation, that there can be good intraday swing opportunities using bounces off VWAP indicators. This is similar to waiting for Hourly/Daily/Weekly/Monthly/etc pivots to have "enough" separation to allow for swing setups. When pivots are "closely" spaced, odds are the price is range bound for the time period (daily range in the case of day pivots, etc).
Previous closing VWAPs can be plotted for all 5 of the original. As with my other scripts, I welcome all comments to spark new ideas that we can all benefit from.
Enjoy.

VWAP Fibonacci Bands (Zeiierman)█ Overview
The VWAP Fibonacci Bands is a sophisticated yet user-friendly indicator designed to assist traders in visualizing market trends, volatility, and potential support/resistance levels. Developed by Zeiierman, this tool integrates the MIDAS (Market Interpretation Data Analysis System) methodology with Standard Deviation Bands and user-defined Fibonacci levels to provide a comprehensive market analysis framework.
This indicator is built for traders who want a dynamic and customizable approach to understanding market movements, offering features that adapt to varying market conditions. Whether you're a scalper, swing trader, or long-term investor.
█ How It Works
⚪ Anchor Point System
The indicator begins its calculations based on an anchor point, which can be set to:
A specific date for historical analysis or alignment with significant market events.
A timeframe-based reset, dynamically restarting calculations at the beginning of each selected period (e.g., daily, weekly, or monthly).
This dual-anchor method ensures flexibility, allowing the indicator to align with various trading strategies.
⚪ MIDAS Calculation
The MIDAS calculation is central to this indicator. It uses cumulative price and volume data to compute a volume-weighted average price (VWAP), offering a trendline that reflects the true value weighted by trading activity.
⚪ Standard Deviation Bands
The upper and lower bands are calculated using the standard deviation of price movements around the MIDAS line.
⚪ Fibonacci Levels
User-defined Fibonacci ratios are used to plot additional support and resistance levels between the bands. These levels provide visual cues for potential price reversals or trend continuations.
█ How to Use
⚪ Trend Identification
Uptrend: The price remains above the MIDAS line.
Downtrend: The price stays below the MIDAS line and aligns with the lower bands.
⚪ Support and Resistance
The upper and lower bands act as support and resistance levels.
Fibonacci levels provide intermediate zones for potential price reversals.
⚪ Volatility Analysis
Wider bands indicate periods of high volatility.
Narrower bands suggest low-volatility conditions, often preceding breakouts.
⚪ Overbought/Oversold Conditions
Look for the price beyond the upper or lower bands to identify extreme conditions.
█ Settings
Set Anchor Method
Anchor Method: Choose between Timeframe or Date to define the starting point of calculations.
Anchor Timeframe: For Timeframe mode, specify the interval (e.g., Daily, Weekly).
Anchor Date: For Date mode, set the exact starting date for historical alignment.
Set Std Dev Multiplier
Controls the width of the bands:
Higher values widen the bands, filtering out minor fluctuations.
Lower values tighten the bands for more responsive analysis.
Set Fibonacci Levels
Define custom Fibonacci ratios (e.g., 0.236, 0.382) to plot intermediate levels between the bands.
█ Tips for Fine-Tuning
⚪ For Trend Trading:
Use higher Std Dev Multipliers to focus on long-term trends and avoid noise. Adjust Anchor Timeframe to Weekly or Monthly for broader trend analysis.
⚪ For Reversal Trading:
Tighten the bands with a lower Std Dev Multiplier.
Use shorter anchor timeframes for intraday reversals (e.g., Hourly).
⚪ For Volatile Markets:
Increase the Std Dev Multiplier to accommodate wider price swings.
⚪ For Quiet Markets:
Decrease the Std Dev Multiplier to highlight smaller fluctuations.
-----------------
Disclaimer
The information contained in my Scripts/Indicators/Ideas/Algos/Systems does not constitute financial advice or a solicitation to buy or sell any securities of any type. I will not accept liability for any loss or damage, including without limitation any loss of profit, which may arise directly or indirectly from the use of or reliance on such information.
All investments involve risk, and the past performance of a security, industry, sector, market, financial product, trading strategy, backtest, or individual's trading does not guarantee future results or returns. Investors are fully responsible for any investment decisions they make. Such decisions should be based solely on an evaluation of their financial circumstances, investment objectives, risk tolerance, and liquidity needs.
My Scripts/Indicators/Ideas/Algos/Systems are only for educational purposes!

VWAP Band TrendThis indicator combines two features: VWAP bands for range trading and trends for trend-following.
The white bands offer support/resistance levels ideal for range trading: short when rejecting off the upper band, long when rejecting off the lower. Take profit either when hitting the (faint gray) midline and/or when hitting the band on the far side.
The trend analysis shows green or red ranges above or below the bands to indicate trend strength - larger swaths of green or red indicates strong trend while shorter swathes indicate weak. If the upper trend color doesn't match the lower trend color, the trend is undecided or transitioning.
Optionally, trend initiation indicators can be turned on to show above/below candles where a trend switch is taking place.