Trend MasterThis is a trend aggregator for confirmation and trend signals. It basically aggregates many buy/sell signals and confirmation and by combining them provides a strong buy/sell signal or trend confirmation.
The actual layout idea and trend confirmation is derived from Trend Meter and this indicator uses few other indicator, such as Chandelier Exit, WaveTrend, QQE Signals, Parabolic SAR and AlphaTrend. This indicator aggregates signal from different methods to find out more powerful and confirmed Trend and combines them into one Signal. It also uses Technical Ratings from TradingView team to filter out false signal, it tremendously opts out false signals and improve profitability.
The first seven dots are these
All 3 Trend Meters Now Align
MACD Crossover - Fast - 8, 21, 5
RSI 13: > or < 50
RSI 5: > or < 50
MA Crossover
MA Crossover
Chaikin Money Flow
Alphatrend
Technical Ratings
Then trend
Chandelier Exit
WaveTrend
QQE Signals
Parabolic Sar
All 3 Trend Meters aligns and A signal from trend i
Instructions
Change buy/sell policy based on market trend
Works on all TimeFrame but gives more accuracy on 4H, 1D.
Buy when green big dot appears at the bottom.
Sell when red big dot appears at the bottom.
Red/green dot at the top line appears when three trend meter is aligned and this is a good confirmation.
Any red/green dot below horizontal bars are trend signals.
Big red/green got at the bottom appears whenever there's a good confirmation from trend meter and a buy/sell signal comes from any trend signals.
Also look on the technical ratings bar, green means buy, red means sell and yellow means neutral.
Look for Support or Resistance Levels for price to be attracted to.
Find confluence with other indicators.
The more Trend meters are lit up the better.
Alert
01 Buy Signal = Strong Buy Signal
02 Sell Signal = Strong Sell Signal
03 Buy Signal = Strong Buy Signal
04 Sell Signal = Strong Sell Signal
Thanks to TradingView Technical Ratings authors, evergot, Lij_MC, KivancOzbilgic for their work. This indicator was heavily inspired from their work.
Cerca negli script per "wave"

OJLJ Elliott Waves detector (Free)This script is made to identify Elliot Waves by setting a zigzag line as principal source, it identifies patterns with the most common rules, in the chart you will see a number in each wave detected, a wave could have the characteristics to be two different waves so it will be plotted the options that could be, To identify which one is most trustable I suggest to use the Fibonacci levels options as an additional note this is a free update to my existing script.
Features:
+ All waves ? (Option to show just the 5 Wave patterns recognition)
+ Draw zigzag line (Option to show the zigzag line)
+ Supports Multiple instruments, from FOREX to Stocks
+ It works on all the timeframes
+ Show Fib levels (Option to show the Fibonacci levels)
+ Fibonacci levels fit test (Green crosses mark were should a Bull wave be to fit with a Fibonacci Level While the purple crosses show were should the wave fit to be a bear trend, the more closer with the point of the wave the most trustable Example, a 5 Wave Bull could also be a 2 Bear Wave, if the green cross is closer to the orange point of the wave then is a 5 Wave Bull, if the purple cross is closer to the orange point)
+ A background color also show when a 5 pattern is identified
+ The way to plot the zigzag can be changed with 3 Input options
Characteristics to add in future updates (Please if you like it you can support me with coins):
+ Detect more than 1 cycle at the same time
+ Use a volume indicator to identify how many volume was traded in each wave
+ Implement the use of the EWO ( Elliot Wave Oscillator)
+ Improve the display
+ Identify ABC patterns
+ Add triangles and Zigzag formations
Binary ComboThis script combines Stochastic Divergence and WaveTrend Crosses.
Stochastic Divergence may be useful for seeing a shift in momentum before the price action reflects it.
WaveTrend gives us context to the short term trend.
You can combine these together to find good entries.

Elliot Wave - ImpulseLets dabble a bit into Elliot Waves.
This is a simple script which tries to identify Wave 1 and 2 of Elliot Impulese Wave and then projects for Wave 3.
Ratios are taken from below link: elliottwave-forecast.com - Section 3.1 Impulse
Wave 2 is 50%, 61.8%, 76.4%, or 85.4% of wave 1 - used for identifying the pattern.
Wave 3 is 161.8%, 200%, 261.8%, or 323.6% of wave 1-2 - used for setting the targets
Important input parameters
Length : Zigzag Length. Keep the numbers low if you are looking for smaller and shorter trades. Keep the numbers high if you are looking for longer and bigger trades.
Error Percent : Adjustments for ratios as it is not always possible to find exactly equal retracement ratio.
Entry Percent : Once Wave 2 is formed, entry is set after reversing 30% of wave 2. This number can be increased or decreased. Caution: Keeping the number too low may result in false signals.
Ignore Trend Direction : If unchecked, it will only look for pattern if Wave 1 has made a higher high. If not, it will ignore Wave 1 condition and only look at wave 1 to 2 ratio.
Handle Duplicates : Since, the labels are generated upon crossover of entry price, this crossover may happen multiple times. Or sometimes wave 2 can further extend and generate new signal with same wave 1. This parameter says how to handle such cases. Keep Last is set to default and is most preferred option.
ShowRatios and ShowWaves lets you display wave line and retracement ratios for each pivots
MarketVision BWith Special Thanks to Everyone who has gone before me, and who have both allowed me given me permission to bring my version of Market Cipher to the World
Especially LazyBear for his amazing Wave Trend Oscillator and for Aevir, falconCoin, vumanchu, Crypto_Spike and others who have freely brought MarketCipher to the Tradingview Community
Also special mention to RicardoSantos for his Divergence script
MarketVision B - My take on MarketCipher B / Market Cipher B, Ive just put outlines on the Wave Trend to add to the Visual Appeal and Added a Trend Meter and a few more options for the Oscillators
Nice To Look At
Oscillator 1 Choose Between - RSI, MFI and Ultimate Oscillator
For Stochastics Choose Between Standard and RSI Stochastics and for the source you can choose On Balance Volume
Wave Trend
Money Flow
Trend Meter & Signals Bar
Divergences are marked, However they are easy to spot and it is better to train your eyes to spot them before the indicator marks them out
Lots of Alerts and Loads of ways to trade using MarketVision
PS: You can make this look like the original by adjusting the parameters in the menu

Ichimoku EMA WaveThis script combines a customizable Ichimoku Cloud/ EMA combination to provide a quick trend visualisation.
For example, long entries can be found when the green EMA wave rises above the Ichimoku cloud.
Combine it with some oscillators (like MACD) for good results.
Also, experimenting with a different "wavelength" (default 50) and/or EMA length (default10) for different securities is a good idea.
Script is free to use and to modify at ones liking.
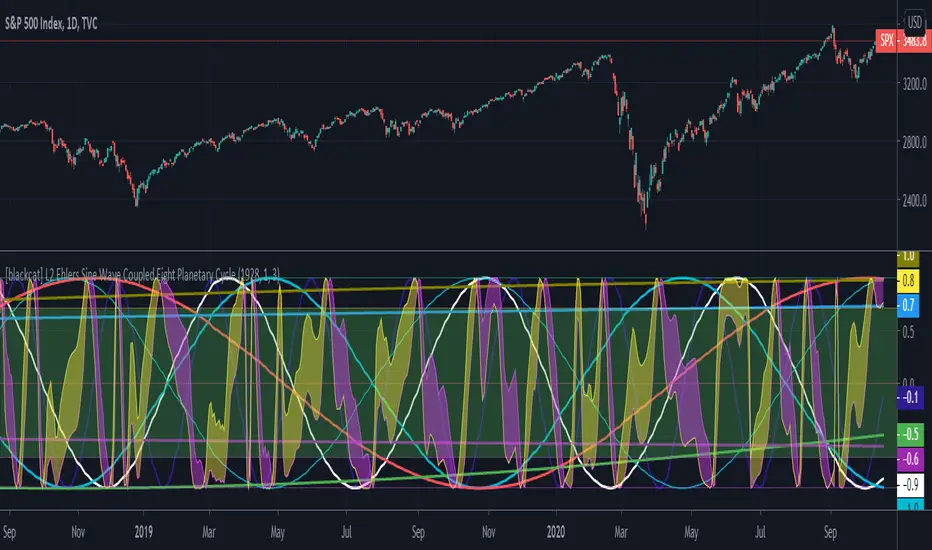
[blackcat] L2 Ehlers Sine Wave Coupled Eight Planetary CycleLevel: 2
Background
Have you considered that factors outside the Earth will be related to macro market trends? Let’s discuss the relationship between the planetary movement in the Galaxy and the market movement on Earth today! Although I said that, you may have laughed out in front of the screen, but the calculations in this script are entirely based on astronomical data and mathematical relationships.
Your next question may be why you compare the movements of the eight planets and the laws of the market on the earth together? My answer comes from a Cybernetic Sine Wave indicator proposed by Dr. John F. Ehlers.
Function
L2 Ehlers Sine Wave Coupled Eight Planetary Cycle first converts the astronomical data of the eight major planets into planetary aspects/phases through mathematical relationships. Planetary aspects/phases can provide the historical and current relative positions of each planet in the mathematical triangle relationship. We can use a simple mathematical sine formula to constrain the planet's trajectory between -1 and 1, which is what we often call a sine wave.
The relationship between the sine wave and the market can be extracted from the theory of John F. Ehlers. In Ehlers' theory, market price can be modeled by the trend and cycle modes. And in his works, there are many indicators of how to completely remove the trend in the market price and only leave the cycle mode data. The Cybernetic Sine Wave indicator is exactly the cycle mode data after the market trend is stripped, and expressed in the form of a sine wave.
If you can read to here with patience, you must also be aware of the premise that the trajectories of the eight planets and the laws of the earth market can be coupled: the trajectory of the sine wave mode. Therefore, this indicator is a tool for comparing and analyzing the two in the same chart. I hope you like it.
Finally, in order to benchmark the trajectories of the eight planets and the specific market on the earth, a starting point in time is particularly important. This is the base date of the market index to be analyzed. It is the year, month, and day data specified by the index, which needs to be input by the user when analyzing a specific stock index. For example, the base date of the S&P 500 index is January 3, 1928. This date needs to be entered into the indicator to analyze the SPX500.
Key Signal
Mercury_trail ---> smoothed Mercury orbit sine wave
Venus_trail ---> smoothed Venus orbit sine wave
Earth_trail ---> smoothed Earth orbit sine wave
Earth_mirror ---> smoothed Earth mirrored orbit sine wave
Mars_trail ---> smoothed Mars orbit sine wave
Jupiter_trail ---> smoothed Jupiter orbit sine wave
Saturn_trail ---> smoothed Saturn orbit sine wave
Uranus_trail ---> smoothed Uranus orbit sine wave
Neptune_trail ---> smoothed Neptune orbit sine wave
Aspect 0, 45, 90, 225, 270 deg ---> key planet aspects
ehlersine ---> Ehlers Cybernetic Sine Wave
ehlerslsine ---> Ehlers Cybernetic Lead Sine Wave
Pros and Cons
This is a technical indicator that I have come up with on a whim, and the laws of planetary operation and the operation of the Earth market are still being explored. Hope that interested friends will share your new discoveries.
Remarks
To celebrate I released the 50th technical indicator script on TV!
Courtesy of @sal157011 John Ehlers "Cybernetic Sine Wave" indicator, I converted it from pine v2 to pine v4 in this script.
Readme
In real life, I am a prolific inventor. I have successfully applied for more than 60 international and regional patents in the past 12 years. But in the past two years or so, I have tried to transfer my creativity to the development of trading strategies. Tradingview is the ideal platform for me. I am selecting and contributing some of the hundreds of scripts to publish in Tradingview community. Welcome everyone to interact with me to discuss these interesting pine scripts.
The scripts posted are categorized into 5 levels according to my efforts or manhours put into these works.
Level 1 : interesting script snippets or distinctive improvement from classic indicators or strategy. Level 1 scripts can usually appear in more complex indicators as a function module or element.
Level 2 : composite indicator/strategy. By selecting or combining several independent or dependent functions or sub indicators in proper way, the composite script exhibits a resonance phenomenon which can filter out noise or fake trading signal to enhance trading confidence level.
Level 3 : comprehensive indicator/strategy. They are simple trading systems based on my strategies. They are commonly containing several or all of entry signal, close signal, stop loss, take profit, re-entry, risk management, and position sizing techniques. Even some interesting fundamental and mass psychological aspects are incorporated.
Level 4 : script snippets or functions that do not disclose source code. Interesting element that can reveal market laws and work as raw material for indicators and strategies. If you find Level 1~2 scripts are helpful, Level 4 is a private version that took me far more efforts to develop.
Level 5 : indicator/strategy that do not disclose source code. private version of Level 3 script with my accumulated script processing skills or a large number of custom functions. I had a private function library built in past two years. Level 5 scripts use many of them to achieve private trading strategy.
Multi momentum indicatorScript contains couple momentum oscillators all in one pane
List of indicators:
RSI
Stochastic RSI
MACD
CCI
WaveTrend by LazyBear
MFI
Default active indicators are RSI and Stochastic RSI
Other indicators are disabled by default
RSI, StochRSI and MFI are modified to be bounded to range from 100 to -100. That's why overbought is 40 and 60 instead 70 and 80 while oversold -40 and -60 instead 30 and 20.
MACD and CCI as they are not bounded to 100 or 200 range, they are limited to 100 - -100 by default when activated (extras are simply hidden) but there is an option to show full indicator.
In settings there are couple more options like show crosses or show only histogram.
Default source for all indicators is close (except WaveTrend and MFI which use hlc3) and it could be changed but for all indicators.
There is an option for 2nd RSI which can be set for any timeframe and background calculated by Fibonacci levels.

BreakingDawn [JackTz]Designed for 4 hour charts - No repaint.
BreakingDawn tries to anticipate the trend change before the actual break from one trend to another. This is an extenstion to WaveTrend from LazyBear.
Cudos to LazyBear for his awesome WaveTrend script!
//Jack

Multiple WaveTrend with Ribbons [CryptoFarian]This is based on LazyBear's WaveTrend Oscillator . I get the idea from klov's Kite Crossing Oscillator which adds support for multiple time frames and what I have done here is to add support for Heikin Ashi candles, ribbons and mark bars for long/short opportunities.
Moving Average Structure ZigZag [Stable & Filtered]
(日本語説明)
このインジケーターは、移動平均線(MA)の転換に基づき、相場の「真の構造」を可視化するために開発されました。 通常のZigZagのように価格の単純な反転に依存せず、「MAのトレンド転換 + 指定した値幅の到達」という2つの条件を用いることで、レンジ相場の細かなノイズ(ダマシ)を排除し、ダウ理論に基づいた重要な高値・安値だけを結びます。
💡 主な機能
MAタイプの切り替え: SMA, EMA, HMA, VW-HMAなど、目的に合わせたトレンド感度を選択可能。
値幅フィルター(Min Deviation): 添付画像のように、小さな値動きをカットし、大きな市場構造だけを抽出します。
価格アクションへの追従: ラインはMAの数値ではなく、期間内の実最高値・最安値を正確に結び、高値更新時には自動で延伸されます。
🛠 活用シーン
環境認識: 上位足での大きな波形を確認し、現在のフェーズを定義。
ノイズ除去: 市場の主要な節目(レジサポ候補)の特定。
ダウ理論の視覚化: 高値・安値の切り上がり・切り下がりを明確化。
(English Description)
This indicator was developed to visualize the "True Market Structure" based on Moving Average (MA) reversals. Unlike standard ZigZag which relies solely on price reversals, this tool combines MA Trend Reversals and a Minimum Deviation filter to eliminate market noise and highlight significant swing highs and lows based on Dow Theory.
💡 Key Features
Multiple MA Types: Select from SMA, EMA, HMA, VW-HMA, etc., to match your preferred trend sensitivity.
Min Deviation Filter: As shown in the attached image, it filters out minor price fluctuations to extract only the major market waves.
Price Action Tracking: The lines connect the actual High/Low prices within the period, not the MA values themselves. Lines automatically extend when a trend continues to new highs/lows.
🛠 Use Cases
Market Context: Identify major wave patterns on higher timeframes to define the current phase.
Noise Reduction: Pinpoint key market levels and potential support/resistance.
Dow Theory Visualization: Clearly visualize higher highs/lows and trend shifts.
Settings
MA Type: Choose the type of Moving Average.
Moving Average Length: The lookback period for structure.
Min Deviation (Pips): The threshold to filter noise. Adjust according to the volatility of the pair.

LL-HL PivotThis indicator scans for the bullish structure known as a Higher Low (HL) across multiple lengths simultaneously, automatically selects the most suitable pattern, and plots it on the chart.
Below is a detailed explanation of how it works.
1. Basic Calculation Method (Definition of LL and HL)
This indicator is built on TradingView’s ta.pivotlow function.
Detecting Pivot Lows
For a given length, a Pivot Low is identified as the lowest point among the candles within the specified range to the left and right.
LL and HL Determination
LL (Lowest Low): The most recent Pivot Low is treated as the previous low.
HL (Higher Low): When a new Pivot Low forms above the previous LL, it is recognized as an HL, and the setup is considered “complete.”
Identifying the Pivot Line
During the LL–HL structure, the highest high between them is identified and used as the breakout level (Pivot Line / resistance), where a horizontal line is drawn.
2. Multi-Length Scanning
Unlike standard indicators that use only one length (e.g., Length = 5), this indicator evaluates a full range of lengths.
Min Length to Max Length
Example: Min = 2, Max = 10
Internally, it functions as if nine separate indicators (Length 2, 3, 4 … 10) are running simultaneously.
This allows the indicator to capture:
Small waves (short-term pullbacks)
Larger waves (broader structural moves)
3. Priority Mode System
Because multiple lengths are calculated at the same time, different LL–HL patterns may appear simultaneously.Priority Mode determines which setup is selected and displayed.
A. Lowest LH
Selects the pattern with the lowest pivot line (intermediate high).
Advantages:
Produces the lowest possible entry price
B. Longest Length
Selects the pattern with the longest length.
Advantages:
Focuses on larger structures and broader waves
Filters out noise
C. Shortest Length
Selects the pattern with the shortest length.
Advantages:
Reacts quickly to small moves
Useful for scalping or fast trend-following
Captures very short-term pullbacks
4. Additional Behavior and Features
Real-Time Invalidation
If price breaks below the confirmed HL, the structure is immediately considered invalid.
All previously drawn lines and labels are removed instantly, preventing outdated structures from remaining on the chart.
Pivot Line Extension
As long as the HL remains intact, the Pivot Line (breakout level) continues extending to the right.
Alerts
An alert can be triggered the moment price breaks above the Pivot Line on a closing basis.

ECG PRICE - mauricioofsousa📉 ECG PRICE – The Price Electrocardiogram
(explained for traders, scientists, and complete beginners)
🔍 1. WHAT IS THE ECG PRICE?
The ECG PRICE protocol is a market-reading system based on the RSI, but with a surgical twist:
👉 You don’t just calculate RSI from price.
👉 You adjust the price using the RSI, and then calculate RSI over this adjusted price.
This creates a filtered, amplified signal that behaves like a heart monitor for price, detecting micro-impulses and subtle market movements long before they show up in the standard RSI.
🧬 2. CORE IDEA
Just like a real ECG amplifies and reveals electrical rhythms hidden inside the heartbeat,
the ECG PRICE amplifies micro-deformations hidden inside the price’s momentum.
It works in three stages:
Compute the regular RSI
Use the RSI to adjust the price (creating an electrocardiographic price)
Compute a second RSI over this modified price
The result is a meta-derived oscillator—more sensitive, more precise, and better at detecting structural changes.
🧩 3. TECHNICAL BREAKDOWN
3.1. First RSI (classic)
The script calculates:
average gains
average losses
relative strength (RS)
and then the standard 0–100 RSI
This is the “normal heart rate monitor” everyone uses.
3.2. Creating the “Adjusted Price”
adjustedPrice = close * (rsi / 100)
This means:
➡️ When RSI is high (strong buying momentum), price is amplified.
➡️ When RSI is low (strong selling momentum), price is compressed.
This converts raw price into a bio-electrical signal, where the price itself is modulated by its own internal momentum.
It’s the financial equivalent of ECG gain adjustment.
3.3. RSI of the Adjusted Price
Now the script calculates a new RSI from this modified price.
That is the actual ECG PRICE.
This second-order oscillator becomes extremely sensitive to:
micro-momentum shifts
early trend fading
volatility shocks
micro-divergences
institutional pressure waves
It reads the electrical pattern behind the price rather than the superficial movement.
🟩🟥 4. Diagnostic Lines of the Protocol
35 (green dotted)
Pre-oversold fatigue zone.
65 (red dotted)
Pre-overbought exhaustion zone.
30 (white solid)
Classic oversold.
70 (white solid)
Classic overbought.
Together they create two diagnostic corridors:
1. Medical corridor (30–70):
Standard RSI clinical range.
2. Electrical corridor (35–65):
The ECG-sensitive zone where micro-shifts appear first.
🧠 5. In Engineering Language (MGO style)
The ECG PRICE is essentially:
A nonlinear second-order oscillator where the RSI feeds back into price, creating a recursive momentum-modulated signal.
It functions like a:
bioinformational modulator
feedback-driven wave processor
impulse amplifier
micro-PID sensitivity enhancer
Very similar to the informational-wave transformations inside the MGO pipeline.
👨⚕️📉 6. Explained for a Total Beginner
Imagine the price is a heart.
The normal RSI shows if the heart is beating fast or slow.
But the ECG PRICE takes that heartbeat…
feeds it back into the heart…
and then measures the new heartbeat.
This creates a much more sensitive exam that detects problems before the normal test would.
💡 7. What It Gives You in Practice
earlier reversal signals
better trend-fatigue detection
clearer micro-divergences
a clean RSI with reduced noise
a smoother momentum curve
advanced behavioral readings before breakouts
It’s an upgrade.
A second-layer RSI that “hears” the inner electrical impulses of price.

Elliott Wave Expert AdvisorElliott Wave Expert Advisor - Professional Wave Analysis Tool
OVERVIEW
--------
The Elliott Wave Expert Advisor is a comprehensive Pine Script indicator designed for TradingView that automates Elliott Wave analysis and generates high-probability trading signals. Built on Ralph Nelson Elliott's Wave Principle, this indicator identifies impulse wave patterns, validates them against strict Elliott Wave rules, and provides precise entry points with calculated risk management levels.
CORE FUNCTIONALITY
------------------
1. TREND DETECTION
- Dual Moving Average system (Fast/Slow MA)
- MACD confirmation for trend strength
- Automatic trend classification (Uptrend/Downtrend/Sideways)
- Only generates signals aligned with main trend
2. SWING POINT DETECTION
- Automatic pivot high/low identification
- Configurable sensitivity (lookback periods)
- Minimum swing size filtering to reduce noise
- ZigZag visualization connecting swing points
3. WAVE IDENTIFICATION
- 5-wave impulse pattern recognition (1-2-3-4-5)
- 3-wave corrective pattern detection (A-B-C)
- Wave labels displayed on chart
- Color-coded validation status (Blue = Valid, Orange = Pending)
4. ELLIOTT WAVE RULES VALIDATION
Strictly enforces three cardinal rules:
- Rule 1: Wave 2 never retraces more than 100% of Wave 1
- Rule 2: Wave 3 is never the shortest impulse wave
- Rule 3: Wave 4 never overlaps Wave 1 price territory
5. FIBONACCI ANALYSIS
- Automatic Fibonacci retracement calculations (23.6%, 38.2%, 50%, 61.8%, 78.6%)
- Fibonacci extension projections (100%, 161.8%, 261.8%)
- Wave 3 and Wave 5 target projections
- Fibonacci-based Take Profit levels
6. SIGNAL GENERATION
- Entry signals at Wave 2 completion (catch Wave 3)
- Entry signals at Wave 4 completion (catch Wave 5)
- Automatic Stop Loss placement below/above pivot points
- Multiple Take Profit targets (TP1 at 1.618 extension, TP2 at Wave 5 projection)
- Risk/Reward ratio calculation and filtering
- Minimum R:R threshold (default 1.5:1)
7. VISUAL ELEMENTS
- Pivot markers (H/L) showing swing highs and lows
- ZigZag lines connecting swing points
- Wave number labels (1-2-3-4-5) with validation colors
- Entry signal arrows (Green = BUY, Red = SELL)
- Stop Loss lines (Red dashed)
- Take Profit lines (Green dashed and dotted)
- Real-time status dashboard showing:
* Number of pivots detected
* Wave count progress (X/5)
* Pattern validation status
* Market trend direction
* Signal active status
* Helpful tips and guidance
OPTIMAL USAGE
-------------
• Timeframes: H1, H4, D1 (avoid M1-M5 due to noise)
• Markets: Forex majors (EUR/USD, GBP/USD), Gold (XAU/USD), Major Cryptocurrencies
• Market Conditions: Strong trending markets (avoid ranging/sideways conditions)
• Risk Management: Never risk more than 1-2% per trade
• Position Sizing: Based on calculated Stop Loss distance
CONFIGURATION PARAMETERS
------------------------
Trend Detection:
- MA Fast Period (default: 20)
- MA Slow Period (default: 50)
- MACD settings (12/26/9)
Swing Detection:
- Pivot Lookback Left/Right (default: 10/10, reduce to 5/5 for M15)
- Min Swing Size % (default: 0.1%, reduce to 0.05% for M15)
Wave Detection:
- Min Wave Size % (default: 0.5%, reduce to 0.2-0.3% for smaller timeframes)
Risk Management:
- SL Buffer % (default: 0.1%)
- TP1 Fibonacci Ratio (default: 1.618)
- Min Risk/Reward (default: 1.5)
Visualization:
- Toggle visibility for MAs, ZigZag, Wave Labels, Signals, SL/TP
- Customizable colors for all elements
- Optional trend background coloring
IMPORTANT NOTES
---------------
• Elliott Wave analysis is subjective - this indicator implements one specific interpretation
• Works best in trending markets; automatically suppresses signals in sideways conditions
• Signals are NOT repainting after pivot confirmation
• Not a "holy grail" - combine with other analysis and proper risk management
• Requires patience - quality setups are infrequent but high-probability
• Always backtest on historical data before live trading
ELLIOTT WAVE THEORY BACKGROUND
------------------------------
Elliott Wave Theory, developed by Ralph Nelson Elliott in the 1930s, proposes that market prices move in predictable wave patterns driven by investor psychology. An impulse wave consists of five sub-waves (three in the trend direction, two corrections), followed by a three-wave correction. This indicator automates the identification of these patterns and validates them against Elliott's original rules.
DISCLAIMER
----------
This indicator is for educational and informational purposes only. Past performance does not guarantee future results. Always conduct your own analysis and never trade with money you cannot afford to lose. The indicator provides signals based on technical analysis patterns and does not constitute financial advice.
VERSION
-------
v1.0 - Initial Release
Pine Script v5
Created: 2024
SUPPORT
-------
For detailed usage instructions, refer to the included documentation:
- usage_guide.md - Complete user manual with examples
- elliott_rules.md - Elliott Wave theory reference and implementation details

Elliott Wave (𝐒𝐓𝐄𝐄𝐋 𝐂𝐈𝐓𝐘 𝐂𝐑𝐄𝐀𝐓𝐎𝐑𝐒)This indicator provides a rules-based helper for visually identifying potential Elliott Wave patterns — including 1–5 impulse structures and optional A–B–C corrective moves. It automatically detects pivot highs/lows using the user-defined left/right swing settings and connects them with a ZigZag line filtered by either ATR or percentage change to reduce market noise.
When a valid 5-wave impulse structure is found (either bullish or bearish), the indicator labels waves 1–5 on the chart. After completion of the fifth wave, it optionally monitors for an A–B–C corrective pattern and labels those points when detected. Alerts are generated when an impulse or correction is confirmed.
Features
✅ Automatic pivot detection using configurable left/right swing bars.
✅ ATR or %-based swing filter to avoid small fluctuations.
✅ ZigZag plotting to visualize price structure.
✅ Automatic labeling of potential Elliott impulse waves (1–5).
✅ Optional A–B–C correction detection after wave 5.
✅ Alerts when impulses and corrections complete.
✅ Customizable visuals (colors, sensitivity, pivot length).
✅ Works on all symbols and timeframes.
Usage Tips
For best results, use larger timeframes (e.g., 1H–1D) where Elliott structures are cleaner.
Adjust Pivot Left/Right and ATR Multiplier for your chart’s volatility.
Remember: Elliott Wave theory is interpretive — this tool provides objective swing logic to assist manual analysis, not a guaranteed automatic wave count.

Kyber Cell's – TTM Wave AThe Kyber Cell’s Wave A – TTM Squeeze Momentum Histogram
⸻
1. Introduction
Wave A is the momentum core of the TTM Squeeze system. As the most dynamic and visually responsive of the three “waves,” it captures the ebb and flow of price strength using linear regression techniques. This histogram-based indicator is typically displayed below the chart and serves as an early warning system for potential breakouts, as well as a momentum health monitor during trades.
Built for traders who value precision, timing, and visual clarity, Kyber Cell’s Wave A re-engineers the traditional TTM Wave A with enhanced color logic, momentum sensitivity, and integration-readiness with multi-wave systems. Whether you’re scalping intraday volatility or riding longer-term swings, this tool gives you the pulse of the move — before the price fully commits.
⸻
2. Core Concept and Calculation
Wave A focuses on momentum as deviation from equilibrium, using a linear regression of the smoothed price difference between:
• The current close
• And the average of the Bollinger Band basis and a mid-range average of highs and lows
The result is a histogram that expands and contracts based on how far and how fast price is moving away from its mean. This makes it ideal for identifying when markets are building pressure (compression), releasing energy (expansion), or losing steam (divergence).
⸻
3. Visual Output and Color Logic
The Wave A histogram dynamically changes color based on the direction and acceleration of momentum:
• Bright Cyan: Bullish momentum increasing
• Dark Blue: Bullish momentum weakening
• Bright Red: Bearish momentum increasing
• Dark Red: Bearish momentum weakening
This 4-color system helps traders instantly identify not just the direction of momentum, but the quality of that move:
• Increasing color brightness = momentum is building
• Dimming colors = momentum is fading
This is especially useful in squeeze trades — a rising Wave A during a green dot (squeeze fire) confirms breakout direction. Conversely, a fading Wave A may suggest to delay entry or prepare to exit.
⸻
4. Ideal Use Case
Wave A is most effective when used in conjunction with a TTM Squeeze dot indicator (such as your Squeeze Pro) and optional Wave B/C overlays. The typical workflow:
1. Watch for Compression: Red, orange, or blue squeeze dots from the main chart indicator.
2. Confirm with Wave A: Enter long if Wave A flips cyan and is rising, or short if it flips bright red and is increasing.
3. Monitor the Bars: Fading bars may signal divergence, exhaustion, or false breakouts.
4. Exit Gracefully: When the histogram flips against your position and starts rising in the opposite color, it’s often a signal to consider tightening stops or taking profit.
⸻
5. Configuration and Customization
Wave A is intentionally minimal in external configuration, focusing instead on clean visuals and fast response. However, key parameters typically include:
• Length of the linear regression (commonly set to match the Squeeze window)
• Price smoothing options (if enabled)
• Bar coloring toggle (to adapt for personal theme preferences or integration into multi-wave dashboards)
This keeps Wave A lightweight and compatible with a wide range of strategies, while remaining highly informative in real-time.
⸻
6. Alerts and Add-ons
While Wave A itself is primarily visual, it can be enhanced with optional alert logic:
• Histogram flip from negative to positive (bullish)
• Histogram flip from positive to negative (bearish)
• Momentum peak or divergence alert (custom-coded for advanced users)
Traders often link this with a squeeze-fire signal or Wave B trend alignment to trigger more sophisticated alerts or automation workflows.
⸻
7. Disclaimer
This indicator is for educational and informational purposes only. It is not financial advice. Trading based on this tool involves risk, and all decisions should be made in context of broader technical and fundamental analysis, appropriate risk management, and your own trading strategy.
⸻

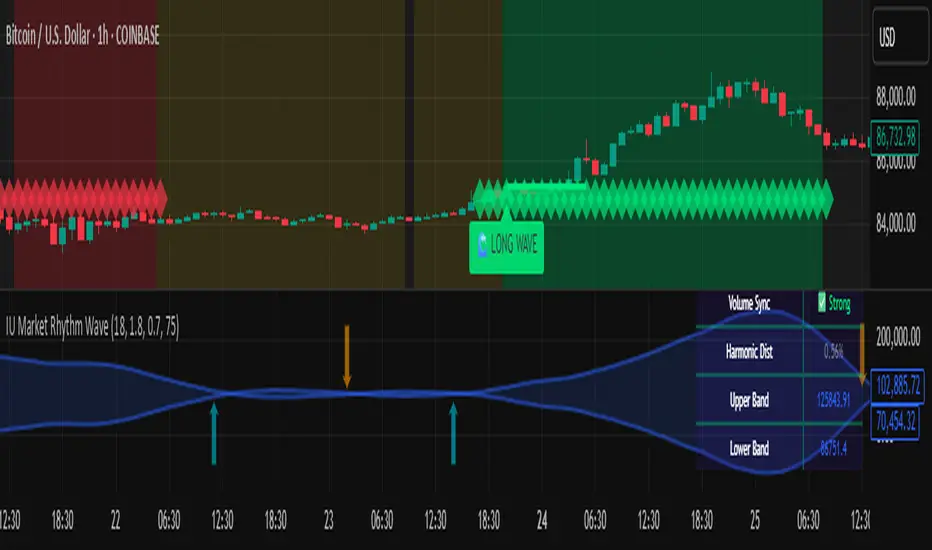
IU Market Rhythm WaveDESCRIPTION:
The IU Market Rhythm Wave is a multi-dimensional indicator designed to reveal the underlying rhythm and energy of the market. By analyzing price momentum, harmonic oscillations, volume behavior, and market breadth, it helps traders identify high-quality long and short wave signals. It also visualizes rhythm bands, wave strength zones, and harmonic levels to provide comprehensive context for decision-making.
This tool is best used on trending instruments where rhythm cycles and volume patterns create clear wave-based opportunities.
USER INPUTS:
Rhythm Cycle Length
Controls the main lookback period used to calculate price waves, harmonic oscillation, volume rhythm, and breath. A longer cycle smooths signals, while a shorter cycle makes them more responsive. Recommended range: 8 to 35.
Wave Signal Strength
Multiplies the standard deviation of rhythm to define dynamic breakout thresholds. A higher value results in fewer but stronger signals, filtering out minor fluctuations.
Harmonic Filter
Applies a sensitivity filter to the harmonic mean and standard deviation. It helps eliminate weak or noisy signals and ensures rhythm-based signals align with harmonic structure.
Show Wave Energy Zones
Toggles background color shading based on current rhythm conditions. Greenish zones indicate strong upward rhythm, red for strong downward rhythm, yellow for positive bias, and gray for weak or neutral zones.
Show Rhythm Bands
Enables the display of upper and lower rhythm bands derived from ATR and rhythm volatility. These bands act as dynamic price envelopes and potential support/resistance zones.
Wave Zone Opacity
Adjusts the transparency of background energy zones, allowing users to control how prominent these zones appear on the chart. Range: 60 to 90 for optimal visibility.
INDICATOR LOGIC:
The indicator combines multiple rhythmic components into a composite rhythm score:
1. Price Wave – Based on momentum (rate of price change) smoothed by a moving average.
2. Harmonic Oscillation – Measures how far price has deviated from a central harmonic average (HLC3).
3. Volume Rhythm – Uses volume’s deviation from its mean, standardized by its volatility.
4. Market Breath – Captures range expansion and closing strength relative to range.
These elements form the Raw Rhythm, which is further smoothed to produce the Market Rhythm. When the rhythm exceeds statistically calculated thresholds and other conditions like volume confirmation and harmonic proximity are met, wave signals are triggered.
Harmonic Fibonacci levels (0.236, 0.382, 0.618, 0.764) are also calculated every rhythm cycle to identify nearby structural price zones. Signals occurring near these levels are considered more reliable.
The Rhythm Bands use ATR and rhythm strength to define dynamic boundaries above and below price. Visual zones and arrows mark rhythm shifts and highlight the underlying energy of the market.
WHY IT IS UNIQUE:
This indicator goes beyond traditional oscillators or volume indicators by blending multiple market dimensions into one rhythmic framework. It adapts to volatility, applies harmonic structure awareness, and filters signals based on real-time market conditions. It offers:
* A unique rhythm-based view of price, volume, and volatility
* Dynamic, adaptive signal generation and zone coloring
* Visual analytics and contextual data in a summary table
* Signal filtering using harmonic alignment and market breath
Its real-time responsiveness and multi-layered logic make it suitable for intraday, swing, and positional traders.
HOW USER CAN BENEFIT FROM IT:
* Spot high-conviction long or short entries when rhythm, volume, and structure align
* Avoid low-quality trades during weak or noisy rhythm periods
* Use visual wave zones to gauge trend strength and rhythm direction
* Monitor harmonic proximity to enter or exit near key structural levels
* Apply rhythm bands for dynamic stop-loss and target setting
* Use rhythm direction arrows and analytics table to gain deeper market insight
DISCLAIMER:
This indicator is created for educational and informational purposes only. It does not constitute financial advice or a recommendation to buy or sell any asset. All trading involves risk, and users should conduct their own analysis or consult with a qualified financial advisor before making any trading decisions. The creator is not responsible for any losses incurred through the use of this tool. Use at your own discretion.
Smart Liquidity Wave [The_lurker]"Smart Liquidity Wave" هو مؤشر تحليلي متطور يهدف لتحديد نقاط الدخول والخروج المثلى بناءً على تحليل السيولة، قوة الاتجاه، وإشارات السوق المفلترة. يتميز المؤشر بقدرته على تصنيف الأدوات المالية إلى أربع فئات سيولة (ضعيفة، متوسطة، عالية، عالية جدًا)، مع تطبيق شروط مخصصة لكل فئة تعتمد على تحليل الموجات السعرية، الفلاتر المتعددة، ومؤشر ADX.
فكرة المؤشر
الفكرة الأساسية هي الجمع بين قياس السيولة اليومية الثابتة وتحليل ديناميكي للسعر باستخدام فلاتر متقدمة لتوليد إشارات دقيقة. المؤشر يركز على تصفية الضوضاء في السوق من خلال طبقات متعددة من التحليل، مما يجعله أداة ذكية تتكيف مع الأدوات المالية المختلفة بناءً على مستوى سيولتها.
طريقة عمل المؤشر
1- قياس السيولة:
يتم حساب السيولة باستخدام متوسط حجم التداول على مدى 14 يومًا مضروبًا في سعر الإغلاق، ويتم ذلك دائمًا على الإطار الزمني اليومي لضمان ثبات القيمة بغض النظر عن الإطار الزمني المستخدم في الرسم البياني.
يتم تصنيف السيولة إلى:
ضعيفة: أقل من 5 ملايين (قابل للتعديل).
متوسطة: من 5 إلى 20 مليون.
عالية: من 20 إلى 50 مليون.
عالية جدًا: أكثر من 50 مليون.
هذا الثبات في القياس يضمن أن تصنيف السيولة لا يتغير مع تغير الإطار الزمني، مما يوفر أساسًا موثوقًا للإشارات.
2- تحليل الموجات السعرية:
يعتمد المؤشر على تحليل الموجات باستخدام متوسطات متحركة متعددة الأنواع (مثل SMA، EMA، WMA، HMA، وغيرها) يمكن للمستخدم اختيارها وتخصيص فتراتها ، يتم دمج هذا التحليل مع مؤشرات إضافية مثل RSI (مؤشر القوة النسبية) وMFI (مؤشر تدفق الأموال) بوزن محدد (40% للموجات، 30% لكل من RSI وMFI) للحصول على تقييم شامل للاتجاه.
3- الفلاتر وطريقة عملها:
المؤشر يستخدم نظام فلاتر متعدد الطبقات لتصفية الإشارات وتقليل الضوضاء، وهي من أبرز الجوانب المخفية التي تعزز دقته:
الفلتر الرئيسي (Main Filter):
يعمل على تنعيم التغيرات السعرية السريعة باستخدام معادلة رياضية تعتمد على تحليل الإشارات (Signal Processing).
يتم تطبيقه على السعر لاستخراج الاتجاهات الأساسية بعيدًا عن التقلبات العشوائية، مع فترة زمنية قابلة للتعديل (افتراضي: 30).
يستخدم تقنية مشابهة للفلاتر عالية التردد (High-Pass Filter) للتركيز على الحركات الكبيرة.
الفلتر الفرعي (Sub Filter):
يعمل كطبقة ثانية للتصفية، مع فترة أقصر (افتراضي: 12)، لضبط الإشارات بدقة أكبر.
يستخدم معادلات تعتمد على الترددات المنخفضة للتأكد من أن الإشارات الناتجة تعكس تغيرات حقيقية وليست مجرد ضوضاء.
إشارة الزناد (Signal Trigger):
يتم تطبيق متوسط متحرك على نتائج الفلتر الرئيسي لتوليد خط إشارة (Signal Line) يُقارن مع عتبات محددة للدخول والخروج.
يمكن تعديل فترة الزناد (افتراضي: 3 للدخول، 5 للخروج) لتسريع أو تبطيء الإشارات.
الفلتر المربع (Square Filter):
خاصية مخفية تُفعّل افتراضيًا تعزز دقة الفلاتر عن طريق تضييق نطاق التذبذبات المسموح بها، مما يقلل من الإشارات العشوائية في الأسواق المتقلبة.
4- تصفية الإشارات باستخدام ADX:
يتم استخدام مؤشر ADX كفلتر نهائي للتأكد من قوة الاتجاه قبل إصدار الإشارة:
ضعيفة ومتوسطة: دخول عندما يكون ADX فوق 40، خروج فوق 50.
عالية: دخول فوق 40، خروج فوق 55.
عالية جدًا: دخول فوق 35، خروج فوق 38.
هذه العتبات قابلة للتعديل، مما يسمح بتكييف المؤشر مع استراتيجيات مختلفة.
5- توليد الإشارات:
الدخول: يتم إصدار إشارة شراء عندما تنخفض خطوط الإشارة إلى ما دون عتبة محددة (مثل -9) مع تحقق شروط الفلاتر، السيولة، وADX.
الخروج: يتم إصدار إشارة بيع عندما ترتفع الخطوط فوق عتبة (مثل 109 أو 106 حسب الفئة) مع تحقق الشروط الأخرى.
تُعرض الإشارات بألوان مميزة (أزرق للدخول، برتقالي للضعيفة والمتوسطة، أحمر للعالية والعالية جدًا) وبثلاثة أحجام (صغير، متوسط، كبير).
6- عرض النتائج:
يظهر مستوى السيولة الحالي في جدول في أعلى يمين الرسم البياني، مما يتيح للمستخدم معرفة فئة الأصل بسهولة.
7- دعم التنبيهات:
تنبيهات فورية لكل فئة سيولة، مما يسهل التداول الآلي أو اليدوي.
%%%%% الجوانب المخفية في الكود %%%%%
معادلات الفلاتر المتقدمة: يستخدم المؤشر معادلات رياضية معقدة مستوحاة من معالجة الإشارات لتنعيم البيانات واستخراج الاتجاهات، مما يجعله أكثر دقة من المؤشرات التقليدية.
التكيف التلقائي: النظام يضبط نفسه داخليًا بناءً على التغيرات في السعر والحجم، مع عوامل تصحيح مخفية (مثل معامل التنعيم في الفلاتر) للحفاظ على الاستقرار.
التوزيع الموزون: الدمج بين الموجات، RSI، وMFI يتم بأوزان محددة (40%، 30%، 30%) لضمان توازن التحليل، وهي تفاصيل غير ظاهرة مباشرة للمستخدم لكنها تؤثر على النتائج.
الفلتر المربع: خيار مخفي يتم تفعيله افتراضيًا لتضييق نطاق الإشارات، مما يقلل من التشتت في الأسواق ذات التقلبات العالية.
مميزات المؤشر
1- فلاتر متعددة الطبقات: تضمن تصفية الضوضاء وإنتاج إشارات موثوقة فقط.
2- ثبات السيولة: قياس السيولة اليومي يجعل التصنيف متسقًا عبر الإطارات الزمنية.
3- تخصيص شامل: يمكن تعديل حدود السيولة، عتبات ADX، فترات الفلاتر، وأنواع المتوسطات المتحركة.
4- إشارات مرئية واضحة: تصميم بصري يسهل التفسير مع تنبيهات فورية.
5- تقليل الإشارات الخاطئة: الجمع بين الفلاتر وADX يعزز الدقة ويقلل من التشتت.
إخلاء المسؤولية
لا يُقصد بالمعلومات والمنشورات أن تكون، أو تشكل، أي نصيحة مالية أو استثمارية أو تجارية أو أنواع أخرى من النصائح أو التوصيات المقدمة أو المعتمدة من TradingView.
#### **What is the Smart Liquidity Wave Indicator?**
"Smart Liquidity Wave" is an advanced analytical indicator designed to identify optimal entry and exit points based on liquidity analysis, trend strength, and filtered market signals. It stands out with its ability to categorize financial instruments into four liquidity levels (Weak, Medium, High, Very High), applying customized conditions for each category based on price wave analysis, multi-layered filters, and the ADX (Average Directional Index).
#### **Concept of the Indicator**
The core idea is to combine a stable daily liquidity measurement with dynamic price analysis using sophisticated filters to generate precise signals. The indicator focuses on eliminating market noise through multiple analytical layers, making it an intelligent tool that adapts to various financial instruments based on their liquidity levels.
#### **How the Indicator Works**
1. **Liquidity Measurement:**
- Liquidity is calculated using the 14-day average trading volume multiplied by the closing price, always based on the daily timeframe to ensure value consistency regardless of the chart’s timeframe.
- Liquidity is classified as:
- **Weak:** Less than 5 million (adjustable).
- **Medium:** 5 to 20 million.
- **High:** 20 to 50 million.
- **Very High:** Over 50 million.
- This consistency in measurement ensures that liquidity classification remains unchanged across different timeframes, providing a reliable foundation for signals.
2. **Price Wave Analysis:**
- The indicator relies on wave analysis using various types of moving averages (e.g., SMA, EMA, WMA, HMA, etc.), which users can select and customize in terms of periods.
- This analysis is integrated with additional indicators like RSI (Relative Strength Index) and MFI (Money Flow Index), weighted specifically (40% waves, 30% RSI, 30% MFI) to provide a comprehensive trend assessment.
3. **Filters and Their Functionality:**
- The indicator employs a multi-layered filtering system to refine signals and reduce noise, a key hidden feature that enhances its accuracy:
- **Main Filter:**
- Smooths rapid price fluctuations using a mathematical equation rooted in signal processing techniques.
- Applied to price data to extract core trends away from random volatility, with an adjustable period (default: 30).
- Utilizes a technique similar to high-pass filters to focus on significant movements.
- **Sub Filter:**
- Acts as a secondary filtering layer with a shorter period (default: 12) for finer signal tuning.
- Employs low-frequency-based equations to ensure resulting signals reflect genuine changes rather than mere noise.
- **Signal Trigger:**
- Applies a moving average to the main filter’s output to generate a signal line, compared against predefined entry and exit thresholds.
- Trigger period is adjustable (default: 3 for entry, 5 for exit) to speed up or slow down signals.
- **Square Filter:**
- A hidden feature activated by default, enhancing filter precision by narrowing the range of permissible oscillations, reducing random signals in volatile markets.
4. **Signal Filtering with ADX:**
- ADX is used as a final filter to confirm trend strength before issuing signals:
- **Weak and Medium:** Entry when ADX exceeds 40, exit above 50.
- **High:** Entry above 40, exit above 55.
- **Very High:** Entry above 35, exit above 38.
- These thresholds are adjustable, allowing the indicator to adapt to different trading strategies.
5. **Signal Generation:**
- **Entry:** A buy signal is triggered when signal lines drop below a specific threshold (e.g., -9) and conditions for filters, liquidity, and ADX are met.
- **Exit:** A sell signal is issued when signal lines rise above a threshold (e.g., 109 or 106, depending on the category) with all conditions satisfied.
- Signals are displayed in distinct colors (blue for entry, orange for Weak/Medium, red for High/Very High) and three sizes (small, medium, large).
6. **Result Display:**
- The current liquidity level is shown in a table at the top-right of the chart, enabling users to easily identify the asset’s category.
7. **Alert Support:**
- Instant alerts are provided for each liquidity category, facilitating both automated and manual trading.
#### **Hidden Aspects in the Code**
- **Advanced Filter Equations:** The indicator uses complex mathematical formulas inspired by signal processing to smooth data and extract trends, making it more precise than traditional indicators.
- **Automatic Adaptation:** The system internally adjusts based on price and volume changes, with hidden correction factors (e.g., smoothing coefficients in filters) to maintain stability.
- **Weighted Distribution:** The integration of waves, RSI, and MFI uses fixed weights (40%, 30%, 30%) for balanced analysis, a detail not directly visible but impactful on results.
- **Square Filter:** A hidden option, enabled by default, narrows signal range to minimize dispersion in high-volatility markets.
#### **Indicator Features**
1. **Multi-Layered Filters:** Ensures noise reduction and delivers only reliable signals.
2. **Liquidity Stability:** Daily liquidity measurement keeps classification consistent across timeframes.
3. **Comprehensive Customization:** Allows adjustments to liquidity thresholds, ADX levels, filter periods, and moving average types.
4. **Clear Visual Signals:** User-friendly design with easy-to-read visuals and instant alerts.
5. **Reduced False Signals:** Combining filters and ADX enhances accuracy and minimizes clutter.
#### **Disclaimer**
The information and publications are not intended to be, nor do they constitute, financial, investment, trading, or other types of advice or recommendations provided or endorsed by TradingView.

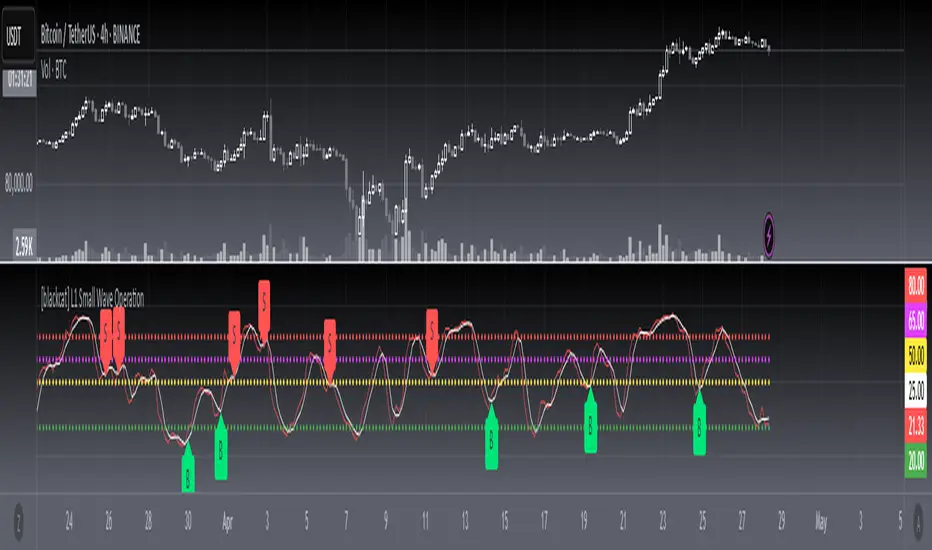
[blackcat] L1 Small Wave Operation L1 Small Wave Operation
Overview
Are you looking to catch those elusive small waves in the market? Look no further than " L1 Small Wave Operation." This script offers a unique way to identify potential buying opportunities by analyzing price movements, volume changes, and trend directions. With customizable inputs and clear visual indicators, it’s designed to help traders spot favorable entry points with precision.
Features
Dynamic Signal Identification: Automatically detects two types of buy signals labeled "S" and "B."
Adaptable Parameters: Allows users to adjust low period, high period, EMA periods, SMA period, and various threshold values to fine-tune the strategy.
Visual Clarity: Plots K and D lines along with four distinct threshold levels for easy visualization.
Condition-Based Signals: Uses multiple conditions including volume increases, price actions, and crossover events to confirm signals.
How It Works
Calculate Percent Range: Determines where the current closing price lies within the recent low and high range.
Compute Moving Averages: Calculates Exponential Moving Average (EMA) and Simple Moving Average (SMA) of the percent range.
Define Conditions: Checks for bullish or strong bullish patterns, uptrends, and specific crossover events between K and D lines.
Generate Signals: Marks potential buying opportunities when predetermined conditions are met.
How To Use
Add this script to your TradingView chart.
Adjust the input parameters according to your preferred settings.
Monitor the plotted lines and look for "S" and "B" labels indicating buy signals.
Consider incorporating these signals into a broader trading strategy that includes risk management techniques.
What Makes It Special
Flexibility: Users can easily modify parameters to adapt the script to different markets or personal preferences.
Automation: Saves time by automatically scanning for trade setups based on predefined rules.
Comprehensive Analysis: Combines multiple factors like volume, price action, and moving averages to provide reliable signals.
Limitations
Past performance does not guarantee future results.
Market conditions can vary, affecting signal reliability.
Not suitable for very short-term trades without additional refinements.
Notes
Always perform backtesting on historical data before implementing live trades.
Understand the underlying logic of the script to avoid misinterpretation of signals.
Regularly review and adjust parameters based on changing market dynamics.
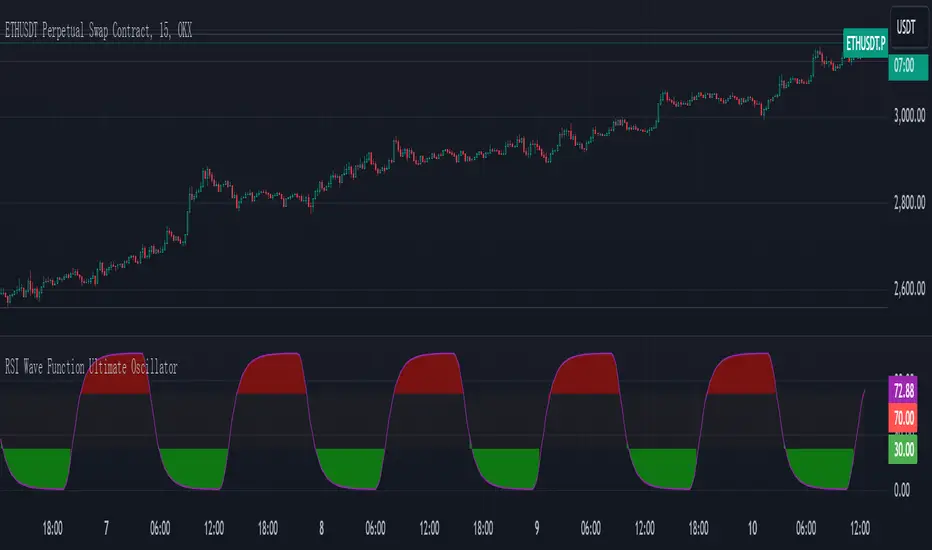
RSI Wave Function Ultimate OscillatorEnglish Explanation of the "RSI Wave Function Ultimate Oscillator" Pine Script Code
Understanding the Code
Purpose:
This Pine Script code creates a custom indicator that combines the Relative Strength Index (RSI) with a wave function to potentially provide more nuanced insights into market dynamics.
Key Components:
* Wave Function: This is a custom calculation that introduces a sinusoidal wave component to the price data. The frequency parameter controls the speed of the oscillation, and the decay factor determines how quickly the influence of past prices diminishes.
* Smoothed Signal: The wave function is applied to the closing price to create a smoothed signal, which is essentially a price series modulated by a sine wave.
* RSI: The traditional RSI is then calculated on this smoothed signal, providing a measure of the speed and change of price movements relative to recent price changes.
Calculation Steps:
* Wave Function Calculation:
* A sinusoidal wave is generated based on the bar index and the frequency parameter.
* The wave is combined with the closing price using a weighted average, where the decay factor determines the weight given to previous values.
* RSI Calculation:
* The RSI is calculated on the smoothed signal using a standard RSI formula.
* Plotting:
* The RSI values are plotted on a chart, along with horizontal lines at 70 and 30 to indicate overbought and oversold conditions.
* The area between the RSI line and the overbought/oversold lines is filled with color to visually represent the market condition.
Interpretation and Usage
* Wave Function: The wave function introduces cyclical patterns into the price data, which can help identify potential turning points or momentum shifts.
* RSI: The RSI provides a measure of the speed and change of price movements relative to recent price changes. When applied to the smoothed signal, it can help identify overbought and oversold conditions, as well as potential divergences between price and momentum.
* Combined Indicator: The combination of the wave function and RSI aims to provide a more sensitive and potentially earlier indication of market reversals.
* Signals:
* Crossovers: Crossovers of the RSI line above or below the overbought/oversold lines can be used to generate buy or sell signals.
* Divergences: Divergences between the price and the RSI can indicate a weakening trend.
* Oscillations: The amplitude and frequency of the oscillations in the RSI can provide insights into the strength and duration of market trends.
How it Reflects Market Volatility
* Amplified Volatility: The wave function can amplify the volatility of the price data, making it easier to identify potential turning points.
* Smoothing: The decay factor helps to smooth out short-term fluctuations, allowing the indicator to focus on longer-term trends.
* Sensitivity: The combination of the wave function and RSI can make the indicator more sensitive to changes in market momentum.
In essence, this custom indicator attempts to enhance traditional RSI analysis by incorporating a cyclical component that can potentially provide earlier signals of market reversals.
Note: The effectiveness of this indicator will depend on various factors, including the specific market, time frame, and the chosen values for the frequency and decay parameters. It is recommended to conduct thorough backtesting and optimize the parameters to suit your specific trading strategy.
Money Wave Script (Visual Adaptive MFI)This Script is a visual modification of the Money Flow Index (MFI)
//@version=5
indicator(title="Money Flow Index", shorttitle="MFI", format=format.price, precision=2, timeframe="", timeframe_gaps=true)
length = input.int(title="Length", defval=14, minval=1, maxval=2000)
src = hlc3
mf = ta.mfi(src, length)
plot(mf, "MF", color=#7E57C2)
overbought=hline(80, title="Overbought", color=#787B86)
hline(50, "Middle Band", color=color.new(#787B86, 50))
oversold=hline(20, title="Oversold", color=#787B86)
fill(overbought, oversold, color=color.rgb(126, 87, 194, 90), title="Background")
This Money Wave Script is culled from. the Money Flow Index with visual representation to help traders identify money flow. In addition, the waves can be smoothened. Here’s a detailed overview based on its functionality, color coding, usage, risk management, and a concluding summary.
Functionality
The Money Wave Script operates as an oscillator that measures the inflow and outflow of money into an asset over a specified period. It calculates the MFI by considering both price and volume, which allows it to assess buying and selling pressures more accurately than traditional indicators that rely solely on price data.
Color Coding
The indicator employs a color-coded scheme to enhance visual interpretation:
Green Area: Indicates bullish conditions when the normalized Money wave is above zero, suggesting buying pressure.
Red Area: Indicates bearish conditions when the normalized Money wave is below zero, suggesting selling pressure.
Background Colors: The background changes to green when the MoneyWave exceeds the upper threshold (overbought) and red when it falls below the lower threshold (oversold), providing immediate visual cues about market conditions.
Usage
Traders utilize the Money Wave indicator in various ways:
Identifying Overbought and Oversold Levels: By observing the MFI readings, traders can determine when an asset may be overbought or oversold, prompting potential entry or exit points.
Spotting Divergences: Traders look for divergences between price and the MFI to anticipate potential reversals. For example, if prices are making new highs but the MFI is not, it could indicate weakening momentum.
Trend Confirmation: The indicator can help confirm trends by showing whether buying or selling pressure is dominating.
Customizable Settings: Users can adjust parameters such as the MFI length , Smoothen index and overbought/oversold thresholds to tailor the indicator to their trading strategies.
Conclusion
The Money Wave indicator is a powerful tool for traders seeking to analyze market conditions based on the flow of money into and out of assets. Its combination of price and volume analysis, along with clear visual cues, makes it an effective choice for identifying overbought and oversold conditions, spotting divergences, and confirming trends.

Butterfly Harmonic Pattern [TradingFinder] Harmonic Detector🔵 Introduction
The Butterfly Harmonic Pattern is a sophisticated and highly regarded tool in technical analysis, utilized by traders to identify potential reversal points in the financial markets. This pattern is distinguished by its reliance on Fibonacci ratios and geometric configurations, which aid in predicting price movements with remarkable precision.
The origin of the Butterfly Harmonic Pattern can be traced back to the pioneering work of Bryce Gilmore, who is credited with discovering this pattern. Gilmore's extensive research and expertise in Fibonacci ratios laid the groundwork for the identification and application of this pattern in technical analysis.
The Butterfly pattern, like other harmonic patterns, is based on the principle that market movements are not random but follow specific structures and ratios.
The pattern is characterized by a distinct "M" shape in bullish scenarios and a "W" shape in bearish scenarios, each indicating a potential reversal point. These formations are identified by specific Fibonacci retracement and extension levels, making the Butterfly pattern a powerful tool for traders seeking to capitalize on market turning points.
The precise nature of the Butterfly pattern allows for the accurate prediction of target prices and the establishment of strategic entry and exit points, making it an indispensable component of a trader's analytical arsenal.
Bullish :
Bearish :
🔵 How to Use
Like other harmonic patterns, the Butterfly pattern is categorized based on how it forms at the end of an uptrend or downtrend. Unlike the Gartley and Bat patterns, the Butterfly pattern, similar to the Crab pattern, forms outside the wave 3 range at the end of a rally.
🟣 Types of Butterfly Harmonic Patterns
🟣 Bullish Butterfly Pattern
This pattern forms at the end of a downtrend and leads to a trend reversal from a downtrend to an uptrend.
🟣 Bearish Butterfly Pattern
In contrast to the Bullish Butterfly pattern, this pattern forms at the end of an uptrend and warns analysts of a trend reversal to a downtrend. In this case, traders are encouraged to shift their trading stance from buy trades to sell trades.
Advantages and Limitations of the Butterfly Pattern in Technical Analysis :
The Butterfly pattern is considered one of the precise and stable tools in financial market analysis. However, it is always important to pay special attention to the advantages and limitations of each pattern.
Here, we review the advantages and disadvantages of using the Butterfly harmonic pattern :
The main advantage of the Butterfly pattern is providing very accurate signals.
Using Fibonacci golden ratios and geometric rules, the Butterfly pattern identifies patterns accurately and systematically. (This high accuracy significantly helps investors in making trading decisions.)
Identifying this pattern requires expertise and experience in technical analysis.
Recognizing the Butterfly pattern might be complex for beginner traders. (Correct identification of the pattern necessitates mastery over geometric principles and Fibonacci ratios.)
The Butterfly harmonic pattern might issue false trading signals. (Traders usually combine the Butterfly pattern with other technical tools to confirm buy and sell signals.)
🔵 Setting
🟣 Logical Setting
ZigZag Pivot Period : You can adjust the period so that the harmonic patterns are adjusted according to the pivot period you want. This factor is the most important parameter in pattern recognition.
Show Valid Forma t: If this parameter is on "On" mode, only patterns will be displayed that they have exact format and no noise can be seen in them. If "Off" is, the patterns displayed that maybe are noisy and do not exactly correspond to the original pattern.
Show Formation Last Pivot Confirm : if Turned on, you can see this ability of patterns when their last pivot is formed. If this feature is off, it will see the patterns as soon as they are formed. The advantage of this option being clear is less formation of fielded patterns, and it is accompanied by the latest pattern seeing and a sharp reduction in reward to risk.
Period of Formation Last Pivot : Using this parameter you can determine that the last pivot is based on Pivot period.
🟣 Genaral Setting
Show : Enter "On" to display the template and "Off" to not display the template.
Color : Enter the desired color to draw the pattern in this parameter.
LineWidth : You can enter the number 1 or numbers higher than one to adjust the thickness of the drawing lines. This number must be an integer and increases with increasing thickness.
LabelSize : You can adjust the size of the labels by using the "size.auto", "size.tiny", "size.smal", "size.normal", "size.large" or "size.huge" entries.
🟣 Alert Setting
Alert : On / Off
Message Frequency : This string parameter defines the announcement frequency. Choices include: "All" (activates the alert every time the function is called), "Once Per Bar" (activates the alert only on the first call within the bar), and "Once Per Bar Close" (the alert is activated only by a call at the last script execution of the real-time bar upon closing). The default setting is "Once per Bar".
Show Alert Time by Time Zone : The date, hour, and minute you receive in alert messages can be based on any time zone you choose. For example, if you want New York time, you should enter "UTC-4". This input is set to the time zone "UTC" by default.

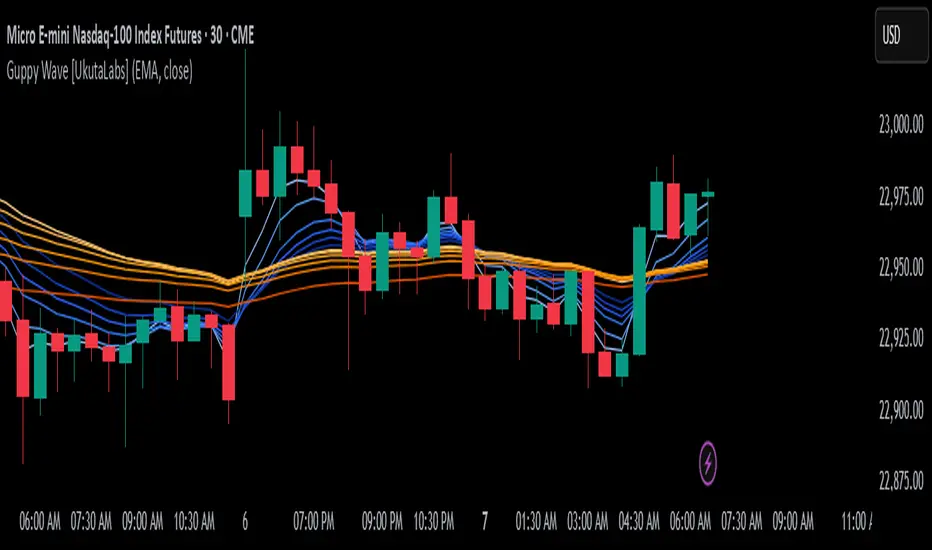
Guppy Wave [UkutaLabs]█ OVERVIEW
The Guppy Wave Indicator is a collection of Moving Averages that provide insight on current market strength. This is done by plotting a series of 12 Moving Averages and analysing where each one is positioned relative to the others.
In doing this, this script is able to identify short-term moves and give an idea of the current strength and direction of the market.
The aim of this script is to simplify the trading experience of users by automatically displaying a series of useful Moving Averages to provide insight into short-term market strength.
█ USAGE
The Guppy Wave is generated using a series of 12 total Moving Averages composed of 6 Small-Period Moving Averages and 6 Large Period Moving Averages. By measuring the position of each moving average relative to the others, this script provides unique insight into the current strength of the market.
Rather than simply plotting 12 Moving Averages, a color gradient is instead drawn between the Moving Averages to make it easier to visualise the distribution of the Guppy Wave. The color of this gradient changes depending on whether the Small-Period Averages are above or below the Large-Period Averages, allowing traders to see current short-term market strength at a glance.
When the gradient fans out, this indicates a rapid short-term move. When the gradient is thin, this indicates that there is no dominant power in the market.
█ SETTINGS
• Moving Average Type: Determines the type of Moving Average that get plotted (EMA, SMA, WMA, VWMA, HMA, RMA)
• Moving Average Source: Determines the source price used to calculate Moving Averages (open, high, low, close, hl2, hlc3, ohlc4, hlcc4)
• Bearish Color: Determines the color of the gradient when Small-Period MAs are above Large-Period MAs.
• Bullish Color: Determines the color of the gradient when Small-Period MAs are below Large-Period MAs.