Golden Ratio Trend Persistence [EWT]Golden Ratio Trend Persistence
~~~~~~~~~~~~~~~~~~~~~~~~~~~~~~~~~~~~~~~~~~~~
Overview
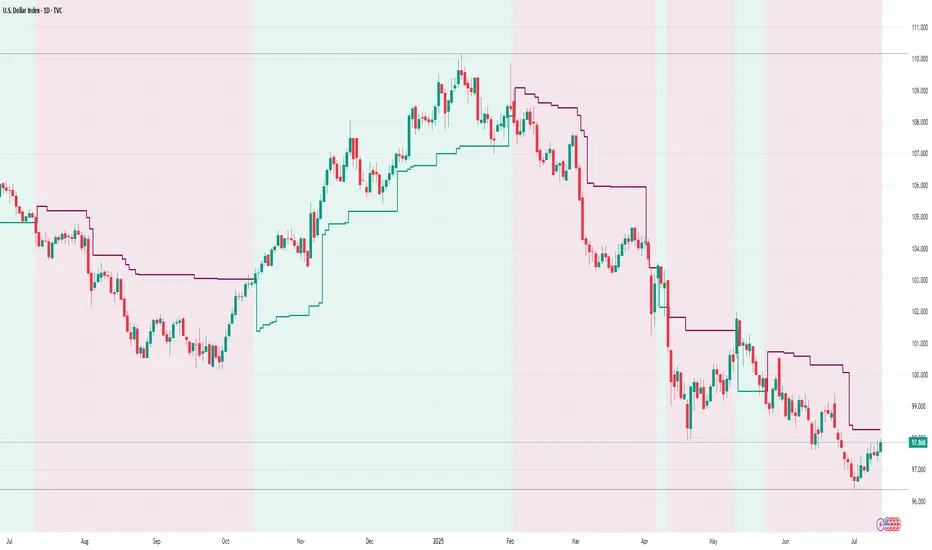
The Golden Ratio Trend Persistence is a dynamic tool designed to identify the strength and persistence of market trends. It operates on a simple yet powerful premise: a trend is likely to continue as long as it doesn't retrace beyond the key Fibonacci golden ratio of 61.8%.
This indicator automatically identifies the most significant swing high or low and plots a single, dynamic line representing the 61.8% retracement level of the current move. This line acts as a "line in the sand" for the prevailing trend. The background color also changes to provide an immediate visual cue of the current market direction.
~~~~~~~~~~~~~~~~~~~~~~~~~~~~~~~~~~~~~~~~~~~~
The Power of the Golden Ratio (61.8%)
The golden ratio (ϕ≈1.618) and its inverse (0.618, or 61.8%) are fundamental mathematical constants that appear throughout nature, art, and science, often representing harmony and structure. In financial markets, this ratio is a cornerstone of Fibonacci analysis and is considered one of the most critical levels for price retracements.
Market movements are not linear; they progress in waves of impulse and correction. The 61.8% level often acts as the ultimate point of support or resistance. A trend that can hold this level demonstrates underlying strength and is likely to persist. A breach of this level, however, suggests a fundamental shift in market sentiment and a potential reversal.
~~~~~~~~~~~~~~~~~~~~~~~~~~~~~~~~~~~~~~~~~~~~
How to Use This Indicator
This indicator is designed for clarity and ease of use.
Identifying the Trend : The visual cues make the current trend instantly recognizable.
A teal line with a teal background signifies a bullish trend. The line acts as dynamic support.
A maroon line with a maroon background signifies a bearish trend. The line acts as dynamic resistance.
Confirming Trend Persistence : As long as the price respects the plotted level, the trend is considered intact.
In an uptrend, prices should remain above the teal line. The indicator will automatically adjust its anchor to new, higher lows, causing the support line to trail the price.
In a downtrend, prices should remain below the maroon line.
Spotting Trend Reversals : The primary signal is a trend reversal, which occurs when the price closes decisively beyond the plotted level.
Potential Sell Signal : When the price closes below the teal support line, it indicates that buying pressure has failed, and the uptrend is likely over.
Potential Buy Signal : When the price closes above the maroon resistance line, it indicates that selling pressure has subsided, and a new uptrend may be starting.
Think of this tool as an intelligent, adaptive trailing stop that is based on market structure and the time-tested principles of Fibonacci analysis.
~~~~~~~~~~~~~~~~~~~~~~~~~~~~~~~~~~~~~~~~~~~~
Input Parameters
You can customize the indicator's sensitivity through the following inputs in the settings menu:
Pivot Lookback Left : This number defines how many bars to the left of a candle must be lower (for a pivot high) or higher (for a pivot low) to identify a potential swing point. A higher value will result in fewer, but more significant, pivots being detected.
Pivot Lookback Right : This defines the number of bars that must close to the right before a swing point is confirmed. This parameter prevents the indicator from repainting. A higher value increases confirmation strength but also adds a slight lag.
Fibonacci Ratio : While the default is the golden ratio (0.618), you can adjust this to other key Fibonacci levels, such as 0.5 (50%) or 0.382 (38.2%), to test for different levels of trend persistence.
Adjusting these parameters allows you to fine-tune the indicator for different assets, timeframes, and trading styles, from short-term scalping to long-term trend following.
Cerca negli script per "wave"
Quantum Harmonic Oscillator Overlay🧪 Quantum Harmonic Oscillator Overlay
A visual model of price behavior using quantum harmonic oscillation principles
📜 Indicator Overview
The Quantum Harmonic Oscillator Overlay applies concepts from both classical physics (harmonic motion) and quantum mechanics (energy states) to model and visualize how price orbits around a central trend line. It overlays a Linear Regression line (representing the “mean position” or ground state of price) and calculates surrounding energy levels (σ-zones) akin to quantum shells that price can "jump" between.
This indicator is particularly useful for visualizing mean reversion, volatility compression/expansion, and momentum-driven price breakthroughs.
🧠 Core Concepts
Linear Regression Line (LSR): This is the calculated center of gravity or equilibrium path of price over a user-defined period. Think of it like the lowest energy state or central axis around which price vibrates.
Standard Deviation Zones (σ-levels):
1σ: The majority of normal price activity; within this range, price tends to fluctuate if in balance.
2σ: Indicates volatility or possible breakout pressure.
3σ: Represents extreme movement — a phase shift in energy, potentially leading to reversal or continuation with higher momentum.
Quantum Analogy: Just like in a quantum harmonic oscillator, particles (here, prices) move probabilistically between discrete energy states. The further the price moves from the center, the more "energy" (momentum, volume, volatility) is implied.
⚙️ Input Parameters
Setting Description
Linear Regression Length The number of bars used to calculate the regression trend (default 100). Affects the central path and responsiveness.
σ Multipliers (1σ, 2σ, 3σ) Determine how far each band is from the regression line. Adjusting these can highlight different price behaviors.
Show Energy Level Zones Toggle visibility of the colored bands around the regression line.
Show LSR Center Line Toggles visibility of the white Linear Regression line itself.
🎨 Visual Components
Color Zone Interpretation
✅ Green ±1σ Normal oscillation / mean reversion area. Ideal for range-bound strategies.
🟧 Orange ±2σ Warning zone; price may be gaining momentum or volatility.
🔴 Red ±3σ High-momentum state or anomaly. These regions may imply trend exhaustion, reversals, or breakouts.
White Line: The LSR — the average trajectory of the price movement.
Pink Dots: Appear when price exceeds Zone 3 (outside ±3σ) — a signal of extreme behavior or a possible regime shift.
📈 How to Use This Indicator
1. Detect Overextensions
When price touches or breaches the 3σ zone, it is likely overextended. This can be used to anticipate potential snapbacks or strong breakout trends.
2. Identify Mean Reversion Trades
If price exits the 2σ or 3σ zones and returns toward the center line, this signals a likely mean reversion setup.
3. Volatility Compression or Expansion
Flat zones between σ levels suggest calm markets; widening bands suggest expanding volatility.
4. Use with Confirmation Tools
Combine with momentum oscillators (MACD, RSI) or volume-based signals to confirm reversals or continuation outside Zone 3.
🔮 Philosophical Note
This indicator embodies the metaphor that the market behaves like a quantum oscillator — price particles exist in a probabilistic field and jump between discrete zones of volatility and energy. Tracking these transitions allows the trader to see price behavior as rhythmic, wave-like, and multidimensional rather than purely linear.

Chaithanya Tattva Volume Zones📜 "Chaitanya Tattva" Volume Zones:-
A Sacred Framework of Supply, Demand & Market Energy
In the world of financial markets, price is said to reflect all information. But the true pulse of the market — its life force, its intent, and its moment of truth — is most vividly expressed not in price itself, but in volume.
Chaitanya Tattva Volume Zones is a spiritually inspired volume-based tool that transforms your chart into a canvas of market consciousness, revealing moments where supply and demand engage in visible energetic spikes. These moments are often disguised as ordinary candles, but with this tool, you uncover zones of intent — footprints left by the market’s deeper intelligence.
🌟 Why “Chaitanya Tattva”?
Chaitanya (चैतन्य) is a Sanskrit word meaning consciousness, awareness, or the spark of life energy. It is that which animates — the subtle intelligence behind all movement.
Tattva (तत्त्व) refers to essence, truth, or the underlying principle of a thing. In classical yogic philosophy, the tattvas are the elemental building blocks of reality.
Together, Chaitanya Tattva represents the conscious essence — the living pulse that animates the market through volume surges and imbalances.
This tool is not just a technical indicator — it is a spiritual observation device that aligns with the rhythm of volume and price action. It doesn't predict the market. It reveals when the market has already spoken — loudly, clearly, and energetically.
📈 What Does the Tool Do?
Chaitanya Tattva Volume Zones identifies exceptional volume spikes within the recent price history and visually marks the areas where market intent has been most active.
Specifically, the tool:
Scans for volume spikes that exceed all the volume of the last N bars (default is 20)
Confirms whether the spike happened on a bullish candle (close > open) or bearish candle (close < open)
For a bullish spike, it marks a Supply Zone — the area between the high and close of the candle
For a bearish spike, it marks a Demand Zone — the area between the low and close
Visually paints these zones with soft translucent boxes (red for supply, green for demand) that extend forward across multiple bars
🧘♂️ The Spiritual Framework
🔴 Supply = "Agni" — The Fire of Expansion
When a bullish candle erupts with historically high volume, it symbolizes the fire (Agni) of market optimism and upward expansion. It means that buyers have absorbed available supply at that level and established dominance — but such fire may also signal exhaustion, making it a potential supply barrier if price returns.
These Supply Zones are areas where:
Sellers are likely to re-engage
Smart money may be unloading
Future resistance can be anticipated
But unlike traditional indicators, this tool doesn’t guess. It reacts only to a clear volume-based event — when market energy surges — and locks in that awareness through zone marking.
🟢 Demand = "Prithvi" — The Grounding of Price
On the other hand, a bearish candle with extremely high volume represents the Earth (Prithvi) — grounding the price with firm hands. A strong volume drop often means buyers are stepping in, absorbing the selling pressure.
These Demand Zones are areas where:
Buying interest is proven
Market memory is stored
Future support can be expected
By respecting these zones, you're aligning your trading with natural market boundaries — not theoretical ones.
🧠 How Is It Different from Regular Volume Tools?
While most volume indicators show bars on a lower panel, they leave interpretation up to the trader. “High” or “low” becomes subjective.
Chaitanya Tattva Volume Zones is different:
It quantifies "spike": a bar must exceed all previous N volumes
It qualifies the intent: was the spike bullish or bearish?
It marks zones on the price chart: no need to guess levels
It preserves market memory: the zones persist visually for easy reference
In essence, this tool doesn’t just report volume — it interprets volume’s context and visually encodes it into the chart.
🧘 How to Use
1. Support/Resistance Mapping
Use the tool to understand where volume proved itself. If price revisits a red zone, expect possible rejection (resistance). If price revisits a green zone, expect possible absorption (support).
2. Entry Triggers
You may enter:
Long near demand zones if bullish confirmation appears
Short near supply zones if bearish confirmation appears
3. Stop Placement
Stops can be placed just beyond the zone boundary to align with areas where smart money historically defended.
4. Breakout Confidence
When price breaks through one of these zones with momentum, it often signals a new energetic wave — the old balance has been overcome.
🔔 Key Features
Volume spike detection across any timeframe
Clear visual zones — no clutter, no lag
Highly customizable: zone width, volume lookback, colors
Philosophy-aligned with supply and demand theory, Wyckoff, and Order Flow
🌌 A Metaphysical View of Volume
In yogic science, volume is akin to Prana — life-force energy. A market is not moved by price alone but by intent, force, and participation — all encoded in volume.
Just as a human body pulses with blood when action intensifies, the market pulses with volume when institutional decisions are made.
These pulses become sacred footprints — and Chaitanya Tattva Volume Zones helps you walk mindfully among them.
🔮 Final Thoughts
In a sea of indicators that shout at you with every tick, Chaitanya Tattva is calm. It speaks only when energy concentrates, only when the market sends a signal born of intent.
It doesn’t predict.
It doesn’t repaint.
It simply shows the truth, when the truth becomes undeniable.
Like a sage that speaks only when needed, it waits for volume to prove itself — then draws a memory into space, a zone where traders can re-align their actions with what the market has already honored.
Use it not just to trade —
But to listen.
To observe.
To follow the Chaitanya — the conscious pulse of the market’s own breath.

BK AK-SILENCER (P8N)🚨Introducing BK AK-SILENCER (P8N) — Institutional Order Flow Tracking for Silent Precision🚨
After months of meticulous tuning and refinement, I'm proud to unleash the next weapon in my trading arsenal—BK AK-SILENCER (P8N).
🔥 Why "AK-SILENCER"? The True Meaning
Institutions don’t announce their moves—they move silently, hidden beneath the noise. The SILENCER is built specifically to detect and track these stealth institutional maneuvers, giving you the power to hunt quietly, execute decisively, and strike precisely before the market catches on.
🔹 "AK" continues the legacy, honoring my mentor, A.K., whose teachings on discipline, precision, and clarity form the cornerstone of my trading.
🔹 "SILENCER" symbolizes the stealth aspect of institutional trading—quiet but deadly moves. This indicator equips you to silently track, expose, and capitalize on their hidden footprints.
🧠 What Exactly is BK AK-SILENCER (P8N)?
It's a next-generation Cumulative Volume Delta (CVD) tool crafted specifically for traders who hunt institutional order flow, combining adaptive volatility bands, enhanced momentum gradients, and precise divergence detection into a single deadly-accurate weapon.
Built for silent execution—tracking moves quietly and trading with lethal precision.
⚙️ Core Weapon Systems
✅ Institutional CVD Engine
→ Dynamically measures hidden volume shifts (buying/selling pressure) to reveal institutional footprints that price alone won't show.
✅ Adaptive AK-9 Bollinger Bands
→ Bollinger Bands placed around a custom CVD signal line, pinpointing exactly when institutional accumulation or distribution reaches critical extremes.
✅ Gradient Momentum Intelligence
→ Color-coded momentum gradients reveal the strength, speed, and silent intent behind institutional order flow:
🟢 Strong Bullish (aggressive buying)
🟡 Moderate Bullish (steady accumulation)
🔵 Neutral (balance)
🟠 Moderate Bearish (quiet distribution)
🔴 Strong Bearish (aggressive selling)
✅ Silent Divergence Detection
→ Instantly spots divergence between price and hidden volume—your earliest indication that institutions are stealthily reversing direction.
✅ Background Flash Alerts
→ Visually highlights institutional extremes through subtle background flashes, alerting you quietly yet powerfully when market-moving players make their silent moves.
✅ Structural & Institutional Clarity
→ Optional structural pivots, standard deviation bands, volume profile anchors, and session lines clearly identify the exact levels institutions defend or attack silently.
🛡️ Why BK AK-SILENCER (P8N) is Your Edge
🔹 Tracks Institutional Footprints—Silently identifies hidden volume signals of institutional intentions before they’re obvious.
🔹 Precision Execution—Cuts through noise, allowing you to execute silently, confidently, and precisely.
🔹 Perfect for Traders Using:
Elliott Wave
Gann Methods (Angles, Squares)
Fibonacci Time & Price
Harmonic Patterns
Market Profile & Order Flow Analysis
🎯 How to Use BK AK-SILENCER (P8N)
🔸 Institutional Reversal Hunting (Stealth Mode)
Bearish divergence + CVD breaking below lower BB → stealth short signal.
Bullish divergence + CVD breaking above upper BB → quiet, early long entry.
🔸 Momentum Confirmation (Silent Strength)
Strong bullish gradient + CVD above upper BB → follow institutional buying quietly.
Strong bearish gradient + CVD below lower BB → confidently short institutional selling.
🔸 Noise Filtering (Patience & Precision)
Neutral gradient (blue) → remain quiet, wait patiently to strike precisely when institutional activity resumes.
🔸 Structural Precision (Institutional Levels)
Optional StdDev, POC, Value Areas, Session Anchors clearly identify exact institutional defense/offense zones.
🙏 Final Thoughts
Institutions move in silence, leaving subtle footprints. BK AK-SILENCER (P8N) is your specialized weapon for tracking and hunting their quiet, decisive actions before the market reacts.
🔹 Dedicated in deep gratitude to my mentor, A.K.—whose silent wisdom shapes every line of code.
🔹 Engineered for the disciplined, quiet hunter who knows when to wait patiently and when to strike decisively.
Above all, honor and gratitude to Gd—the ultimate source of wisdom, clarity, and disciplined execution. Without Him, markets are chaos. With Him, we move silently, purposefully, and precisely.
⚡ Stay Quiet. Stay Precise. Hunt Silently.
🔥 BK AK-SILENCER (P8N) — Track the Silent Moves. Strike with Precision. 🔥
May Gd bless every silent step you take. 🙏

Contrarian RSIContrarian RSI Indicator
Pairs nicely with Contrarian 100 MA (optional hide/unhide buy/sell signals)
Description
The Contrarian RSI is a momentum-based technical indicator designed to identify potential reversal points in price action by combining a unique RSI calculation with a predictive range model inspired by the "Contrarian 5 Levels" logic. Unlike traditional RSI, which measures price momentum based solely on price changes, this indicator integrates a smoothed, weighted momentum calculation and predictive price ranges to generate contrarian signals. It is particularly suited for traders looking to capture reversals in trending or range-bound markets.
This indicator is versatile and can be used across various timeframes, though it performs best on higher timeframes (e.g., 1H, 4H, or Daily) due to reduced noise and more reliable signals. Lower timeframes may require additional testing and careful parameter tuning to optimize performance.
How It Works
The Contrarian RSI combines two primary components:
Predictive Ranges (5 Levels Logic): This calculates a smoothed price average that adapts to market volatility using an ATR-based mechanism. It helps identify significant price levels that act as potential support or resistance zones.
Contrarian RSI Calculation: A modified RSI calculation that uses weighted momentum from the predictive ranges to measure buying and selling pressure. The result is smoothed and paired with a user-defined moving average to generate clear signals.
The indicator generates buy (long) and sell (exit) signals based on crossovers and crossunders of user-defined overbought and oversold levels, making it ideal for contrarian trading strategies.
Calculation Overview
Predictive Ranges (5 Levels Logic):
Uses a custom function (pred_ranges) to calculate a dynamic price average (avg) based on the ATR (Average True Range) multiplied by a user-defined factor (mult).
The average adjusts only when the price moves beyond the ATR threshold, ensuring responsiveness to significant price changes while filtering out noise.
This calculation is performed on a user-specified timeframe (tf5Levels) for multi-timeframe analysis.
Contrarian RSI:
Compares consecutive predictive range values to calculate gains (g) and losses (l) over a user-defined period (crsiLength).
Applies a Gaussian weighting function (weight = math.exp(-math.pow(i / crsiLength, 2))) to prioritize recent price movements.
Computes a "wave ratio" (net_momentum / total_energy) to normalize momentum, which is then scaled to a 0–100 range (qrsi = 50 + 50 * wave_ratio).
Smooths the result with a 2-period EMA (qrsi_smoothed) for stability.
Moving Average:
Applies a user-selected moving average (SMA, EMA, WMA, SMMA, or VWMA) with a customizable length (maLength) to the smoothed RSI (qrsi_smoothed) to generate the final indicator value (qrsi_ma).
Signal Generation:
Long Entry: Triggered when qrsi_ma crosses above the oversold level (oversoldLevel, default: 1).
Long Exit: Triggered when qrsi_ma crosses below the overbought level (overboughtLevel, default: 99).
Entry and Exit Rules
Long Entry: Enter a long position when the Contrarian RSI (qrsi_ma) crosses above the oversold level (default: 1). This suggests the asset is potentially oversold and due for a reversal.
Long Exit: Exit the long position when the Contrarian RSI (qrsi_ma) crosses below the overbought level (default: 99), indicating a potential overbought condition and a reversal to the downside.
Customization: Adjust overboughtLevel and oversoldLevel to fine-tune sensitivity. Lower timeframes may benefit from tighter levels (e.g., 20 for oversold, 80 for overbought), while higher timeframes can use extreme levels (e.g., 1 and 99) for stronger reversals.
Timeframe Considerations
Higher Timeframes (Recommended): The indicator is optimized for higher timeframes (e.g., 1H, 4H, Daily) due to its reliance on predictive ranges and smoothed momentum, which perform best with less market noise. These timeframes typically yield more reliable reversal signals.
Lower Timeframes: The indicator can be used on lower timeframes (e.g., 5M, 15M), but signals may be noisier and require additional confirmation (e.g., from price action or other indicators). Extensive backtesting and parameter optimization (e.g., adjusting crsiLength, maLength, or mult) are recommended for lower timeframes.
Inputs
Contrarian RSI Length (crsiLength): Length for RSI momentum calculation (default: 5).
RSI MA Length (maLength): Length of the moving average applied to the RSI (default: 1, effectively no MA).
MA Type (maType): Choose from SMA, EMA, WMA, SMMA, or VWMA (default: SMA).
Overbought Level (overboughtLevel): Upper threshold for exit signals (default: 99).
Oversold Level (oversoldLevel): Lower threshold for entry signals (default: 1).
Plot Signals on Main Chart (plotOnChart): Toggle to display signals on the price chart or the indicator panel (default: false).
Plotted on Lower:
Plotted on Chart:
5 Levels Length (length5Levels): Length for predictive range calculation (default: 200).
Factor (mult): ATR multiplier for predictive ranges (default: 6.0).
5 Levels Timeframe (tf5Levels): Timeframe for predictive range calculation (default: chart timeframe).
Visuals
Contrarian RSI MA: Plotted as a yellow line, representing the smoothed Contrarian RSI with the applied moving average.
Overbought/Oversold Lines: Red line for overbought (default: 99) and green line for oversold (default: 1).
Signals: Blue circles for long entries, white circles for long exits. Signals can be plotted on the main chart (plotOnChart = true) or the indicator panel (plotOnChart = false).
Usage Notes
Use the indicator in conjunction with other tools (e.g., support/resistance, trendlines, or volume) to confirm signals.
Test extensively on your chosen timeframe and asset to optimize parameters like crsiLength, maLength, and mult.
Be cautious with lower timeframes, as false signals may occur due to market noise.
The indicator is designed for contrarian strategies, so it works best in markets with clear reversal patterns.
Disclaimer
This indicator is provided for educational and informational purposes only. Always conduct thorough backtesting and risk management before using any indicator in live trading. The author is not responsible for any financial losses incurred.

Bitcoin Power Law [LuxAlgo]The Bitcoin Power Law tool is a representation of Bitcoin prices first proposed by Giovanni Santostasi, Ph.D. It plots BTCUSD daily closes on a log10-log10 scale, and fits a linear regression channel to the data.
This channel helps traders visualise when the price is historically in a zone prone to tops or located within a discounted zone subject to future growth.
🔶 USAGE
Giovanni Santostasi, Ph.D. originated the Bitcoin Power-Law Theory; this implementation places it directly on a TradingView chart. The white line shows the daily closing price, while the cyan line is the best-fit regression.
A channel is constructed from the linear fit root mean squared error (RMSE), we can observe how price has repeatedly oscillated between each channel areas through every bull-bear cycle.
Excursions into the upper channel area can be followed by price surges and finishing on a top, whereas price touching the lower channel area coincides with a cycle low.
Users can change the channel areas multipliers, helping capture moves more precisely depending on the intended usage.
This tool only works on the daily BTCUSD chart. Ticker and timeframe must match exactly for the calculations to remain valid.
🔹 Linear Scale
Users can toggle on a linear scale for the time axis, in order to obtain a higher resolution of the price, (this will affect the linear regression channel fit, making it look poorer).
🔶 DETAILS
One of the advantages of the Power Law Theory proposed by Giovanni Santostasi is its ability to explain multiple behaviors of Bitcoin. We describe some key points below.
🔹 Power-Law Overview
A power law has the form y = A·xⁿ , and Bitcoin’s key variables follow this pattern across many orders of magnitude. Empirically, price rises roughly with t⁶, hash-rate with t¹² and the number of active addresses with t³.
When we plot these on log-log axes they appear as straight lines, revealing a scale-invariant system whose behaviour repeats proportionally as it grows.
🔹 Feedback-Loop Dynamics
Growth begins with new users, whose presence pushes the price higher via a Metcalfe-style square-law. A richer price pool funds more mining hardware; the Difficulty Adjustment immediately raises the hash-rate requirement, keeping profit margins razor-thin.
A higher hash rate secures the network, which in turn attracts the next wave of users. Because risk and Difficulty act as braking forces, user adoption advances as a power of three in time rather than an unchecked S-curve. This circular causality repeats without end, producing the familiar boom-and-bust cadence around the long-term power-law channel.
🔹 Scale Invariance & Predictions
Scale invariance means that enlarging the timeline in log-log space leaves the trajectory unchanged.
The same geometric proportions that described the first dollar of value can therefore extend to a projected million-dollar bitcoin, provided no catastrophic break occurs. Institutional ETF inflows supply fresh capital but do not bend the underlying slope; only a persistent deviation from the line would falsify the current model.
🔹 Implications
The theory assigns scarcity no direct role; iterative feedback and the Difficulty Adjustment are sufficient to govern Bitcoin’s expansion. Long-term valuation should focus on position within the power-law channel, while bubbles—sharp departures above trend that later revert—are expected punctuations of an otherwise steady climb.
Beyond about 2040, disruptive technological shifts could alter the parameters, but for the next order of magnitude the present slope remains the simplest, most robust guide.
Bitcoin behaves less like a traditional asset and more like a self-organising digital organism whose value, security, and adoption co-evolve according to immutable power-law rules.
🔶 SETTINGS
🔹 General
Start Calculation: Determine the start date used by the calculation, with any prior prices being ignored. (default - 15 Jul 2010)
Use Linear Scale for X-Axis: Convert the horizontal axis from log(time) to linear calendar time
🔹 Linear Regression
Show Regression Line: Enable/disable the central power-law trend line
Regression Line Color: Choose the colour of the regression line
Mult 1: Toggle line & fill, set multiplier (default +1), pick line colour and area fill colour
Mult 2: Toggle line & fill, set multiplier (default +0.5), pick line colour and area fill colour
Mult 3: Toggle line & fill, set multiplier (default -0.5), pick line colour and area fill colour
Mult 4: Toggle line & fill, set multiplier (default -1), pick line colour and area fill colour
🔹 Style
Price Line Color: Select the colour of the BTC price plot
Auto Color: Automatically choose the best contrast colour for the price line
Price Line Width: Set the thickness of the price line (1 – 5 px)
Show Halvings: Enable/disable dotted vertical lines at each Bitcoin halving
Halvings Color: Choose the colour of the halving lines

Anomalous Holonomy Field Theory🌌 Anomalous Holonomy Field Theory (AHFT) - Revolutionary Quantum Market Analysis
Where Theoretical Physics Meets Trading Reality
A Groundbreaking Synthesis of Differential Geometry, Quantum Field Theory, and Market Dynamics
🔬 THEORETICAL FOUNDATION - THE MATHEMATICS OF MARKET REALITY
The Anomalous Holonomy Field Theory represents an unprecedented fusion of advanced mathematical physics with practical market analysis. This isn't merely another indicator repackaging old concepts - it's a fundamentally new lens through which to view and understand market structure .
1. HOLONOMY GROUPS (Differential Geometry)
In differential geometry, holonomy measures how vectors change when parallel transported around closed loops in curved space. Applied to markets:
Mathematical Formula:
H = P exp(∮_C A_μ dx^μ)
Where:
P = Path ordering operator
A_μ = Market connection (price-volume gauge field)
C = Closed price path
Market Implementation:
The holonomy calculation measures how price "remembers" its journey through market space. When price returns to a previous level, the holonomy captures what has changed in the market's internal geometry. This reveals:
Hidden curvature in the market manifold
Topological obstructions to arbitrage
Geometric phase accumulated during price cycles
2. ANOMALY DETECTION (Quantum Field Theory)
Drawing from the Adler-Bell-Jackiw anomaly in quantum field theory:
Mathematical Formula:
∂_μ j^μ = (e²/16π²)F_μν F̃^μν
Where:
j^μ = Market current (order flow)
F_μν = Field strength tensor (volatility structure)
F̃^μν = Dual field strength
Market Application:
Anomalies represent symmetry breaking in market structure - moments when normal patterns fail and extraordinary opportunities arise. The system detects:
Spontaneous symmetry breaking (trend reversals)
Vacuum fluctuations (volatility clusters)
Non-perturbative effects (market crashes/melt-ups)
3. GAUGE THEORY (Theoretical Physics)
Markets exhibit gauge invariance - the fundamental physics remains unchanged under certain transformations:
Mathematical Formula:
A'_μ = A_μ + ∂_μΛ
This ensures our signals are gauge-invariant observables , immune to arbitrary market "coordinate changes" like gaps or reference point shifts.
4. TOPOLOGICAL DATA ANALYSIS
Using persistent homology and Morse theory:
Mathematical Formula:
β_k = dim(H_k(X))
Where β_k are the Betti numbers describing topological features that persist across scales.
🎯 REVOLUTIONARY SIGNAL CONFIGURATION
Signal Sensitivity (0.5-12.0, default 2.5)
Controls the responsiveness of holonomy field calculations to market conditions. This parameter directly affects the threshold for detecting quantum phase transitions in price action.
Optimization by Timeframe:
Scalping (1-5min): 1.5-3.0 for rapid signal generation
Day Trading (15min-1H): 2.5-5.0 for balanced sensitivity
Swing Trading (4H-1D): 5.0-8.0 for high-quality signals only
Score Amplifier (10-200, default 50)
Scales the raw holonomy field strength to produce meaningful signal values. Higher values amplify weak signals in low-volatility environments.
Signal Confirmation Toggle
When enabled, enforces additional technical filters (EMA and RSI alignment) to reduce false positives. Essential for conservative strategies.
Minimum Bars Between Signals (1-20, default 5)
Prevents overtrading by enforcing quantum decoherence time between signals. Higher values reduce whipsaws in choppy markets.
👑 ELITE EXECUTION SYSTEM
Execution Modes:
Conservative Mode:
Stricter signal criteria
Higher quality thresholds
Ideal for stable market conditions
Adaptive Mode:
Self-adjusting parameters
Balances signal frequency with quality
Recommended for most traders
Aggressive Mode:
Maximum signal sensitivity
Captures rapid market moves
Best for experienced traders in volatile conditions
Dynamic Position Sizing:
When enabled, the system scales position size based on:
Holonomy field strength
Current volatility regime
Recent performance metrics
Advanced Exit Management:
Implements trailing stops based on ATR and signal strength, with mode-specific multipliers for optimal profit capture.
🧠 ADAPTIVE INTELLIGENCE ENGINE
Self-Learning System:
The strategy analyzes recent trade outcomes and adjusts:
Risk multipliers based on win/loss ratios
Signal weights according to performance
Market regime detection for environmental adaptation
Learning Speed (0.05-0.3):
Controls adaptation rate. Higher values = faster learning but potentially unstable. Lower values = stable but slower adaptation.
Performance Window (20-100 trades):
Number of recent trades analyzed for adaptation. Longer windows provide stability, shorter windows increase responsiveness.
🎨 REVOLUTIONARY VISUAL SYSTEM
1. Holonomy Field Visualization
What it shows: Multi-layer quantum field bands representing market resonance zones
How to interpret:
Blue/Purple bands = Primary holonomy field (strongest resonance)
Band width = Field strength and volatility
Price within bands = Normal quantum state
Price breaking bands = Quantum phase transition
Trading application: Trade reversals at band extremes, breakouts on band violations with strong signals.
2. Quantum Portals
What they show: Entry signals with recursive depth patterns indicating momentum strength
How to interpret:
Upward triangles with portals = Long entry signals
Downward triangles with portals = Short entry signals
Portal depth = Signal strength and expected momentum
Color intensity = Probability of success
Trading application: Enter on portal appearance, with size proportional to portal depth.
3. Field Resonance Bands
What they show: Fibonacci-based harmonic price zones where quantum resonance occurs
How to interpret:
Dotted circles = Minor resonance levels
Solid circles = Major resonance levels
Color coding = Resonance strength
Trading application: Use as dynamic support/resistance, expect reactions at resonance zones.
4. Anomaly Detection Grid
What it shows: Fractal-based support/resistance with anomaly strength calculations
How to interpret:
Triple-layer lines = Major fractal levels with high anomaly probability
Labels show: Period (H8-H55), Price, and Anomaly strength (φ)
⚡ symbol = Extreme anomaly detected
● symbol = Strong anomaly
○ symbol = Normal conditions
Trading application: Expect major moves when price approaches high anomaly levels. Use for precise entry/exit timing.
5. Phase Space Flow
What it shows: Background heatmap revealing market topology and energy
How to interpret:
Dark background = Low market energy, range-bound
Purple glow = Building energy, trend developing
Bright intensity = High energy, strong directional move
Trading application: Trade aggressively in bright phases, reduce activity in dark phases.
📊 PROFESSIONAL DASHBOARD METRICS
Holonomy Field Strength (-100 to +100)
What it measures: The Wilson loop integral around price paths
>70: Strong positive curvature (bullish vortex)
<-70: Strong negative curvature (bearish collapse)
Near 0: Flat connection (range-bound)
Anomaly Level (0-100%)
What it measures: Quantum vacuum expectation deviation
>70%: Major anomaly (phase transition imminent)
30-70%: Moderate anomaly (elevated volatility)
<30%: Normal quantum fluctuations
Quantum State (-1, 0, +1)
What it measures: Market wave function collapse
+1: Bullish eigenstate |↑⟩
0: Superposition (uncertain)
-1: Bearish eigenstate |↓⟩
Signal Quality Ratings
LEGENDARY: All quantum fields aligned, maximum probability
EXCEPTIONAL: Strong holonomy with anomaly confirmation
STRONG: Good field strength, moderate anomaly
MODERATE: Decent signals, some uncertainty
WEAK: Minimal edge, high quantum noise
Performance Metrics
Win Rate: Rolling performance with emoji indicators
Daily P&L: Real-time profit tracking
Adaptive Risk: Current risk multiplier status
Market Regime: Bull/Bear classification
🏆 WHY THIS CHANGES EVERYTHING
Traditional technical analysis operates on 100-year-old principles - moving averages, support/resistance, and pattern recognition. These work because many traders use them, creating self-fulfilling prophecies.
AHFT transcends this limitation by analyzing markets through the lens of fundamental physics:
Markets have geometry - The holonomy calculations reveal this hidden structure
Price has memory - The geometric phase captures path-dependent effects
Anomalies are predictable - Quantum field theory identifies symmetry breaking
Everything is connected - Gauge theory unifies disparate market phenomena
This isn't just a new indicator - it's a new way of thinking about markets . Just as Einstein's relativity revolutionized physics beyond Newton's mechanics, AHFT revolutionizes technical analysis beyond traditional methods.
🔧 OPTIMAL SETTINGS FOR MNQ 10-MINUTE
For the Micro E-mini Nasdaq-100 on 10-minute timeframe:
Signal Sensitivity: 2.5-3.5
Score Amplifier: 50-70
Execution Mode: Adaptive
Min Bars Between: 3-5
Theme: Quantum Nebula or Dark Matter
💭 THE JOURNEY - FROM IMPOSSIBLE THEORY TO TRADING REALITY
Creating AHFT was a mathematical odyssey that pushed the boundaries of what's possible in Pine Script. The journey began with a seemingly impossible question: Could the profound mathematical structures of theoretical physics be translated into practical trading tools?
The Theoretical Challenge:
Months were spent diving deep into differential geometry textbooks, studying the works of Chern, Simons, and Witten. The mathematics of holonomy groups and gauge theory had never been applied to financial markets. Translating abstract mathematical concepts like parallel transport and fiber bundles into discrete price calculations required novel approaches and countless failed attempts.
The Computational Nightmare:
Pine Script wasn't designed for quantum field theory calculations. Implementing the Wilson loop integral, managing complex array structures for anomaly detection, and maintaining computational efficiency while calculating geometric phases pushed the language to its limits. There were moments when the entire project seemed impossible - the script would timeout, produce nonsensical results, or simply refuse to compile.
The Breakthrough Moments:
After countless sleepless nights and thousands of lines of code, breakthrough came through elegant simplifications. The realization that market anomalies follow patterns similar to quantum vacuum fluctuations led to the revolutionary anomaly detection system. The discovery that price paths exhibit holonomic memory unlocked the geometric phase calculations.
The Visual Revolution:
Creating visualizations that could represent 4-dimensional quantum fields on a 2D chart required innovative approaches. The multi-layer holonomy field, recursive quantum portals, and phase space flow representations went through dozens of iterations before achieving the perfect balance of beauty and functionality.
The Balancing Act:
Perhaps the greatest challenge was maintaining mathematical rigor while ensuring practical trading utility. Every formula had to be both theoretically sound and computationally efficient. Every visual had to be both aesthetically pleasing and information-rich.
The result is more than a strategy - it's a synthesis of pure mathematics and market reality that reveals the hidden order within apparent chaos.
📚 INTEGRATED DOCUMENTATION
Once applied to your chart, AHFT includes comprehensive tooltips on every input parameter. The source code contains detailed explanations of the mathematical theory, practical applications, and optimization guidelines. This published description provides the overview - the indicator itself is a complete educational resource.
⚠️ RISK DISCLAIMER
While AHFT employs advanced mathematical models derived from theoretical physics, markets remain inherently unpredictable. No mathematical model, regardless of sophistication, can guarantee future results. This strategy uses realistic commission ($0.62 per contract) and slippage (1 tick) in all calculations. Past performance does not guarantee future results. Always use appropriate risk management and never risk more than you can afford to lose.
🌟 CONCLUSION
The Anomalous Holonomy Field Theory represents a quantum leap in technical analysis - literally. By applying the profound insights of differential geometry, quantum field theory, and gauge theory to market analysis, AHFT reveals structure and opportunities invisible to traditional methods.
From the holonomy calculations that capture market memory to the anomaly detection that identifies phase transitions, from the adaptive intelligence that learns and evolves to the stunning visualizations that make the invisible visible, every component works in mathematical harmony.
This is more than a trading strategy. It's a new lens through which to view market reality.
Trade with the precision of physics. Trade with the power of mathematics. Trade with AHFT.
I hope this serves as a good replacement for Quantum Edge Pro - Adaptive AI until I'm able to fix it.
— Dskyz, Trade with insight. Trade with anticipation.

Smart Session ConceptSmart Session Concept — Intelligent Trading Session Overlay
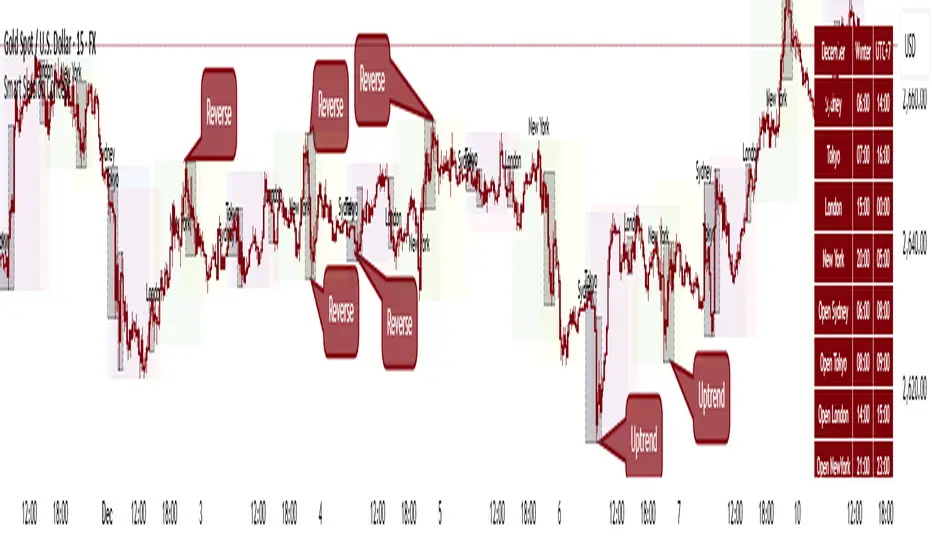
Smart Session Concept is designed to detect major reversal points and key price pivots formed on higher timeframes, particularly during high-volume periods of the day — often marking the footprints of institutional orders and whales.
🔍 Key Features:
Displays standard sessions (Asian, London, New York) and allows adding custom time sessions.
Offers two visualization modes:
Time session table
Visual session boxes plotted on the chart
Auto-sync with seasonal time changes (Summer/Winter), supports Daylight Saving Time (DST)
Full flexibility:
Toggle table, boxes, and labels on/off
Customize colors for all session elements
Choose which months are considered summer/winter
💡 Suggested Use Case:
Use Smart Session Sync to pinpoint critical price structures such as:
Peaks and troughs of trending waves
Highs/lows in Wyckoff trading ranges
Liquidity sweeps or untouched liquidity zones
----------------------
Risk-Adjusted Momentum Oscillator# Risk-Adjusted Momentum Oscillator (RAMO): Momentum Analysis with Integrated Risk Assessment
## 1. Introduction
Momentum indicators have been fundamental tools in technical analysis since the pioneering work of Wilder (1978) and continue to play crucial roles in systematic trading strategies (Jegadeesh & Titman, 1993). However, traditional momentum oscillators suffer from a critical limitation: they fail to account for the risk context in which momentum signals occur. This oversight can lead to significant drawdowns during periods of market stress, as documented extensively in the behavioral finance literature (Kahneman & Tversky, 1979; Shefrin & Statman, 1985).
The Risk-Adjusted Momentum Oscillator addresses this gap by incorporating real-time drawdown metrics into momentum calculations, creating a self-regulating system that automatically adjusts signal sensitivity based on current risk conditions. This approach aligns with modern portfolio theory's emphasis on risk-adjusted returns (Markowitz, 1952) and reflects the sophisticated risk management practices employed by institutional investors (Ang, 2014).
## 2. Theoretical Foundation
### 2.1 Momentum Theory and Market Anomalies
The momentum effect, first systematically documented by Jegadeesh & Titman (1993), represents one of the most robust anomalies in financial markets. Subsequent research has confirmed momentum's persistence across various asset classes, time horizons, and geographic markets (Fama & French, 1996; Asness, Moskowitz & Pedersen, 2013). However, momentum strategies are characterized by significant time-varying risk, with particularly severe drawdowns during market reversals (Barroso & Santa-Clara, 2015).
### 2.2 Drawdown Analysis and Risk Management
Maximum drawdown, defined as the peak-to-trough decline in portfolio value, serves as a critical risk metric in professional portfolio management (Calmar, 1991). Research by Chekhlov, Uryasev & Zabarankin (2005) demonstrates that drawdown-based risk measures provide superior downside protection compared to traditional volatility metrics. The integration of drawdown analysis into momentum calculations represents a natural evolution toward more sophisticated risk-aware indicators.
### 2.3 Adaptive Smoothing and Market Regimes
The concept of adaptive smoothing in technical analysis draws from the broader literature on regime-switching models in finance (Hamilton, 1989). Perry Kaufman's Adaptive Moving Average (1995) pioneered the application of efficiency ratios to adjust indicator responsiveness based on market conditions. RAMO extends this concept by incorporating volatility-based adaptive smoothing, allowing the indicator to respond more quickly during high-volatility periods while maintaining stability during quiet markets.
## 3. Methodology
### 3.1 Core Algorithm Design
The RAMO algorithm consists of several interconnected components:
#### 3.1.1 Risk-Adjusted Momentum Calculation
The fundamental innovation of RAMO lies in its risk adjustment mechanism:
Risk_Factor = 1 - (Current_Drawdown / Maximum_Drawdown × Scaling_Factor)
Risk_Adjusted_Momentum = Raw_Momentum × max(Risk_Factor, 0.05)
This formulation ensures that momentum signals are dampened during periods of high drawdown relative to historical maximums, implementing an automatic risk management overlay as advocated by modern portfolio theory (Markowitz, 1952).
#### 3.1.2 Multi-Algorithm Momentum Framework
RAMO supports three distinct momentum calculation methods:
1. Rate of Change: Traditional percentage-based momentum (Pring, 2002)
2. Price Momentum: Absolute price differences
3. Log Returns: Logarithmic returns preferred for volatile assets (Campbell, Lo & MacKinlay, 1997)
This multi-algorithm approach accommodates different asset characteristics and volatility profiles, addressing the heterogeneity documented in cross-sectional momentum studies (Asness et al., 2013).
### 3.2 Leading Indicator Components
#### 3.2.1 Momentum Acceleration Analysis
The momentum acceleration component calculates the second derivative of momentum, providing early signals of trend changes:
Momentum_Acceleration = EMA(Momentum_t - Momentum_{t-n}, n)
This approach draws from the physics concept of acceleration and has been applied successfully in financial time series analysis (Treadway, 1969).
#### 3.2.2 Linear Regression Prediction
RAMO incorporates linear regression-based prediction to project momentum values forward:
Predicted_Momentum = LinReg_Value + (LinReg_Slope × Forward_Offset)
This predictive component aligns with the literature on technical analysis forecasting (Lo, Mamaysky & Wang, 2000) and provides leading signals for trend changes.
#### 3.2.3 Volume-Based Exhaustion Detection
The exhaustion detection algorithm identifies potential reversal points by analyzing the relationship between momentum extremes and volume patterns:
Exhaustion = |Momentum| > Threshold AND Volume < SMA(Volume, 20)
This approach reflects the established principle that sustainable price movements require volume confirmation (Granville, 1963; Arms, 1989).
### 3.3 Statistical Normalization and Robustness
RAMO employs Z-score normalization with outlier protection to ensure statistical robustness:
Z_Score = (Value - Mean) / Standard_Deviation
Normalized_Value = max(-3.5, min(3.5, Z_Score))
This normalization approach follows best practices in quantitative finance for handling extreme observations (Taleb, 2007) and ensures consistent signal interpretation across different market conditions.
### 3.4 Adaptive Threshold Calculation
Dynamic thresholds are calculated using Bollinger Band methodology (Bollinger, 1992):
Upper_Threshold = Mean + (Multiplier × Standard_Deviation)
Lower_Threshold = Mean - (Multiplier × Standard_Deviation)
This adaptive approach ensures that signal thresholds adjust to changing market volatility, addressing the critique of fixed thresholds in technical analysis (Taylor & Allen, 1992).
## 4. Implementation Details
### 4.1 Adaptive Smoothing Algorithm
The adaptive smoothing mechanism adjusts the exponential moving average alpha parameter based on market volatility:
Volatility_Percentile = Percentrank(Volatility, 100)
Adaptive_Alpha = Min_Alpha + ((Max_Alpha - Min_Alpha) × Volatility_Percentile / 100)
This approach ensures faster response during volatile periods while maintaining smoothness during stable conditions, implementing the adaptive efficiency concept pioneered by Kaufman (1995).
### 4.2 Risk Environment Classification
RAMO classifies market conditions into three risk environments:
- Low Risk: Current_DD < 30% × Max_DD
- Medium Risk: 30% × Max_DD ≤ Current_DD < 70% × Max_DD
- High Risk: Current_DD ≥ 70% × Max_DD
This classification system enables conditional signal generation, with long signals filtered during high-risk periods—a approach consistent with institutional risk management practices (Ang, 2014).
## 5. Signal Generation and Interpretation
### 5.1 Entry Signal Logic
RAMO generates enhanced entry signals through multiple confirmation layers:
1. Primary Signal: Crossover between indicator and signal line
2. Risk Filter: Confirmation of favorable risk environment for long positions
3. Leading Component: Early warning signals via acceleration analysis
4. Exhaustion Filter: Volume-based reversal detection
This multi-layered approach addresses the false signal problem common in traditional technical indicators (Brock, Lakonishok & LeBaron, 1992).
### 5.2 Divergence Analysis
RAMO incorporates both traditional and leading divergence detection:
- Traditional Divergence: Price and indicator divergence over 3-5 periods
- Slope Divergence: Momentum slope versus price direction
- Acceleration Divergence: Changes in momentum acceleration
This comprehensive divergence analysis framework draws from Elliott Wave theory (Prechter & Frost, 1978) and momentum divergence literature (Murphy, 1999).
## 6. Empirical Advantages and Applications
### 6.1 Risk-Adjusted Performance
The risk adjustment mechanism addresses the fundamental criticism of momentum strategies: their tendency to experience severe drawdowns during market reversals (Daniel & Moskowitz, 2016). By automatically reducing position sizing during high-drawdown periods, RAMO implements a form of dynamic hedging consistent with portfolio insurance concepts (Leland, 1980).
### 6.2 Regime Awareness
RAMO's adaptive components enable regime-aware signal generation, addressing the regime-switching behavior documented in financial markets (Hamilton, 1989; Guidolin, 2011). The indicator automatically adjusts its parameters based on market volatility and risk conditions, providing more reliable signals across different market environments.
### 6.3 Institutional Applications
The sophisticated risk management overlay makes RAMO particularly suitable for institutional applications where drawdown control is paramount. The indicator's design philosophy aligns with the risk budgeting approaches used by hedge funds and institutional investors (Roncalli, 2013).
## 7. Limitations and Future Research
### 7.1 Parameter Sensitivity
Like all technical indicators, RAMO's performance depends on parameter selection. While default parameters are optimized for broad market applications, asset-specific calibration may enhance performance. Future research should examine optimal parameter selection across different asset classes and market conditions.
### 7.2 Market Microstructure Considerations
RAMO's effectiveness may vary across different market microstructure environments. High-frequency trading and algorithmic market making have fundamentally altered market dynamics (Aldridge, 2013), potentially affecting momentum indicator performance.
### 7.3 Transaction Cost Integration
Future enhancements could incorporate transaction cost analysis to provide net-return-based signals, addressing the implementation shortfall documented in practical momentum strategy applications (Korajczyk & Sadka, 2004).
## References
Aldridge, I. (2013). *High-Frequency Trading: A Practical Guide to Algorithmic Strategies and Trading Systems*. 2nd ed. Hoboken, NJ: John Wiley & Sons.
Ang, A. (2014). *Asset Management: A Systematic Approach to Factor Investing*. New York: Oxford University Press.
Arms, R. W. (1989). *The Arms Index (TRIN): An Introduction to the Volume Analysis of Stock and Bond Markets*. Homewood, IL: Dow Jones-Irwin.
Asness, C. S., Moskowitz, T. J., & Pedersen, L. H. (2013). Value and momentum everywhere. *Journal of Finance*, 68(3), 929-985.
Barroso, P., & Santa-Clara, P. (2015). Momentum has its moments. *Journal of Financial Economics*, 116(1), 111-120.
Bollinger, J. (1992). *Bollinger on Bollinger Bands*. New York: McGraw-Hill.
Brock, W., Lakonishok, J., & LeBaron, B. (1992). Simple technical trading rules and the stochastic properties of stock returns. *Journal of Finance*, 47(5), 1731-1764.
Calmar, T. (1991). The Calmar ratio: A smoother tool. *Futures*, 20(1), 40.
Campbell, J. Y., Lo, A. W., & MacKinlay, A. C. (1997). *The Econometrics of Financial Markets*. Princeton, NJ: Princeton University Press.
Chekhlov, A., Uryasev, S., & Zabarankin, M. (2005). Drawdown measure in portfolio optimization. *International Journal of Theoretical and Applied Finance*, 8(1), 13-58.
Daniel, K., & Moskowitz, T. J. (2016). Momentum crashes. *Journal of Financial Economics*, 122(2), 221-247.
Fama, E. F., & French, K. R. (1996). Multifactor explanations of asset pricing anomalies. *Journal of Finance*, 51(1), 55-84.
Granville, J. E. (1963). *Granville's New Key to Stock Market Profits*. Englewood Cliffs, NJ: Prentice-Hall.
Guidolin, M. (2011). Markov switching models in empirical finance. In D. N. Drukker (Ed.), *Missing Data Methods: Time-Series Methods and Applications* (pp. 1-86). Bingley: Emerald Group Publishing.
Hamilton, J. D. (1989). A new approach to the economic analysis of nonstationary time series and the business cycle. *Econometrica*, 57(2), 357-384.
Jegadeesh, N., & Titman, S. (1993). Returns to buying winners and selling losers: Implications for stock market efficiency. *Journal of Finance*, 48(1), 65-91.
Kahneman, D., & Tversky, A. (1979). Prospect theory: An analysis of decision under risk. *Econometrica*, 47(2), 263-291.
Kaufman, P. J. (1995). *Smarter Trading: Improving Performance in Changing Markets*. New York: McGraw-Hill.
Korajczyk, R. A., & Sadka, R. (2004). Are momentum profits robust to trading costs? *Journal of Finance*, 59(3), 1039-1082.
Leland, H. E. (1980). Who should buy portfolio insurance? *Journal of Finance*, 35(2), 581-594.
Lo, A. W., Mamaysky, H., & Wang, J. (2000). Foundations of technical analysis: Computational algorithms, statistical inference, and empirical implementation. *Journal of Finance*, 55(4), 1705-1765.
Markowitz, H. (1952). Portfolio selection. *Journal of Finance*, 7(1), 77-91.
Murphy, J. J. (1999). *Technical Analysis of the Financial Markets: A Comprehensive Guide to Trading Methods and Applications*. New York: New York Institute of Finance.
Prechter, R. R., & Frost, A. J. (1978). *Elliott Wave Principle: Key to Market Behavior*. Gainesville, GA: New Classics Library.
Pring, M. J. (2002). *Technical Analysis Explained: The Successful Investor's Guide to Spotting Investment Trends and Turning Points*. 4th ed. New York: McGraw-Hill.
Roncalli, T. (2013). *Introduction to Risk Parity and Budgeting*. Boca Raton, FL: CRC Press.
Shefrin, H., & Statman, M. (1985). The disposition to sell winners too early and ride losers too long: Theory and evidence. *Journal of Finance*, 40(3), 777-790.
Taleb, N. N. (2007). *The Black Swan: The Impact of the Highly Improbable*. New York: Random House.
Taylor, M. P., & Allen, H. (1992). The use of technical analysis in the foreign exchange market. *Journal of International Money and Finance*, 11(3), 304-314.
Treadway, A. B. (1969). On rational entrepreneurial behavior and the demand for investment. *Review of Economic Studies*, 36(2), 227-239.
Wilder, J. W. (1978). *New Concepts in Technical Trading Systems*. Greensboro, NC: Trend Research.

BK AK-Scope🔭 Introducing BK AK-Scope — Target Locked. Signal Acquired. 🔭
After building five precision weapons for traders, I’m proud to unveil the sixth.
BK AK-Scope — the eye of the arsenal.
This is not just an indicator. It’s an intelligence system for volatility, signal clarity, and rate-of-change dynamics — forged for elite vision in any market terrain.
🧠 Why “Scope”? And Why “AK”?
Every shooter knows: you can’t hit what you can’t see.
The Scope brings range, clarity, and target distinction. It filters motion from noise. Purpose from panic.
“AK” continues to honor the man who trained my sight — my mentor, A.K.
His discipline taught me to wait for alignment. To move with reason, not emotion.
His vision lives in every code line here.
🔬 What Is BK AK-Scope?
A Triple-Tier TSI Correlation Engine, fused with adaptive opacity logic, a volatility scoring system, and real-time signal clarity. It’s momentum dissected — by speed, depth, and rate of change.
Built to serve traders who:
Need visual hierarchy between fast, mid, and slow TSI responses.
Want adaptive fills that pulse with volatility — not static zones.
Require a volatility scoring overlay that reads the battlefield in real time.
⚙️ Core Systems: How BK AK-Scope Works
✅ Fast/Mid/Slow TSI →
Three layers of correlation: like scopes with zoom levels.
You track micro moves, mid swings, and macro flow simultaneously.
✅ Rate-of-Change Adaptive Opacity →
Momentum fills fade or flash based on speed — giving you movement density at a glance.
Bull vs. Bear zones adapt to strength. You feel the market’s pulse.
✅ Volatility Score Intelligence →
Custom algorithm measuring:
Range expansion
Rate-of-change differentials
ATR dynamics
Standard deviation pressure
All combined into a score from 0–100 with live icons:
🔥 = Extreme Heat (70+)
🧊 = Cold Zone (<30)
⚠️ = ROC Warning
• = Neutral drift
✅ Auto-Detect Volatility Modes →
Scalp = <15min
Swing = intraday/hourly
Macro = daily/weekly
Or override manually with total control.
🎯 How To Use BK AK-Scope
🔹 Trend Continuation → When all three TSI layers align in direction + volatility score climbs, ride with the trend.
🔹 Early Reversals → Opposing TSI + rapid opacity change + volatility shift = sniper reversal zone.
🔹 Consolidation Filter → Neutral fills + score < 30 = stay out, wait for signal surge.
🔹 Signal Confluence → Pair with:
• Gann fans or angles
• Fib time/price clusters
• Elliott Wave structure
• Harmonics or divergence
To isolate entry perfection.
🛡️ Why This Indicator Changes the Game
It's not just momentum. It’s TSI with depth hierarchy.
It’s not just color. It’s real-time strength visualization.
It’s not just volatility. It’s rate-weighted market intelligence.
This is market optics for the advanced trader — built for vision, clarity, and discipline.
🙏 Final Thoughts
🔹 In honor of A.K., my mentor. The man who taught me to see what others miss.
🔹 Inspired by the power of vision — because execution without clarity is chaos.
🔹 Powered by faith — because Gd alone gives sight beyond the visible.
“He gives sight to the blind and wisdom to the humble.” — Psalms 146
Every tool I build is a prayer in code — that it helps someone trade with clarity, integrity, and precision.
⚡ Zoom In. Focus Deep. Trade Clean.
BK AK-Scope — Lock on the target. See what others don’t.
🔫 Clarity is power. 🔫
Gd bless. 🙏

MTF - Quantum Fibonacci ATR/ADR Levels & Targets V_2.0# Quantum Fibonacci Wave Mechanics v2.0 Release Notes
## 🚀 New Features
- Added multi-timeframe alert system for buy/sell signals
- Implemented dynamic label management with price values
- New mid-level trigger option for additional signals
- New EMA trigger option for confirmation signals
- Signal bar highlighting option
- Customizable line widths for all levels
## 🎨 Visual Improvements
- Completely redesigned label system (left-aligned with offsets)
- More intuitive input organization
- Better color customization options
## ⚙️ Technical Upgrades
- Upgraded to Pine Script v6
- Reduced repainting with stricter confirmation checks
- Optimized performance with proper variable initialization
## ⚠️ Note for Existing Users
- Some color parameters have been renamed
- Label positioning has changed (now with configurable offset)
- Review new mid-level trigger option in strategy settings
## 🐛 Bug Fixes
- Fixed potential repainting issues in signal generation
- Improved label cleanup between periods
- More robust security function implementation
## ⚠️ Caution for Mid-Level & EMA Signals
- Mid-Level Reversals may trigger premature entries in ranging markets.
- EMA crossovers can lag; confirm with price action.

Hull Moving Average RibbonGradient Wave HMA - Multi-Ribbon Hull Moving Average System
Overview
The Gradient Wave HMA is an advanced technical indicator that transforms Alan Hull's Hull Moving Average (HMA) into a dynamic multi-layered ribbon system. Unlike traditional moving average ribbons that use simple or exponential calculations, this indicator applies Hull's innovative lag-reduction formula across 12 different timeframes simultaneously, creating a visually striking gradient effect that flows with market momentum.
Technical Foundation
This indicator is built upon the Hull Moving Average, developed by Alan Hull in 2005. The HMA uses a weighted moving average calculation designed to almost eliminate lag while maintaining curve smoothness:
HMA = WMA(2*WMA(n/2) − WMA(n), sqrt(n))
Credit: Alan Hull (www.alanhull.com)
Key Features
Multi-Period Ribbon Structure
12 individual HMA lines with customizable periods
Preset configurations for different trading styles:
Fast: 3-30 period range (scalping/intraday)
Swing: 8-55 period range (swing trading)
Position: 20-100 period range (position trading)
Custom: User-defined periods
2. Neon Gradient Visualization
Bullish Gradient: Transitions from blue-purple to hot purple
Bearish Gradient: Flows from hot pink to purple-pink
Each line has a unique color in the spectrum
Gradient fills between lines create depth and visual flow
3. Advanced Alert System
Trend Reversal Alerts: Notifies when ribbon changes direction
Price Breakout Alerts: Triggers when price crosses the ribbon
Compression Alerts: Signals potential breakouts during consolidation
Expansion Alerts: Confirms strong trending conditions
Momentum Surge Alerts: Catches explosive moves early
How It Works
The indicator calculates 12 Hull Moving Averages, each with a different period length. The trend direction is determined by the middle HMA (6th line), which triggers the color change across the entire ribbon. When trending up, the ribbon displays a purple gradient; when trending down, it shifts to a pink gradient.
Trading Applications
1. Trend Identification
Ribbon color indicates overall trend direction
All lines moving in sync confirms strong trend
Mixed signals suggest choppy or transitioning markets
2. Dynamic Support/Resistance
In uptrends, the ribbon acts as moving support
In downtrends, it provides resistance levels
Multiple layers offer various strength levels
3. Momentum Analysis
Expanding ribbon = Increasing momentum
Contracting ribbon = Decreasing momentum/consolidation
Ribbon angle indicates trend strength
4. Trading Example
Advantages Over Traditional MAs
Reduced Lag: Hull's formula provides faster response than SMA/EMA ribbons
Visual Clarity: Gradient effect makes trend changes immediately visible
Multiple Timeframes: 12 periods provide comprehensive market view
Flexibility: Presets adapt to different trading styles
Best Practices
Use higher timeframes (4H, Daily) for position trading
Combine with volume indicators for confirmation
Watch for ribbon compression before major moves
Consider overall market conditions when interpreting signals
Customization Options
Adjust individual HMA periods
Fine-tune transparency for different backgrounds
Choose between WMA and EMA base calculations
The Gradient Wave HMA combines Alan Hull's breakthrough moving average formula with modern visualization techniques to create a powerful trend-following tool that's both technically sophisticated and visually intuitive.

Ergodic Market Divergence (EMD)Ergodic Market Divergence (EMD)
Bridging Statistical Physics and Market Dynamics Through Ensemble Analysis
The Revolutionary Concept: When Physics Meets Trading
After months of research into ergodic theory—a fundamental principle in statistical mechanics—I've developed a trading system that identifies when markets transition between predictable and unpredictable states. This indicator doesn't just follow price; it analyzes whether current market behavior will persist or revert, giving traders a scientific edge in timing entries and exits.
The Core Innovation: Ergodic Theory Applied to Markets
What Makes Markets Ergodic or Non-Ergodic?
In statistical physics, ergodicity determines whether a system's future resembles its past. Applied to trading:
Ergodic Markets (Mean-Reverting)
- Time averages equal ensemble averages
- Historical patterns repeat reliably
- Price oscillates around equilibrium
- Traditional indicators work well
Non-Ergodic Markets (Trending)
- Path dependency dominates
- History doesn't predict future
- Price creates new equilibrium levels
- Momentum strategies excel
The Mathematical Framework
The Ergodic Score combines three critical divergences:
Ergodic Score = (Price Divergence × Market Stress + Return Divergence × 1000 + Volatility Divergence × 50) / 3
Where:
Price Divergence: How far current price deviates from market consensus
Return Divergence: Momentum differential between instrument and market
Volatility Divergence: Volatility regime misalignment
Market Stress: Adaptive multiplier based on current conditions
The Ensemble Analysis Revolution
Beyond Single-Instrument Analysis
Traditional indicators analyze one chart in isolation. EMD monitors multiple correlated markets simultaneously (SPY, QQQ, IWM, DIA) to detect systemic regime changes. This ensemble approach:
Reveals Hidden Divergences: Individual stocks may diverge from market consensus before major moves
Filters False Signals: Requires broader market confirmation
Identifies Regime Shifts: Detects when entire market structure changes
Provides Context: Shows if moves are isolated or systemic
Dynamic Threshold Adaptation
Unlike fixed-threshold systems, EMD's boundaries evolve with market conditions:
Base Threshold = SMA(Ergodic Score, Lookback × 3)
Adaptive Component = StDev(Ergodic Score, Lookback × 2) × Sensitivity
Final Threshold = Smoothed(Base + Adaptive)
This creates context-aware signals that remain effective across different market environments.
The Confidence Engine: Know Your Signal Quality
Multi-Factor Confidence Scoring
Every signal receives a confidence score based on:
Signal Clarity (0-35%): How decisively the ergodic threshold is crossed
Momentum Strength (0-25%): Rate of ergodic change
Volatility Alignment (0-20%): Whether volatility supports the signal
Market Quality (0-20%): Price convergence and path dependency factors
Real-Time Confidence Updates
The Live Confidence metric continuously updates, showing:
- Current opportunity quality
- Market state clarity
- Historical performance influence
- Signal recency boost
- Visual Intelligence System
Adaptive Ergodic Field Bands
Dynamic bands that expand and contract based on market state:
Primary Color: Ergodic state (mean-reverting)
Danger Color: Non-ergodic state (trending)
Band Width: Expected price movement range
Squeeze Indicators: Volatility compression warnings
Quantum Wave Ribbons
Triple EMA system (8, 21, 55) revealing market flow:
Compressed Ribbons: Consolidation imminent
Expanding Ribbons: Directional move developing
Color Coding: Matches current ergodic state
Phase Transition Signals
Clear entry/exit markers at regime changes:
Bull Signals: Ergodic restoration (mean reversion opportunity)
Bear Signals: Ergodic break (trend following opportunity)
Confidence Labels: Percentage showing signal quality
Visual Intensity: Stronger signals = deeper colors
Professional Dashboard Suite
Main Analytics Panel (Top Right)
Market State Monitor
- Current regime (Ergodic/Non-Ergodic)
- Ergodic score with threshold
- Path dependency strength
- Quantum coherence percentage
Divergence Metrics
- Price divergence with severity
- Volatility regime classification
- Strategy mode recommendation
- Signal strength indicator
Live Intelligence
- Real-time confidence score
- Color-coded risk levels
- Dynamic strategy suggestions
Performance Tracking (Left Panel)
Signal Analytics
- Total historical signals
- Win rate with W/L breakdown
- Current streak tracking
- Closed trade counter
Regime Analysis
- Current market behavior
- Bars since last signal
- Recommended actions
- Average confidence trends
Strategy Command Center (Bottom Right)
Adaptive Recommendations
- Active strategy mode
- Primary approach (mean reversion/momentum)
- Suggested indicators ("weapons")
- Entry/exit methodology
- Risk management guidance
- Comprehensive Input Guide
Core Algorithm Parameters
Analysis Period (10-100 bars)
Scalping (10-15): Ultra-responsive, more signals, higher noise
Day Trading (20-30): Balanced sensitivity and stability
Swing Trading (40-100): Smooth signals, major moves only Default: 20 - optimal for most timeframes
Divergence Threshold (0.5-5.0)
Hair Trigger (0.5-1.0): Catches every wiggle, many false signals
Balanced (1.5-2.5): Good signal-to-noise ratio
Conservative (3.0-5.0): Only extreme divergences Default: 1.5 - best risk/reward balance
Path Memory (20-200 bars)
Short Memory (20-50): Recent behavior focus, quick adaptation
Medium Memory (50-100): Balanced historical context
Long Memory (100-200): Emphasizes established patterns Default: 50 - captures sufficient history without lag
Signal Spacing (5-50 bars)
Aggressive (5-10): Allows rapid-fire signals
Normal (15-25): Prevents clustering, maintains flow
Conservative (30-50): Major setups only Default: 15 - optimal trade frequency
Ensemble Configuration
Select markets for consensus analysis:
SPY: Broad market sentiment
QQQ: Technology leadership
IWM: Small-cap risk appetite
DIA: Blue-chip stability
More instruments = stronger consensus but potentially diluted signals
Visual Customization
Color Themes (6 professional options):
Quantum: Cyan/Pink - Modern trading aesthetic
Matrix: Green/Red - Classic terminal look
Heat: Blue/Red - Temperature metaphor
Neon: Cyan/Magenta - High contrast
Ocean: Turquoise/Coral - Calming palette
Sunset: Red-orange/Teal - Warm gradients
Display Controls:
- Toggle each visual component
- Adjust transparency levels
- Scale dashboard text
- Show/hide confidence scores
- Trading Strategies by Market State
- Ergodic State Strategy (Primary Color Bands)
Market Characteristics
- Price oscillates predictably
- Support/resistance hold
- Volume patterns repeat
- Mean reversion dominates
Optimal Approach
Entry: Fade moves at band extremes
Target: Middle band (equilibrium)
Stop: Just beyond outer bands
Size: Full confidence-based position
Recommended Tools
- RSI for oversold/overbought
- Bollinger Bands for extremes
- Volume profile for levels
- Non-Ergodic State Strategy (Danger Color Bands)
Market Characteristics
- Price trends persistently
- Levels break decisively
- Volume confirms direction
- Momentum accelerates
Optimal Approach
Entry: Breakout from bands
Target: Trail with expanding bands
Stop: Inside opposite band
Size: Scale in with trend
Recommended Tools
- Moving average alignment
- ADX for trend strength
- MACD for momentum
- Advanced Features Explained
Quantum Coherence Metric
Measures phase alignment between individual and ensemble behavior:
80-100%: Perfect sync - strong mean reversion setup
50-80%: Moderate alignment - mixed signals
0-50%: Decoherence - trending behavior likely
Path Dependency Analysis
Quantifies how much history influences current price:
Low (<30%): Technical patterns reliable
Medium (30-50%): Mixed influences
High (>50%): Fundamental shift occurring
Volatility Regime Classification
Contextualizes current volatility:
Normal: Standard strategies apply
Elevated: Widen stops, reduce size
Extreme: Defensive mode required
Signal Strength Indicator
Real-time opportunity quality:
- Distance from threshold
- Momentum acceleration
- Cross-validation factors
Risk Management Framework
Position Sizing by Confidence
90%+ confidence = 100% position size
70-90% confidence = 75% position size
50-70% confidence = 50% position size
<50% confidence = 25% or skip
Dynamic Stop Placement
Ergodic State: ATR × 1.0 from entry
Non-Ergodic State: ATR × 2.0 from entry
Volatility Adjustment: Multiply by current regime
Multi-Timeframe Alignment
- Check higher timeframe regime
- Confirm ensemble consensus
- Verify volume participation
- Align with major levels
What Makes EMD Unique
Original Contributions
First Ergodic Theory Trading Application: Transforms abstract physics into practical signals
Ensemble Market Analysis: Revolutionary multi-market divergence system
Adaptive Confidence Engine: Institutional-grade signal quality metrics
Quantum Coherence: Novel market alignment measurement
Smart Signal Management: Prevents clustering while maintaining responsiveness
Technical Innovations
Dynamic Threshold Adaptation: Self-adjusting sensitivity
Path Memory Integration: Historical dependency weighting
Stress-Adjusted Scoring: Market condition normalization
Real-Time Performance Tracking: Built-in strategy analytics
Optimization Guidelines
By Timeframe
Scalping (1-5 min)
Period: 10-15
Threshold: 0.5-1.0
Memory: 20-30
Spacing: 5-10
Day Trading (5-60 min)
Period: 20-30
Threshold: 1.5-2.5
Memory: 40-60
Spacing: 15-20
Swing Trading (1H-1D)
Period: 40-60
Threshold: 2.0-3.0
Memory: 80-120
Spacing: 25-35
Position Trading (1D-1W)
Period: 60-100
Threshold: 3.0-5.0
Memory: 100-200
Spacing: 40-50
By Market Condition
Trending Markets
- Increase threshold
- Extend memory
- Focus on breaks
Ranging Markets
- Decrease threshold
- Shorten memory
- Focus on restores
Volatile Markets
- Increase spacing
- Raise confidence requirement
- Reduce position size
- Integration with Other Analysis
- Complementary Indicators
For Ergodic States
- RSI divergences
- Bollinger Band squeezes
- Volume profile nodes
- Support/resistance levels
For Non-Ergodic States
- Moving average ribbons
- Trend strength indicators
- Momentum oscillators
- Breakout patterns
- Fundamental Alignment
- Check economic calendar
- Monitor sector rotation
- Consider market themes
- Evaluate risk sentiment
Troubleshooting Guide
Too Many Signals:
- Increase threshold
- Extend signal spacing
- Raise confidence minimum
Missing Opportunities
- Decrease threshold
- Reduce signal spacing
- Check ensemble settings
Poor Win Rate
- Verify timeframe alignment
- Confirm volume participation
- Review risk management
Disclaimer
This indicator is for educational and informational purposes only. It does not constitute financial advice. Trading involves substantial risk of loss and is not suitable for all investors. Past performance does not guarantee future results.
The ergodic framework provides unique market insights but cannot predict future price movements with certainty. Always use proper risk management, conduct your own analysis, and never risk more than you can afford to lose.
This tool should complement, not replace, comprehensive trading strategies and sound judgment. Markets remain inherently unpredictable despite advanced analysis techniques.
Transform market chaos into trading clarity with Ergodic Market Divergence.
Created with passion for the TradingView community
Trade with insight. Trade with anticipation.
— Dskyz , for DAFE Trading Systems

SOXL Trend Surge v3.0.2 – Profit-Only RunnerSOXL Trend Surge v3.0.2 – Profit-Only Runner
This is a trend-following strategy built for leveraged ETFs like SOXL, designed to ride high-momentum waves with minimal interference. Unlike most short-term scalping scripts, this model allows trades to develop over multiple days to even several months, capitalizing on the full power of extended directional moves — all without using a stop-loss.
🔍 How It Works
Entry Logic:
Price is above the 200 EMA (long-term trend confirmation)
Supertrend is bullish (momentum confirmation)
ATR is rising (volatility expansion)
Volume is above its 20-bar average (liquidity filter)
Price is outside a small buffer zone from the 200 EMA (to avoid whipsaws)
Trades are restricted to market hours only (9 AM to 2 PM EST)
Cooldown of 15 bars after each exit to prevent overtrading
Exit Strategy:
Takes partial profit at +2× ATR if held for at least 2 bars
Rides the remaining position with a trailing stop at 1.5× ATR
No hard stop-loss — giving space for volatile pullbacks
⚙️ Strategy Settings
Initial Capital: $500
Risk per Trade: 100% of equity (fully allocated per entry)
Commission: 0.1%
Slippage: 1 tick
Recalculate after order is filled
Fill orders on bar close
Timeframe Optimized For: 45-minute chart
These parameters simulate an aggressive, high-volatility trading model meant for forward-testing compounding potential under realistic trading costs.
✅ What Makes This Unique
No stop-loss = fewer premature exits
Partial profit-taking helps lock in early wins
Trailing logic gives room to ride large multi-week moves
Uses strict filters (volume, ATR, EMA bias) to enter only during high-probability windows
Ideal for leveraged ETF swing or position traders looking to hold longer than the typical intraday or 2–3 day strategies
⚠️ Important Note
This is a high-risk, high-reward strategy meant for educational and testing purposes. Without a stop-loss, trades can experience deep drawdowns that may take weeks or even months to recover. Always test thoroughly and adjust position sizing to suit your risk tolerance. Past results do not guarantee future returns. Backtest range: May 8, 2020 – May 23, 2025

HGDA Hany Ghazy Digital Analytics area zone'sIndicator Name: HGDA Hany Ghazy Digital Analytics area zones
Description:
This indicator plots several key price zones based on the highest high and lowest low over a user-defined lookback period.
The plotted zones represent dynamic support and resistance levels calculated using specific ratios of the price range (High - Low), as follows:
- Zone 1 (Light Red): Represents an upper resistance zone.
- Zone 2 (Medium Green): Represents a medium support zone.
- Zone 3 (Dark Red): Represents a lower resistance zone.
- Zone 4 (Dark Green): Represents a strong support zone.
Additionally, the indicator plots a yellow "Zero" line representing the midpoint price of the selected period, serving as a balance point for price action.
This indicator is ideal for identifying the overall market trend, as prices typically move from the upper resistance zones (light red) downwards to the end of the wave in the lower zones (dark green). This helps traders better understand wave nature and direction.
Usage:
- The colored zones assist in identifying potential reversal or continuation areas.
- These zones can be used to plan entries, exits, and risk management.
- Default lookback period is 20 bars, adjustable in the settings to suit the timeframe.
Notes:
- This indicator relies on historical price data and does not guarantee market predictions.
- It is recommended to combine it with other indicators and analytical tools for improved trading decisions.
---
Developed by Hany Ghazy Digital Analytics (HGDA).

EMA Pullback Speed Strategy 📌 **Overview**
The **EMA Pullback Speed Strategy** is a trend-following approach that combines **price momentum** and **Exponential Moving Averages (EMA)**.
It aims to identify high-probability entry points during brief pullbacks within ongoing uptrends or downtrends.
The strategy evaluates **speed of price movement**, **relative position to dynamic EMA**, and **candlestick patterns** to determine ideal timing for entries.
One of the key concepts is checking whether the price has **“not pulled back too much”**, helping focus only on situations where the trend is likely to continue.
⚠️ This strategy is designed for educational and research purposes only. It does not guarantee future profits.
🧭 **Purpose**
This strategy addresses the common issue of **"jumping in too late during trends and taking unnecessary losses."**
By waiting for a healthy pullback and confirming signs of **trend resumption**, traders can enter with greater confidence and reduce false entries.
🎯 **Strategy Objectives**
* Enter in the direction of the prevailing trend to increase win rate
* Filter out false signals using pullback depth, speed, and candlestick confirmations
* Predefine Take-Profit (TP) and Stop-Loss (SL) levels for safer, rule-based trading
✨ **Key Features**
* **Dynamic EMA**: Reacts faster when price moves quickly, slower when market is calm – adapting to current momentum
* **Pullback Filter**: Avoids trades when price pulls back too far (e.g., more than 5%), indicating a trend may be weakening
* **Speed Check**: Measures how strongly the price returns to the trend using candlestick body speed (open-to-close range in ticks)
📊 **Trading Rules**
**■ Long Entry Conditions:**
* Current price is above the dynamic EMA (indicating uptrend)
* Price has pulled back toward the EMA (a "buy the dip" situation)
* Pullback depth is within the threshold (not excessive)
* Candlesticks show consecutive bullish closes and break the previous high
* Price speed is strong (positive movement with momentum)
**■ Short Entry Conditions:**
* Current price is below the dynamic EMA (indicating downtrend)
* Price has pulled back up toward the EMA (a "sell the rally" setup)
* Pullback is within range (not too deep)
* Candlesticks show consecutive bearish closes and break the previous low
* Price speed is negative (downward momentum confirmed)
**■ Exit Conditions (TP/SL):**
* **Take-Profit (TP):** Fixed 1.5% target above/below entry price
* **Stop-Loss (SL):** Based on recent price volatility, calculated using ATR × 4
💰 **Risk Management Parameters**
* Symbol & Timeframe: BTCUSD on 1-hour chart (H1)
* Test Capital: \$3000 (simulated account)
* Commission: 0.02%
* Slippage: 2 ticks (minimal execution lag)
* Max risk per trade: 5% of account balance
* Backtest Period: Aug 30, 2023 – May 9, 2025
* Profit Factor (PF): 1.965 (Net profit ÷ Net loss, including spreads & fees)
⚙️ **Trading Parameters & Indicator Settings**
* Maximum EMA Length: 50
* Accelerator Multiplier: 3.0
* Pullback Threshold: 5.0%
* ATR Period: 14
* ATR Multiplier (SL distance): 4.0
* Fixed TP: 1.5%
* Short-term EMA: 21
* Long-term EMA: 50
* Long Speed Threshold: ≥ 1000.0 (ticks)
* Short Speed Threshold: ≤ -1000.0 (ticks)
⚠️Adjustments are based on BTCUSD.
⚠️Forex and other currency pairs require separate adjustments.
🔧 **Strategy Improvements & Uniqueness**
Unlike basic moving average crossovers or RSI triggers, this strategy emphasizes **"momentum-supported pullbacks"**.
By combining dynamic EMA, speed checks, and candlestick signals, it captures trades **as if surfing the wave of a trend.**
Its built-in filters help **avoid overextended pullbacks**, which often signal the trend is ending – making it more robust than traditional trend-following systems.
✅ **Summary**
The **EMA Pullback Speed Strategy** is easy to understand, rule-based, and highly reproducible – ideal for both beginners and intermediate traders.
Because it shows **clear visual entry/exit points** on the chart, it’s also a great tool for practicing discretionary trading decisions.
⚠️ Past performance is not a guarantee of future results.
Always respect your Stop-Loss levels and manage your position size according to your risk tolerance.

RSI - PRIMARIO -mauricioofsousa
MGO Primary – Matriz Gráficos ON
The Blockchain of Trading applied to price behavior
The MGO Primary is the foundation of Matriz Gráficos ON — an advanced graphical methodology that transforms market movement into a logical, predictable, and objective sequence, inspired by blockchain architecture and periodic oscillatory phenomena.
This indicator replaces emotional candlestick reading with a mathematical interpretation of price blocks, cycles, and frequency. Its mission is to eliminate noise, anticipate reversals, and clearly show where capital is entering or exiting the market.
What MGO Primary detects:
Oscillatory phenomena that reveal the true behavior of orders in the book:
RPA – Breakout of Bullish Pivot
RPB – Breakout of Bearish Pivot
RBA – Sharp Bullish Breakout
RBB – Sharp Bearish Breakout
Rhythmic patterns that repeat in medium timeframes (especially on 12H and 4H)
Wave and block frequency, highlighting critical entry and exit zones
Validation through Primary and Secondary RSI, measuring the real strength behind movements
Who is this indicator for:
Traders seeking statistical clarity and visual logic
Operators who want to escape the subjectivity of candlesticks
Anyone who values technical precision with operational discipline
Recommended use:
Ideal timeframes: 12H (high precision) and 4H (moderate intensity)
Recommended assets: indices (e.g., NASDAQ), liquid stocks, and futures
Combine with: structured risk management and macro context analysis
Real-world performance:
The MGO12H achieved a 92% accuracy rate in 2025 on the NASDAQ, outperforming the average performance of major global quantitative strategies, with a net score of over 6,200 points for the year.
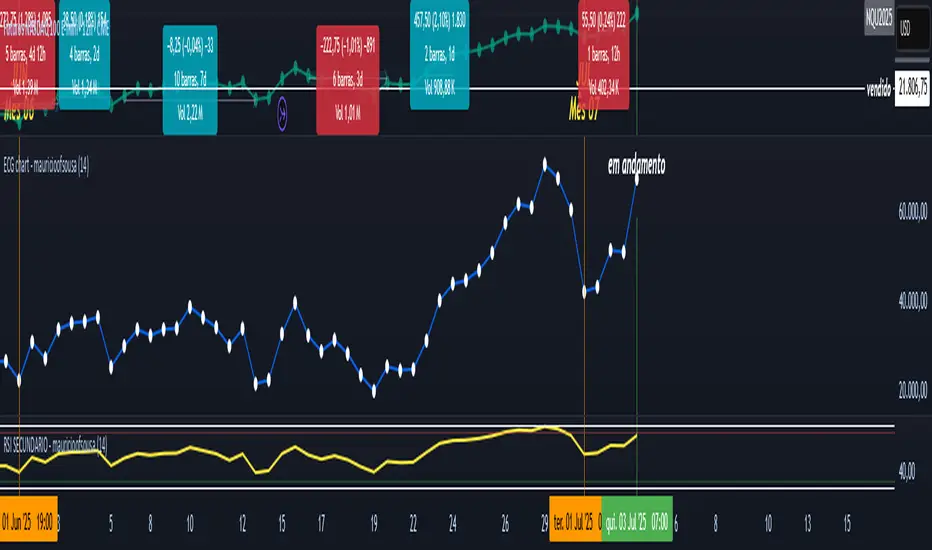
(MVD) Meta-Volatility Divergence (DAFE) Meta-Volatility Divergence (MVD)
Reveal the Hidden Tension in Volatility.
The Meta-Volatility Divergence (MVD) indicator is a next-generation tool designed to expose the disagreement between multiple volatility measures—helping you spot when the market’s “volatility engines” are out of sync, and a regime shift or volatility event may be brewing.
What Makes MVD Unique?
Multi-Source Volatility Analysis:
Unlike traditional volatility indicators that rely on a single measure, MVD fuses four distinct volatility signals:
ATR (Average True Range): Captures the average range of price movement.
Stdev (Standard Deviation): Measures the dispersion of closing prices.
Range: The average difference between high and low.
VoVix: A proprietary “volatility of volatility” metric, quantifying the difference between fast and slow ATR, normalized by ATR’s own volatility.
Divergence Engine:
The core MVD line (yellow) represents the mean absolute deviation (MAD) of these volatility measures from their average. When the line is flat, all volatility measures are in agreement. When the line rises, it means the market’s volatility signals are diverging—often a precursor to regime shifts, volatility expansions, or hidden stress.
Dynamic Z-Score Normalization:
The MVD line is normalized as a Z-score, so you can easily spot when current divergence is rare or extreme compared to recent history.
Visual Clarity:
Yellow center line: Tracks the real-time divergence of volatility measures.
Green dashed thresholds: Mark the ±2.00 Z-score levels, highlighting when divergence is unusually high and action may be warranted.
Dashboard: Toggleable panel shows all key metrics (ATR, Stdev, VoVix, MVD Z) and your custom branding.
Compact Info Label : For mobile or minimalist users, a single-line summary keeps you informed without clutter.
What Makes The MVD line move?
- The MVD line rises when the included volatility measures (ATR, Stdev, Range, VoVix) are moving in different directions or at different magnitudes. For example, if ATR is rising but Stdev is falling, the line will move up, signaling disagreement.
- The line falls or flattens when all volatility measures are in sync, indicating a consensus in the market’s volatility regime.
- VoVix adds a unique dimension, making the indicator especially sensitive to sudden changes in volatility structure that most tools miss.
Inputs & Settings
ATR Length: Sets the lookback for ATR calculation. Shorter = more sensitive, longer = smoother.
Stdev Length: Sets the lookback for standard deviation. Adjust for your asset’s volatility.
Range Length: Sets the lookback for the average high-low range.
MVD Lookback: Controls the window for Z-score normalization. Higher values = more historical context, lower = more responsive.
Show Dashboard: Toggle the full dashboard panel on/off.
Show Compact Info Label: Toggle the mobile-friendly info line on/off.
Tip:
Adjust these settings to match your asset’s volatility and your trading timeframe. There is no “one size fits all”—tuning is key to extracting the most value from MVD.
How to make MVD work for you:
Threshold Crosses: When the MVD line crosses above or below the green dashed thresholds (±2.00), it signals that volatility measures are diverging more than usual. This is a heads-up that a volatility event, regime shift, or hidden market stress may be developing.
Not a Buy/Sell Signal: A threshold cross is not a direct buy or sell signal. It is an indication that the market’s volatility structure is changing. Use it as a filter, confirmation, or alert in combination with your own strategy and risk management.
Dashboard & Info Line: Use the dashboard for a full view of all metrics, or the info label for a quick glance—especially useful on mobile.
Chart: MNQ! on 5min frames
ATR: 14
StDev L: 11
Range L: 13
MDV LB: 13
Important Note
MVD is a market structure and volatility regime tool.
It is designed to alert you to potential changes in market conditions, not to provide direct trade entries or exits. Always combine with your own analysis and risk management.
Meta-Volatility Divergence:
See the market’s hidden tension. Anticipate the next wave.
For educational purposes only. Not financial advice. Always use proper risk management.
Use with discipline. Trade your edge.
— Dskyz, for DAFE Trading Systems

Stop Cascade Detector Stop Cascade Detector (DAFE)
Unlock the Hidden Triggers of Market Momentum!
The Stop Cascade Detector (Bull & Bear, Info Bubble) is a next-generation tool designed for traders who want to see what the crowd can’t: the precise moments when clusters of stop orders are being triggered, unleashing explosive moves in either direction. The reason for this is traders taking there position too early. We on the other hand will take our positions once the less informed traders have been liquidated.
What Makes This Indicator Unique?
Not Just Another Volatility Tool:
This script doesn’t just measure volatility or volume. It detects the chain reactions that occur when price and volume spikes combine to trigger stop-loss clusters—events that often precede the most powerful surges and reversals in any market.
Directional Intelligence:
Unlike generic “spike” detectors, this tool distinguishes between bullish stop cascades (green, above the bar) and bearish stop cascades (red, below the bar), giving you instant clarity on which side of the market is being liquidated.
Visual Precision:
Each event is marked with a color-coded info bubble and a triangle, clearly separated from the price bars for maximum readability. No more guessing where the action is—see it, trade it, and stay ahead.
Universal Application:
Works on any asset, any timeframe, and in any market—futures, stocks, crypto, forex. If there are stops, this indicator will find the cascade.
What makes it work?
Momentum + Volume Spike:
The detector identifies bars where both price momentum and volume are simultaneously extreme (using Z-scores). This combination is a classic signature of stop runs and forced liquidations.
Bull & Bear Detection:
Bull Stop Cascade : Price plunges downward with a volume spike—likely longs getting stopped out.
Bear Stop Cascade: Price surges upward with a volume spike—likely shorts getting stopped out.
Info Bubbles:
Each event is labeled with the exact Z-scores for momentum and volume, so you can gauge the intensity of the cascade at a glance.
What will it do for you?
Front-Run the Crowd:
Most traders react after the move. This tool helps you spot the cause of the move—giving you a tactical edge to fade exhaustion, ride momentum, or avoid getting trapped.
Perfect for Scalpers, Day Traders, and Swing Traders:
Whether you’re looking for high-probability reversals or want to ride the wave, knowing when stops are being triggered is a game-changer.
No More Blind Spots:
Stop cascades are the hidden fuel behind many of the market’s biggest moves. Now you can see them in real time.
How to Use
Red Bubble Above Bar: Bear stop cascade detected—watch for possible trend acceleration or reversal.
Green Bubble Below Bar: Bull stop cascade detected—watch for possible trend acceleration or reversal.
Combine with Your Strategy : Use as a confirmation tool, a reversal signal, or a filter for high-volatility environments. Level up your trading. See the market’s hidden triggers.
Stop Cascade Detector: Because the real edge is knowing what sets the market on fire.
For educational purposes only. Not financial advice. Always use proper risk management.
Use with discipline. Trade your edge.
— Dskyz, for DAFE Trading Systems
Solar Cycle (SOLAR)SOLAR: SOLAR CYCLE
🔍 OVERVIEW AND PURPOSE
The Solar Cycle indicator is an astronomical calculator that provides precise values representing the seasonal position of the Sun throughout the year. This indicator maps the Sun's position in the ecliptic to a normalized value ranging from -1.0 (winter solstice) through 0.0 (equinoxes) to +1.0 (summer solstice), creating a continuous cycle that represents the seasonal progression throughout the year.
The implementation uses high-precision astronomical formulas that include orbital elements and perturbation terms to accurately calculate the Sun's position. By converting chart timestamps to Julian dates and applying standard astronomical algorithms, this indicator achieves significantly greater accuracy than simplified seasonal approximations. This makes it valuable for traders exploring seasonal patterns, agricultural commodities trading, and natural cycle-based trading strategies.
🧩 CORE CONCEPTS
Seasonal cycle integration: Maps the annual solar cycle (365.242 days) to a continuous wave
Continuous phase representation: Provides a normalized -1.0 to +1.0 value
Astronomical precision: Uses perturbation terms and high-precision constants for accurate solar position
Key points detection: Identifies solstices (±1.0) and equinoxes (0.0) automatically
The Solar Cycle indicator differs from traditional seasonal analysis tools by incorporating precise astronomical calculations rather than using simple calendar-based approximations. This approach allows traders to identify exact seasonal turning points and transitions with high accuracy.
⚙️ COMMON SETTINGS AND PARAMETERS
Pro Tip: While the indicator itself doesn't have adjustable parameters, it's most effective when used on higher timeframes (daily or weekly charts) to visualize seasonal patterns. Consider combining it with commodity price data to analyze seasonal correlations.
🧮 CALCULATION AND MATHEMATICAL FOUNDATION
Simplified explanation:
The Solar Cycle indicator calculates the Sun's ecliptic longitude and transforms it into a sine wave that peaks at the summer solstice and troughs at the winter solstice, with equinoxes at the zero crossings.
Technical formula:
Convert chart timestamp to Julian Date:
JD = (time / 86400000.0) + 2440587.5
Calculate Time T in Julian centuries since J2000.0:
T = (JD - 2451545.0) / 36525.0
Calculate the Sun's mean longitude (L0) and mean anomaly (M), including perturbation terms:
L0 = (280.46646 + 36000.76983T + 0.0003032T²) % 360
M = (357.52911 + 35999.05029T - 0.0001537T² - 0.00000025T³) % 360
Calculate the equation of center (C):
C = (1.914602 - 0.004817T - 0.000014*T²)sin(M) +
(0.019993 - 0.000101T)sin(2M) +
0.000289sin(3M)
Calculate the Sun's true longitude and convert to seasonal value:
λ = L0 + C
seasonal = sin(λ)
🔍 Technical Note: The implementation includes terms for the equation of center to account for the Earth's elliptical orbit. This provides more accurate timing of solstices and equinoxes compared to simple harmonic approximations.
📈 INTERPRETATION DETAILS
The Solar Cycle indicator provides several analytical perspectives:
Summer Solstice (+1.0): Maximum solar elevation, longest day
Winter Solstice (-1.0): Minimum solar elevation, shortest day
Vernal Equinox (0.0 crossing up): Day and night equal length, spring begins
Autumnal Equinox (0.0 crossing down): Day and night equal length, autumn begins
Transition rates: Steepest near equinoxes, flattest near solstices
Cycle alignment: Market cycles that align with seasonal patterns may show stronger trends
Confirmation points: Solstices and equinoxes often mark important seasonal turning points
⚠️ LIMITATIONS AND CONSIDERATIONS
Geographic relevance: Solar cycle timing is most relevant for temperate latitudes
Market specificity: Seasonal effects vary significantly across different markets
Timeframe compatibility: Most effective for longer-term analysis (weekly/monthly)
Complementary tool: Should be used alongside price action and other indicators
Lead/lag effects: Market reactions to seasonal changes may precede or follow astronomical events
Statistical significance: Seasonal patterns should be verified across multiple years
Global markets: Consider opposite seasonality in Southern Hemisphere markets
📚 REFERENCES
Meeus, J. (1998). Astronomical Algorithms (2nd ed.). Willmann-Bell.
Hirshleifer, D., & Shumway, T. (2003). Good day sunshine: Stock returns and the weather. Journal of Finance, 58(3), 1009-1032.
Hong, H., & Yu, J. (2009). Gone fishin': Seasonality in trading activity and asset prices. Journal of Financial Markets, 12(4), 672-702.
Bouman, S., & Jacobsen, B. (2002). The Halloween indicator, 'Sell in May and go away': Another puzzle. American Economic Review, 92(5), 1618-1635.
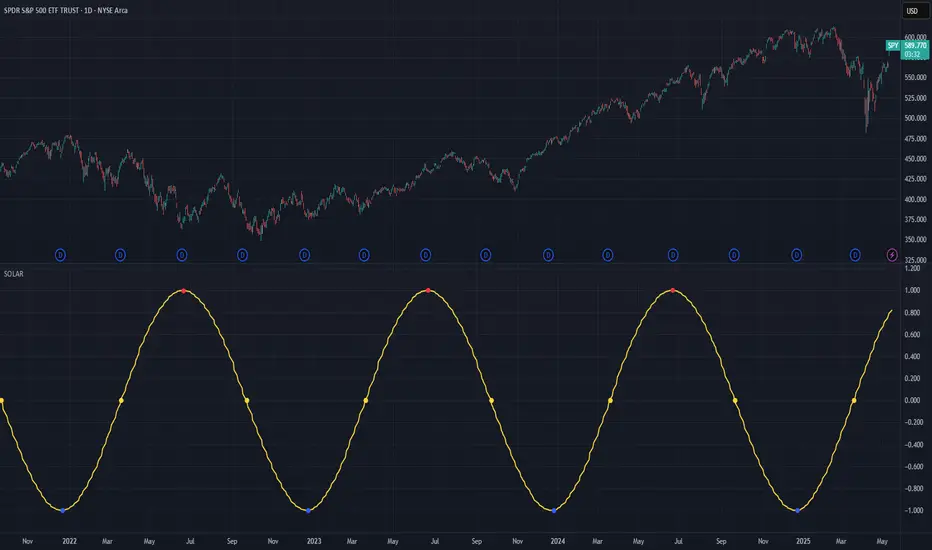
Bitcoin Power Law OscillatorThis is the oscillator version of the script. The main body of the script can be found here.
Understanding the Bitcoin Power Law Model
Also called the Long-Term Bitcoin Power Law Model. The Bitcoin Power Law model tries to capture and predict Bitcoin's price growth over time. It assumes that Bitcoin's price follows an exponential growth pattern, where the price increases over time according to a mathematical relationship.
By fitting a power law to historical data, the model creates a trend line that represents this growth. It then generates additional parallel lines (support and resistance lines) to show potential price boundaries, helping to visualize where Bitcoin’s price could move within certain ranges.
In simple terms, the model helps us understand Bitcoin's general growth trajectory and provides a framework to visualize how its price could behave over the long term.
The Bitcoin Power Law has the following function:
Power Law = 10^(a + b * log10(d))
Consisting of the following parameters:
a: Power Law Intercept (default: -17.668).
b: Power Law Slope (default: 5.926).
d: Number of days since a reference point(calculated by counting bars from the reference point with an offset).
Explanation of the a and b parameters:
Roughly explained, the optimal values for the a and b parameters are determined through a process of linear regression on a log-log scale (after applying a logarithmic transformation to both the x and y axes). On this log-log scale, the power law relationship becomes linear, making it possible to apply linear regression. The best fit for the regression is then evaluated using metrics like the R-squared value, residual error analysis, and visual inspection. This process can be quite complex and is beyond the scope of this post.
Applying vertical shifts to generate the other lines:
Once the initial power-law is created, additional lines are generated by applying a vertical shift. This shift is achieved by adding a specific number of days (or years in case of this script) to the d-parameter. This creates new lines perfectly parallel to the initial power law with an added vertical shift, maintaining the same slope and intercept.
In the case of this script, shifts are made by adding +365 days, +2 * 365 days, +3 * 365 days, +4 * 365 days, and +5 * 365 days, effectively introducing one to five years of shifts. This results in a total of six Power Law lines, as outlined below (From lowest to highest):
Base Power Law Line (no shift)
1-year shifted line
2-year shifted line
3-year shifted line
4-year shifted line
5-year shifted line
The six power law lines:
Bitcoin Power Law Oscillator
This publication also includes the oscillator version of the Bitcoin Power Law. This version applies a logarithmic transformation to the price, Base Power Law Line, and 5-year shifted line using the formula: log10(x) .
The log-transformed price is then normalized using min-max normalization relative to the log-transformed Base Power Law Line and 5-year shifted line with the formula:
normalized price = log(close) - log(Base Power Law Line) / log(5-year shifted line) - log(Base Power Law Line)
Finally, the normalized price was multiplied by 5 to map its value between 0 and 5, aligning with the shifted lines.
Interpretation of the Bitcoin Power Law Model:
The shifted Power Law lines provide a framework for predicting Bitcoin's future price movements based on historical trends. These lines are created by applying a vertical shift to the initial Power Law line, with each shifted line representing a future time frame (e.g., 1 year, 2 years, 3 years, etc.).
By analyzing these shifted lines, users can make predictions about minimum price levels at specific future dates. For example, the 5-year shifted line will act as the main support level for Bitcoin’s price in 5 years, meaning that Bitcoin’s price should not fall below this line, ensuring that Bitcoin will be valued at least at this level by that time. Similarly, the 2-year shifted line will serve as the support line for Bitcoin's price in 2 years, establishing that the price should not drop below this line within that time frame.
On the other hand, the 5-year shifted line also functions as an absolute resistance , meaning Bitcoin's price will not exceed this line prior to the 5-year mark. This provides a prediction that Bitcoin cannot reach certain price levels before a specific date. For example, the price of Bitcoin is unlikely to reach $100,000 before 2021, and it will not exceed this price before the 5-year shifted line becomes relevant. After 2028, however, the price is predicted to never fall below $100,000, thanks to the support established by the shifted lines.
In essence, the shifted Power Law lines offer a way to predict both the minimum price levels that Bitcoin will hit by certain dates and the earliest dates by which certain price points will be reached. These lines help frame Bitcoin's potential future price range, offering insight into long-term price behavior and providing a guide for investors and analysts. Lets examine some examples:
Example 1:
In Example 1 it can be seen that point A on the 5-year shifted line acts as major resistance . Also it can be seen that 5 years later this price level now corresponds to the Base Power Law Line and acts as a major support at point B(Note: Vertical yearly grid lines have been added for this purpose👍).
Example 2:
In Example 2, the price level at point C on the 3-year shifted line becomes a major support three years later at point D, now aligning with the Base Power Law Line.
Finally, let's explore some future price predictions, as this script provides projections on the weekly timeframe :
Example 3:
In Example 3, the Bitcoin Power Law indicates that Bitcoin's price cannot surpass approximately $808K before 2030 as can be seen at point E, while also ensuring it will be at least $224K by then (point F).

KTUtilsLibrary "KTUtils"
Utility functions for technical analysis indicators, trend detection, and volatility confirmation.
MGz(close, length)
MGz
@description Moving average smoother used for signal processing
Parameters:
close (float) : float Price input (typically close)
length (int) : int Length of smoothing period
Returns: float Smoothed value
atrConf(length)
atrConf
@description Calculates Average True Range (ATR) for volatility confirmation
Parameters:
length (simple int) : int Length for ATR calculation
Returns: float ATR value
f(input)
f
@description Simple Moving Average with fixed length
Parameters:
input (float) : float Input value
Returns: float Smoothed average
bcwSMA(s, l, m)
bcwSMA
@description Custom smoothing function with weight multiplier
Parameters:
s (float) : float Signal value
l (int) : int Length of smoothing
m (int) : int Weighting multiplier
Returns: float Smoothed output
MGxx(close, length)
MGxx
@description Custom Weighted Moving Average (WMA) variant
Parameters:
close (float) : float Price input
length (int) : int Period length
Returns: float MGxx smoothed output
_PerChange(lengthTime)
_PerChange
@description Measures percentage price change over a period and range deviation
Parameters:
lengthTime (int) : int Period for change measurement
Returns: tuple Measured change, high deviation, low deviation
dirmov(len)
dirmov
@description Calculates directional movement components
Parameters:
len (simple int) : int Lookback period
Returns: tuple Plus and Minus DI values
adx(dilen, adxlen)
adx
@description Calculates Average Directional Index (ADX)
Parameters:
dilen (simple int) : int Length for DI calculation
adxlen (simple int) : int Length for ADX smoothing
Returns: float ADX value
trChopAnalysis()
trChopAnalysis
@description Identifies chop and trend phases based on True Range Bollinger Bands
Returns: tuple TR SMA, chop state, trending state
wtiAnalysis(haclose, close, filterValue)
wtiAnalysis
@description Wave Trend Indicator (WTI) with signal crossover logic
Parameters:
haclose (float) : float Heikin-Ashi close
close (float) : float Standard close
filterValue (simple int) : int Smoothing length
Returns: tuple WTI lines and direction states
basicTrend(hahigh, halow, close, open, filterValue)
basicTrend
@description Determines trend direction based on HA high/low and close
Parameters:
hahigh (float) : float Heikin-Ashi high
halow (float) : float Heikin-Ashi low
close (float) : float Standard close
open (float) : float Standard open
filterValue (simple int) : int Smoothing period
Returns: tuple Uptrend, downtrend flags
metrics(close, filterValue)
metrics
@description Common market metrics
Parameters:
close (float) : float Price input
filterValue (int) : int RSI smoothing length
Returns: tuple VWMA, SMA10, RSI, smoothed RSI
piff(close, trend_change)
piff
@description Price-Informed Forward Forecasting (PIFF) model for trend strength
Parameters:
close (float) : float Price input
trend_change (float) : float Change in trend
Returns: tuple Percent change, flags for trend direction
getMACD()
getMACD
@description Returns MACD, signal line, and histogram
Returns: tuple MACD line, Signal line, Histogram
getStoch()
getStoch
@description Returns K and D lines of Stochastic Oscillator
Returns: tuple K and D lines
getKDJ()
getKDJ
@description KDJ momentum oscillator
Returns: tuple K, D, J, Average
getBBRatio()
getBBRatio
@description Bollinger Band Ratio (BBR) and signal flags
Returns: tuple Basis, Upper, Lower, BBR, BBR Up, BBR Down
getSupertrend()
getSupertrend
@description Supertrend values and direction flags
Returns: tuple Supertrend, Direction, Up, Down

BK AK-47 Divergence🚨 Introducing BK AK-47 Divergence — Multi-Timeframe Precision Firepower for True Traders 🚨
After months of development, I’m proud to release my fifth weapon in the arsenal — BK AK-47 Divergence.
💥 Why “AK-47”? The Meaning Behind the Name
The AK-47 isn’t just a rifle. It’s the symbol of reliability, versatility, and raw stopping power. It performs in every environment — from the mud to the mountains — just like this indicator cuts through noise on any timeframe, any asset, any condition.
🔸 “AK” honors the same legacy as before — my mentor, A.K., whose discipline and vision forged my trading edge.
🔸 “47” signifies layered precision: 4 = structure, 7 = spiritual completion. Together, it’s the weapon of divine order that adapts, reacts, and strikes with purpose.
🔍 What Is BK AK-47 Divergence?
It’s a next-generation divergence detector — a smart hybrid of MACD, Bollinger Bands, and multi-timeframe divergence logic wrapped in a custom volatility engine and real-time flash alerts.
Designed for snipers in the market — those who only take the highest-probability shots.
⚙️ Core Weapon Systems
✅ MACD + BB Precision Overlay → MACD plotted inside dynamic Bollinger Bands — reveals hidden pressure zones where most indicators fail.
✅ Smart Histogram Scaling → Adaptive amplification based on volatility. No more weak histograms in strong markets.
✅ Full Multi-Timeframe Divergence Detection:
🔻 Current TF Divergence
🕐 Higher TF Divergence
⏱️ Lower TF Divergence
Each plotted with clean visual alerts, color-coded by direction and timeframe. You get instant divergence recognition across dimensions.
✅ Background Flash Alerts → When MACD hits BB extremes, the background lights up in red or green. Eyes instantly lock in on key moments.
✅ Advanced Pivot Lookback Control → New lookback system compares multiple pivot layers, not just the last swing. This gives true structural divergence, not just noise.
✅ Dynamic Fill Zones:
🔴 Oversold
🟢 Overbought
🔵 Neutral
Built to filter false signals and highlight hidden edge.
🛡️ Why This Indicator Changes the Game
🔹 Built for divergence snipers — not lagging MACD watchers.
🔹 Perfect for traders who sync with:
• Elliott Waves
• Fibonacci Time/Price Clusters
• Harmonic Patterns
• Gann Angles or Squares
• Price Action & Trendlines
🔹 Lets you visually map:
• Converging divergences (multi-TF confirmation)
• High-volatility histograms in low-volatility price zones (entry sweet spots)
• Flash-momentum warnings at BB pressure zones
🎯 How to Use BK AK-47 Divergence
🔹 Breakout Confirmation → MACD breaches upper BB with bullish divergence = signal to ride momentum.
🔹 Mean Reversion Reversals → MACD breaks lower BB + bullish div = setup for sniper long.
🔹 Top/Bottom Detection → Bearish divergence + MACD failure at upper BB = early reversal signal.
🔹 TF Sync Strategy → Align current TF with higher or lower divergences for laser-confirmed entries.
🧠 Final Thoughts
This isn’t just a divergence tool. It’s a battlefield reconnaissance system — one that lets you see when, where, and why the next pivot is forming.
🔹 Built in honor of the AK-legacy — reliability, discipline, and firepower.
🔹 Designed to cut through noise, expose structure, and alert you to what really matters.
🔹 Crafted for those who trade with intent, vision, and respect for the craft.
🙏 And most importantly: All glory to Gd — the One who gives wisdom, clarity, and purpose.
Without Him, the markets are chaos. With Him, we move in structure, order, and divine timing.
—
⚡ Stay dangerous. Stay precise. Stay aligned.
🔥 BK AK-47 Divergence — Locked. Loaded. Laser-focused. 🔥
May the markets bend to your discipline.
Gd bless. 🙏