Futures Weekly Open RangeThe weekly opening range ( high to low ) is calculated from the open of the market on Sunday (1800 EST) till the opening of the Bond Market on Monday morning (0800 EST). This is the first and most crucial range for the trading week. As ICT has taught, price is moving through an algorithm and as such is fractal; because price is fractal, the opening range can be calculated and projected to help determine if price is trending or consolidating. As well; this indicator can be used to incorporate his PO3 concept to enter above the weekly opening range for shorts if bearish, or entering below the opening range for longs if bullish.
This indicator takes the high and low of weekly opening range, plots those two levels, plots the opening price for the new week, and calculates the Standard Deviations of the range and plots them both above and below of the weekly opening range. These are all plotted through the week until the start of the new week.
The range is calculated by subtracting the high from the low during the specified time.
The mid-point is half of that range added to the low.
The Standard deviation is multiples of the range (up to 10) added to the high and subtracted
from the low.
At this time the indicator will only plot the Standard deviation lines on the minutes time frame below 1 hour.
Only the range and range lines will be plotted on the hourly chart.
Cerca negli script per "weekly"

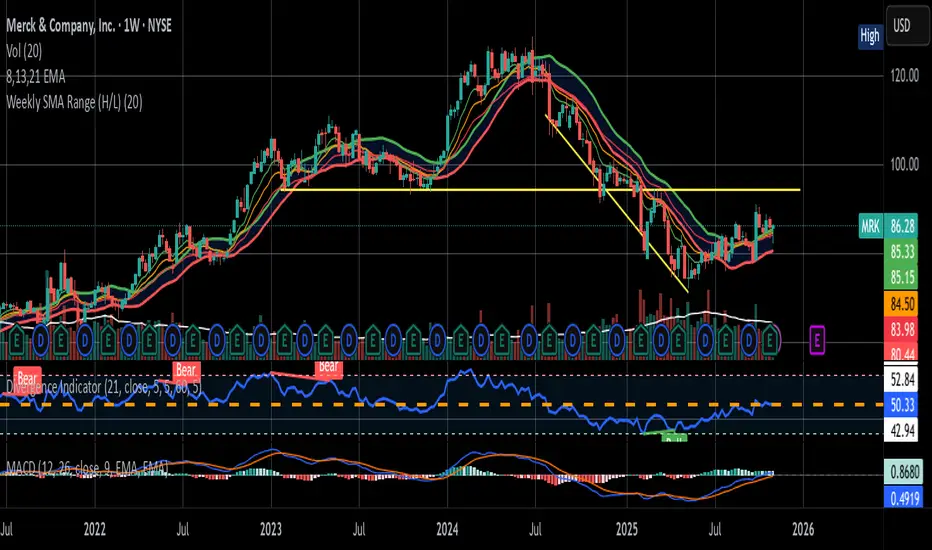
Artharjan Daily Weekly Price Trend IndicatorHi,
Artharjan Daily Weekly Price Trend Indicator is created to identify whether the current market price is with respect to previous Daily High and Low as well as Previous Weekly High and Low
If the price is above previous Day High a Green Square is plotted above the Candle, if the Price is inside the Previous Day Range then a Gray Square is Plotted above the Candle, and if the Price is below the previous day low then a Red Square is plotted above the candle.
Similarly If the price is above previous Week's High a Green Circle is plotted below the Candle, if the Price is inside the Previous Week's Range then a Gray Circle is Plotted below the Candle, and if the Price is below the previous Week's low then a Red Circle is plotted below the candle.
The idea here is to identify the trend, trend changes (Reversals) and initiate either a long or short positing purely based on price action.
For illustration purpose, If suppose you have entered the trade when you see a Green Square above and a Green Circle Below, hold on to the trade as long as the Green circle below does not turn into a Red Circle. It means the Weekly trend is Bullish and Daily trend may change more frequently, but you may hold on to your position unless and until the weekly Trend changes.
Also if may help to Book your profits in a timely manner, lets say you are in a long trade and you keep seeing Green Square at the top of the candle, the moment you see a Gray or a red Square at the top you may exit your long position. Obviously trader needs to use his brains to enter a position at right location on the chart and ride that position using this indicator.
I hope everyone would find this simple indicator very useful.
Regards
Rahul Desai
@Artharjan

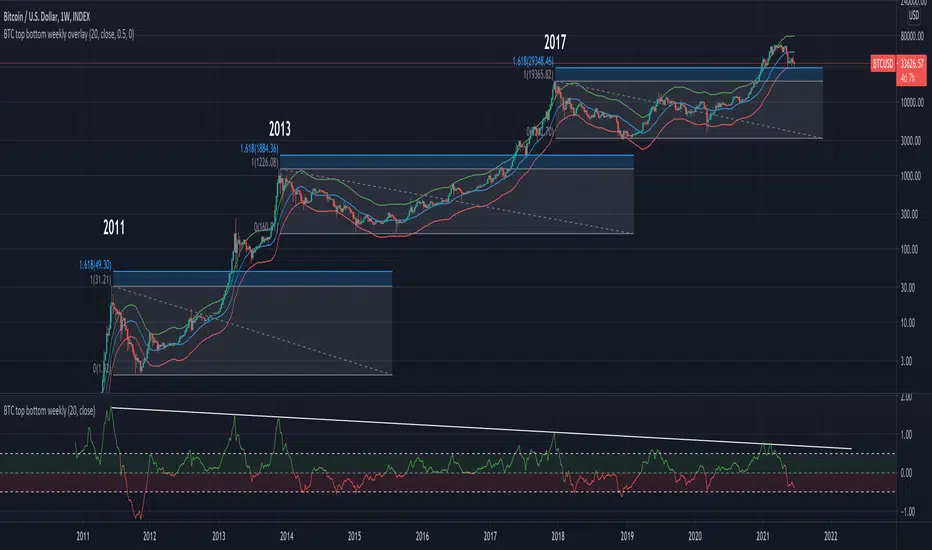
BTC top bottom weekly oscillatorThis indicator is based on the 20 weekly simple moving average and it could be used to help finding potential tops and bottoms on a weekly BTC chart.
This version uses an "oscillator" presentation, it fluctuates around the value zero.
The indicator plots 0 when the close price is near the 20 weekly moving average.
If it's below 0 it reflects the price being below the 20 weekly moving average, and opposite for above.
IT's possible to see how many times the price has hit the 0.5 coef support. In one case it hit 0.6 showing that the 0.5 support can be broken.
The indicator is calculated as Log(close / sma(close))
Instructions:
- Use with the symbol INDEX:BTCUSD so you can see the price since 2010
- Set the timeframe to weekly
Optionals:
- change the coef to 0.6 for a more conservative bottom
- change the coef to 0.4 for a more conservative top

BTC top bottom weekly bandsThis indicator is based on the 20 weekly simple moving average and it could be used to help finding potential tops and bottoms on a weekly BTC chart.
When using the provided "coef" parameter set to the default of 0.5 it shows how most bottoms since 2013 have hit the lower band of this indicator.
The lower band is calculated as exp(coef) * sma(close)
Instructions:
- Use with the symbol INDEX:BTCUSD so you can see the price since 2010
- Set the timeframe to weekly
- Use logarithmic chart (toggle "log" on)
Optionals:
- change the coef to 0.6 for a more conservative bottom
- change the coef to 0.4 for a more conservative top
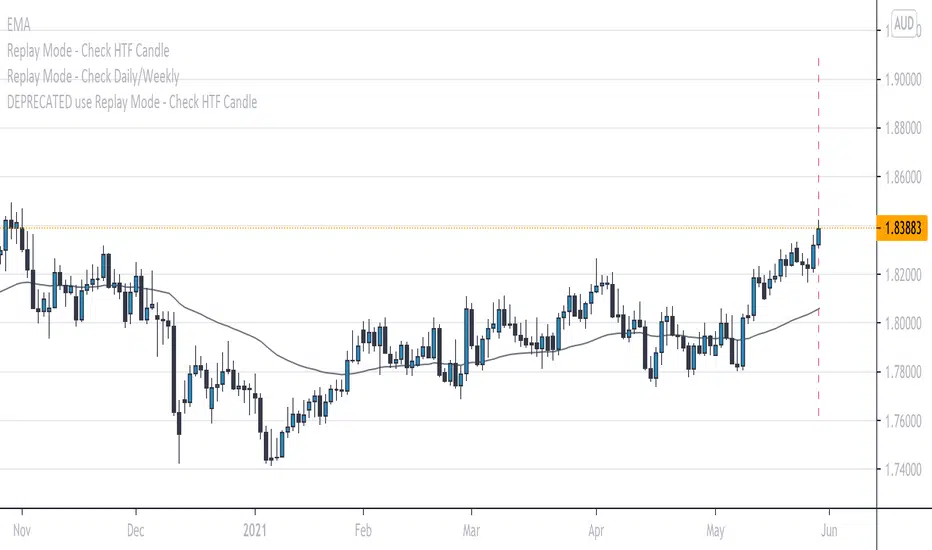
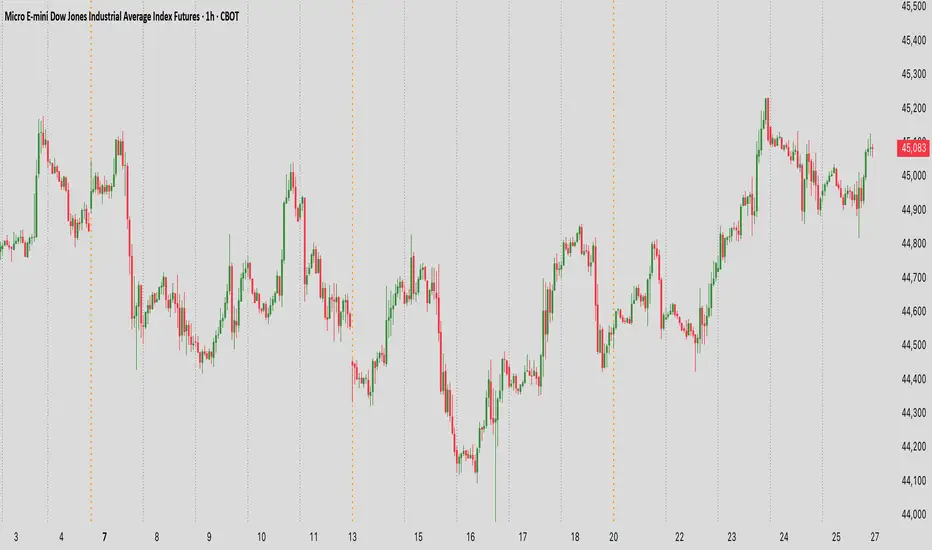
Replay Mode - Check Daily/WeeklyThis indicator is intended to be used while using Replay Mode.
It is similar to the built-in Session Breaks, but has the benefit of not needing to remove one candle before checking the Daily.
When on an intraday chart (timeframe less than Daily), a vertical line will be drawn when you can safely check the Daily or Weekly candle without seeing future price.
When the line is the color of your Daily settings, it is safe to check the Daily candle.
When the line is the color of your Weekly settings, it is safe to check both the Daily and Weekly candle.
Oasis Group - VWAP / OHLC (Daily / Weekly / Monthly)
5min with the Daily overlay
4hour with the Weekly overly
This Script was influenced be Chris Moody's OHLC Script.
I have created my version of the script and used it to Overlay Daily/Weekly/Monthly Candles over any chosen Intraday Time Frame.
**Important**
The "Stepline" Line style function in pine script is defective so anyone who wants to use this must change all line
styles to "Stepline" manually except for the VWAP Line.
This gives traders a great overall candle experience and also insight into the noise of the intraday.
Intraday traders can keep watch of the highs and Lows along with open and close levels for the larger time frames chosen.
Give us a Follow and Like. This can be used on any Asset class.
I personally use this on Intraday Trading.
Helps me Identify the Prior day Highs and Lows, Closing price compared to the next mornings Opening Price, and daily, weekly, or monthly ranges.
Also included is the powerful VWAP indicator for identifying bullish or bearish pysche.

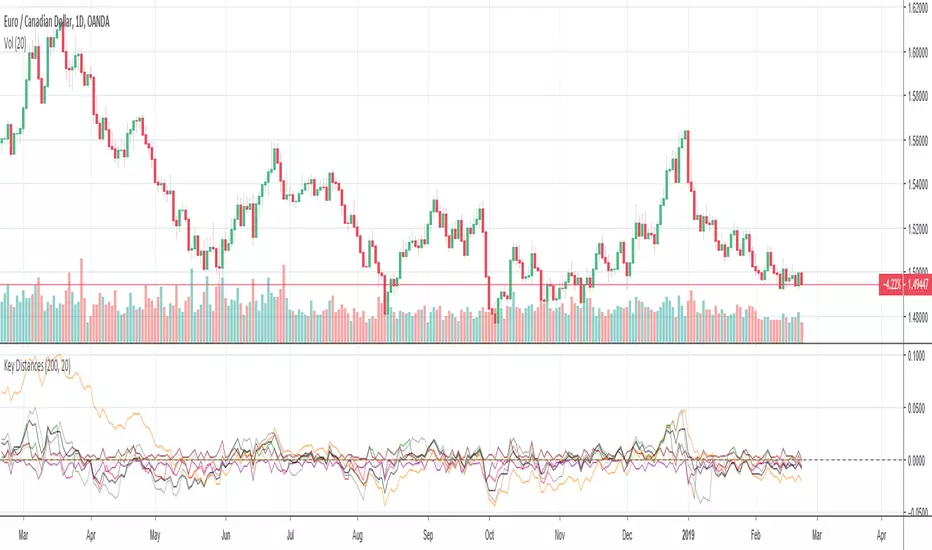
Key Distances (Weekly, Daily Open, & EMA)This indicator provides the pip value from various key levels I've found important in my trading system.
The results are graphed. I suggest that you choose the 2 most important ones you want to graph otherwise the indicator gets difficult to read.
The important data is the actual numbers but I've found it helpful to understand how a ticker moves in regards to weekly open and distance from 200EMA to be most helpful.
Here is the order of the data listed:
Distance from weekly open (green if above open, red if below open, also paints color on line)
Distance from last week opening price
Distance from daily open
Distance to 200EMA
Future Possible Updates:
- customized EMA
- Distance from weekly low/high
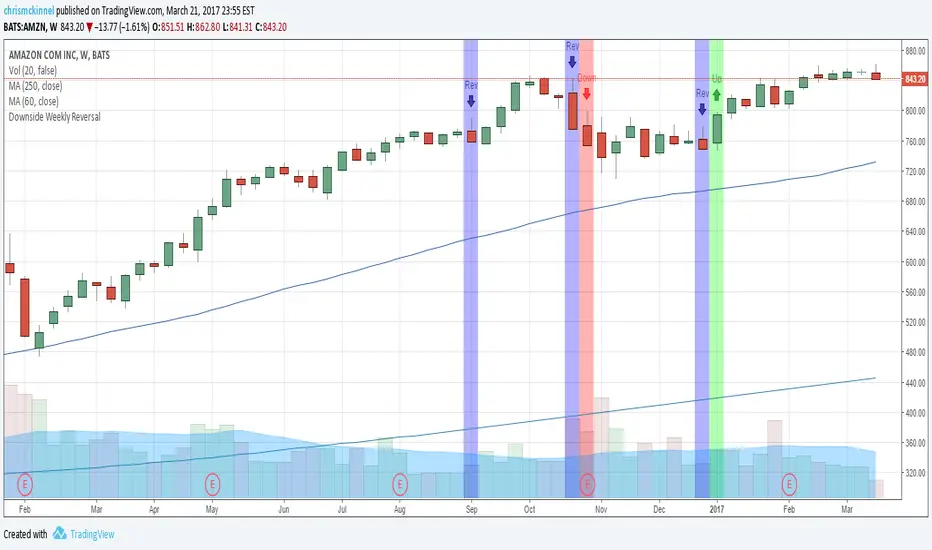
Downside Weekly ReversalBased on Thomas Bulkowski's top ranking small pattern: the Downside Weekly Reversal pattern.
Add this indicator to your weekly charts.
Blue bars represent weekly reversals and green bars following blue bars indicate an upside breakout. These are to be traded in a Bull market.
Red bars following blue bars indicate a downside breakout. These are to be traded in a Bear market.
More details: thepatternsite.com
Session, Daily, Weekly and Monthly Separators for Forex4 customizable sessions. Daily, weekly and monthly separators. Optimized for forex. An alternative futures script is available in my profile.

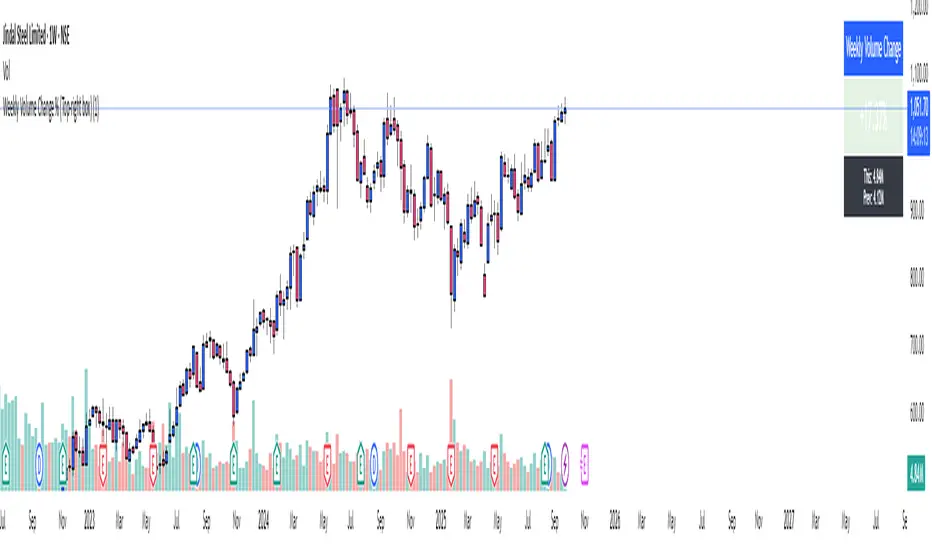
Weekly Volume ChangeWeekly Volume Change %
See weekly volume trends at a glance! This indicator shows current vs. previous week’s volume, calculates percent change, and highlights increases (green) or decreases (red). Features customizable look-back weeks and table color for easy visualization.
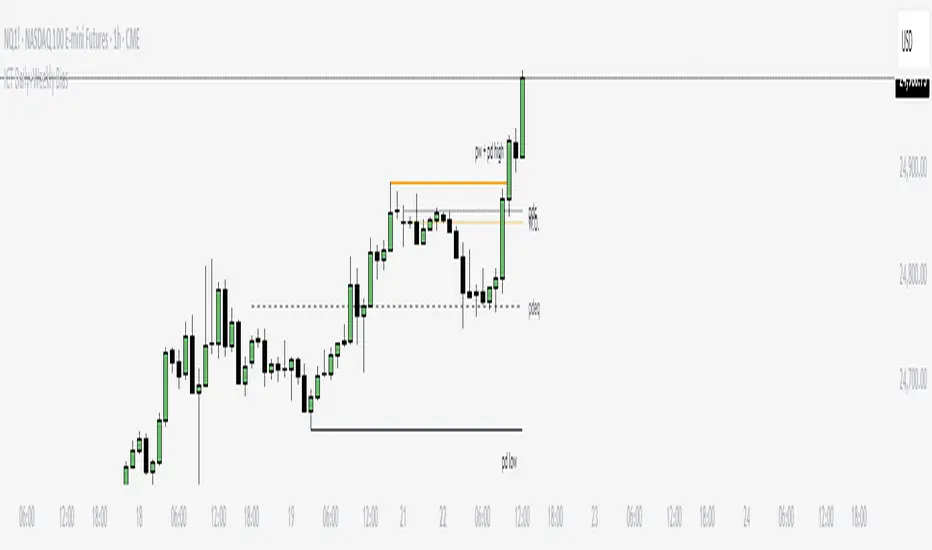
ICT Daily+Weekly BiasPrevious Day & Week Levels — Daily+Weekly Bias Visualizer
Plots previous-day (PDH/PDL/PDEQ) and previous-week (PWH/PWL) reference levels.
Use them to frame bias and identify the Draw on Liquidty.
Definitions
• PDH/PDL: Prior day high/low.
• PDEQ: Prior day equilibrium = (PDH + PDL) / 2.
• PWH/PWL: Prior week high/low.
Features
• PDH/PDL lines with optional labels at left or right edge.
• PDEQ line (0.5 of PD Range) with optional label.
• PWH/PWL lines with optional labels.
• Custom colors, styles, and width controls.
• Optional Price Labels
• Timeframe visibility limit.
• Lines extend and stop on mitigation (when breached).
*Also included in ICT ULT (All In One) Indicator
*Feel free to suggest improvement in the comments
Weekly ReboundWeekly Rebound analyzes weekly setups where price is below the EMA200 median (P50) and forms a red→green reversal.
It measures the maximum rebound (%) within 24 weeks and shows historical stats (average, median, P25–P75, time to peak).

Daily, Weekly, Monthly Separators (ScalpTheTicker)I put together this Daily, Weekly and Monthly separating indictor after I couldn't find one on Tradingview that did what I was looking for.
It is basic but it does the job I needed.
Feel free to use this indicator and hopefully it does what you need.
Weekly Range ProjectionsWeekly Range Projections
Inspired by toodegrees' excellent "ICT Friday's Asian Range" indicator
This indicator is a modified and enhanced version of the original Friday's Asian Range indicator created by toodegrees. While studying their brilliant work, I realized the concept could be expanded beyond just Friday's Asian session to create a more versatile tool for weekly price projections.
What's New?
I've transformed the original concept into a fully customizable range projection tool that allows traders to:
Select Any Day of the Week - Not limited to just Fridays anymore
Define Custom Time Ranges - Set your own start and end times to capture any session (Asian, London, New York, or custom ranges)
Flexible Deviation Levels - Choose between 1-9 standard deviations instead of the fixed 5
Toggle Body/Wick Ranges - Show or hide body and wick projections independently
Updated to Pine Script v6 - Taking advantage of the latest Pine Script features
How It Works
The indicator captures the price range (body and/or wick) during your specified time window on your chosen day, then projects standard deviation levels from that range. These levels often act as significant support/resistance throughout the week.
Use Cases
Weekly Opening Range - Capture Monday's opening range for week-long projections
Session-Based Analysis - Define any session on any day for targeted analysis
Multi-Timeframe Projections - Create different instances for various time ranges
ICT Concepts - Perfect for traders following ICT methodologies with customizable ranges
Credits
Huge thanks to toodegrees for creating the original Friday's Asian Range indicator and sharing it with the community. Their clean code structure and innovative approach to range projections inspired this modification. The core logic and visual presentation style remain true to their original vision, with added flexibility for broader applications.
If you find this useful, please also check out toodegrees' original indicators - they create fantastic tools for the TradingView community!
Settings Guide
Range Settings - Choose your day and define start/end times
Range Type - Toggle body and/or wick ranges
Deviations - Select how many standard deviation levels to display
Styling - Customize colors and line styles for both range types
Alerts - Set up alerts for price crossing specific deviation levels
Remember to use this on 5-minute or 15-minute charts as intended by the original design.
Note: This indicator follows the Mozilla Public License 2.0

Globex, Extended, Daily, Weekly, Monthly, Yearly Range* Adds Right Side Only Price Line & Labels for Tracking without Extending Both Sides
* Tracks Current, Previous, and Two Previous Globex Sessions/ Futures:
* Tracks Current, Previous, and Two Previous Extended Session/ Stocks:
* Tracks Current, Previous, Two, & Three Previous Day Session/ Equities:
* Tracks Current, Last, Two, Three, Four, & Five Week Session/ Equities:
* Tracks Current, Last, Two, Three, Four, & Five Month Session/ Equities:
* Tracks Current, Last, Two, Three, Four, & Five Year Session/ Equities:
* Allows Custom Range on Globex, Extended, & Daily Sessions
* Allows Custom Range on Weekly, Monthly, & Yearly Sessions
* Lines & Labels Are Not Visible on Chart Scales
* Reversible Text & Background Color
* Lines Extend Accordingly with Range
* Labels show Price & Percent Change
* Background Colors should match Chart Color to avoid Overlapping Text & Labels
* Lines have Offset Extension
* Labels have Offset Extension
* Globex Session is only visible on Futures & if Current Timeframe is Intraday
* Extended Session is only visible on Stocks & if Current Timeframe is Intraday
* Daily, Weekly, Monthly, & Yearly Sessions are visible on All Symbols & All Timeframes
* Globex, Extended, & Regular use their Default Time Sessions but allow Customization
* For Back Testing Default Sessions, switch over on the Menu to Style and Turn On/Off their Background Color; Any Area on the Chart Without Background Color is Regular Session

Daily Monday Weekly Monthly Quarterly Yearly High Low Mid This indicator can be useful for traders who are interested in analyzing price movements over different time periods. By displaying the daily, Monday, weekly, monthly, quarterly, and yearly high and low values along with their mid values on a chart, traders can get a better understanding of how prices have behaved over longer periods of time.
For example, a trader might use this information to identify trends or patterns in the market. They might look for occasions when the daily high and low values move outside of an established range or when the weekly or monthly mid values cross certain key levels. This could signal a potential change in the market trend that the trader could act upon.
Additionally, the code can help traders identify key support and resistance levels based on the high and low values of the candles. By plotting these values on a chart, traders can see where prices tend to find support or resistance over different time periods. This information can be used to place stop loss orders or take profit orders at important levels.
Overall, the benefit of using the code you provided is that it offers traders a comprehensive view of price movements over different time periods, which can aid in making more informed trading decisions.
Each level described above has its own unique label, which is abbreviated for convenience. These abbreviations are listed below for quick reference:
For daily levels: DH (Daily High), DM (Daily Mid), and DL (Daily Low)
For Monday levels: MonH (Monday High), MonM (Monday Mid), and MonL (Monday Low)
For monthly levels: MH (Monthly High), MU50 (Monthly 50 percent of Mid and High), MM (Monthly Mid), MD50 (Monthly 50 percent of Mid and Low), and ML (Monthly Low)
For quarterly levels: 3MH (Quarterly High), 3MU50 (Quarterly 50 percent of Mid and High), 3MM (Quarterly Mid), 3MD50 (Quarterly 50 percent of Mid and Low), and 3ML (Quarterly Low)
For yearly levels: YH (Yearly High), YU50 (Yearly 50 percent of Mid and High), YM (Yearly Mid), YD50 (Yearly 50 percent of Mid and Low), and YL (Yearly Low)
These labels can help you quickly identify the different levels and keep track of important price points.
If the chosen timeframe does not fall under the category of intraday, daily and Monday level will not be displayed.
Please feel free to send your suggestions to @z_mehran.

Know your Monthly, Weekly, Daily LevelsThis script will show monthly, weekly and daily (with or without pre market) levels on your intraday chart. You can chose what values of the corresponding candles (high, low, close) should be included.
Please consider following limitations:
1. Maximum of 500 drawing objects per chart
To make sure the most relevant levels are shown, values are sorted based on the latest close value before levels > 500 are cut off.
2. Lookback history
The max lookback history is limited by the currently selected timeframe. E.g. on a 5min timeframe, 20000 bars (Premium Plan) result in approx. 5 months of lookback period, meaning you may want to have a 30 min or higher chart open to get a complete picture of levels, while trading on a lower timeframe.
High/Low/Open/Close Daily, Weekly, Monthly Line
I wrote this for the purpose of saving time while marking up charts by automating the process of drawing and labeling lines at areas of interest on larger
timeframes while still having the option to change the style and size of the lines and labels to adjust for any timeframe and avoid a messy chart.
I also used this as an exercise in menu organization giving users every imaginable option and producing clean readable code.
- This indicator draws a line on the Daily, Weekly, and Monthly bar at the High, Low, Open and Close of each bar as price
tends to react when revisiting these areas.
- Each set of bars has an optional identifying label with its own color set that can be shown with or without the lines
price value, and has drop down menus for size and style of each set of labels.
- Each set of lines has inputs for line/text color, line width and style, and can be hidden if the user doesn't have the need for any particular timeframe.
- Lines and Labels with delete when a new line is created.
- I recommend going into Chart Settings/Status Line and turning off indicator arguments OR moving the script to the top
of the indicator list to avoid an obstructed chart view with this indicators arguments. When Pine allows, I will update it to hide them.
Contains some public domain code from T.V. manuals and tutorial for creating drop down input menus for options.
/ ~For My Pal Jittery~
~ Who likes his clean chart and custom colors~

Key Levels (Time Frames - Weekly,Monthly,Quarterly,Yearly)This indicator plots the 4h, Daily, Weekly, Monthly, Quarterly, Yearly Open High, Low and Mids.
You can watch how these institutional trading levels work as support and resistance.
Most Important you can add alerts to these levels with a few clicks.
Just add/remove unnecessary levels for scaling problems.
For any error/suggestion/improvement just let me know.

Naked - Daily Weekly MonthlyUser request for Naked Daily Weekly Monthly Opens.
This indicator plots the Daily Weekly Opens (the day after day after creation), they then will stay on the chart until a candle close is completed on the other side of the plot.
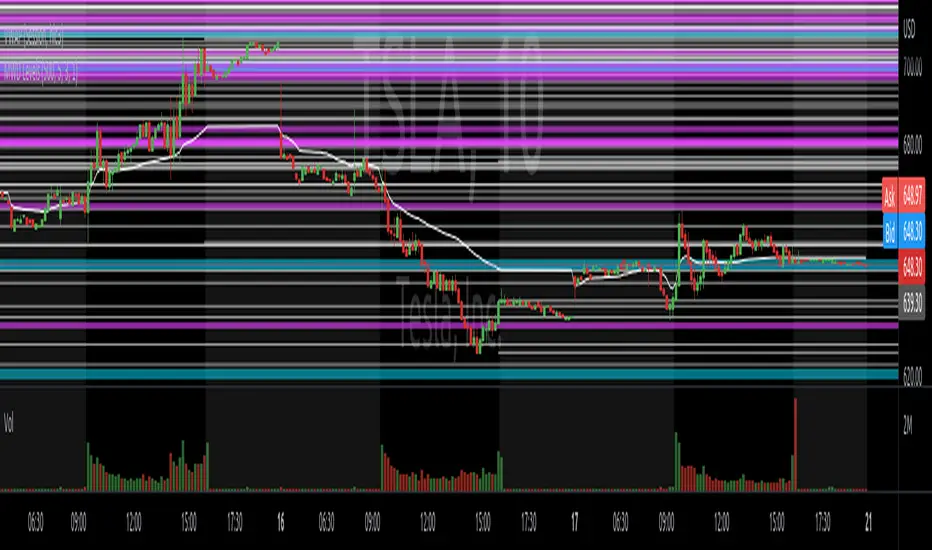
In the above chart picture you can see how previous monthly and daily opens have acted as support and resistance.
Thanks go to:
StackOverFlow Bjorn Mistiaen
Day Selectable Weekly Anchor VWAPSimple script to anchor VWAP on selected day of the week.
It is very useful when you want to anchor VWAP from a particular day instead of default Monday when you use weekly VWAP
Please note that this is a weekly VWAP and not daily or monthly vwap.
Example use case:
Lets say I want to anchor VWAP on specific day like Friday instead of Monday, I would just select the Friday from the drop down window and voila!

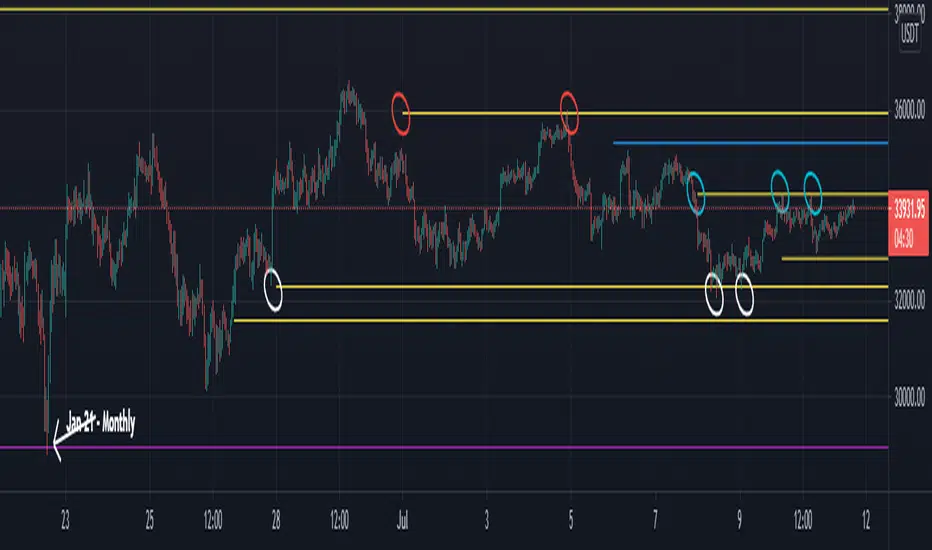
Yearly Weekly Monthly Monday Levels This script displays the Open, High, Low and Mid ranges for Yearly levels, Monthly levels, Weekly levels, and Monday range levels (useful support and resistance levels)
Opens are displayed in dashed lines, and mid-levels in dotted lines. Other lines (highs and lows) are in plain lines.
Each color represent a time horizon:
- Red: Yearly levels
- White: Monthly levels
- Yellow: Weekly levels
Colors are changeable (even though color inputs are not still available in Version 4 of TradingView PineScript).
