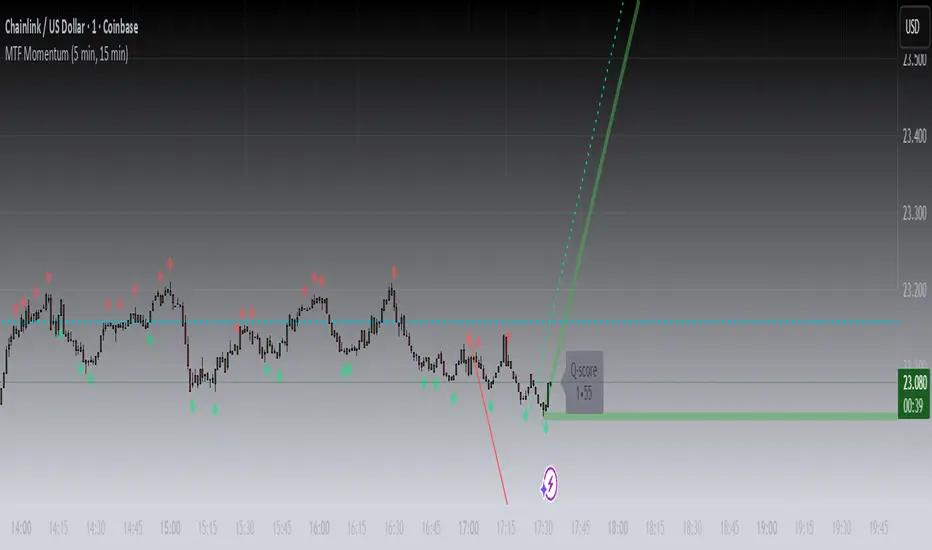
MTF MomentumUniqueness:
MTF Momentum is designed to provide true multiple-timeframe information at once on a single screen with as little clutter as possible. What makes MTF Momentum unique is the way it condenses the perspectives of our other internal models into a single bullish or bearish slope near the current candle, then automatically draws the same bullish or bearish momentum slopes of the next higher timeframes. The structure is engineered to highlight shifts in momentum as they happen on the current candle (angled lines), marking potential reversal points as they build (red and green diamonds), and provides a numerical Q-Score that draws a horizontal marker for elevated Q-Score exhaustion. The design avoids telling you when to buy or sell. Instead, it structures the raw inputs in a way that makes interpretation easier. That makes it useful whether you’re trading actively or simply learning to recognize how momentum flows across layers.
Usefulness:
This indicator is designed to work across multiple timeframes. Instead of juggling the same indicator on 3 different screens, you can see a unified picture that captures both the local momentum and higher timeframes that provide time-dimensional context. When short-term and higher-timeframe angles point in the same direction, MTF Momentum makes that visible in a straightforward way and may help highlight when momentum is consistent across multiple timeframes. When short-term layers push against a stronger higher timeframe, it signals that momentum may be shifting or exhausting. This indicator provides an efficient workflow and helps reduce clutter.
How It Works:
At its core, MTF Momentum is a blend of momentum readings from multiple sources — RSI slopes, EMA stacks, Gaussian smoothing, Fisher-style transforms, and MACD widening analysis built from the same shared core mathematical engines as our other indicators. The uniqueness of this indicator is not tied to any single formula as each component is well-known, but it is in the way they are layered, smoothed, and consolidated that entirely new readings are created.
The process begins with multiple RSI calculations, offset and averaged to reduce jitter. These are smoothed through EMA stacks of varying lengths, then run through Gaussian-style filters that emphasize directional change while filtering noise. The slope differences across these layers form the foundation of the momentum calculation. This momentum reading is then checked against MACD widening conditions. MACD gap expansion is treated as a momentum confirmation — widening gaps with price in agreement add weight, while narrowing gaps or misaligned candles reduce confidence. Additional derivative logic, including Fisher-style transforms, is applied to normalize the outputs and make them more stable across different assets.
Multi-timeframe integration comes from using request.security to pull higher timeframe versions of the same structures that are on the base chart. For example, you can see a one-minute chart overlaid with five-minute and fifteen-minute context. The blending is seamless — higher timeframe momentum is displayed alongside lower timeframe signals that help the user see where current timeframe momentum is in relation to higher timeframes.
How to Use the MTF Momentum Indicator:
Applying the MTF Momentum indicator is straightforward, but interpretation depends on your process.
To use, load the indicator on your preferred base timeframe. Use this general guideline to setup your indicators:
Base timeframe -> 1st HTF -> 2nd HTF
1min -> 5min -> 15min
5min -> 15min -> 1hr
15min -> 1hr -> 4hr
1hr -> 4hr -> 1day
4hr -> 1day -> Weekly
1day -> Weekly -> Monthly
Weekly -> Monthly -> Yearly
When used at base timeframes at 1 hour or lower, higher timeframe lines ARE drawn automatically.
When using a base timeframe above 1 hour (e.g., 4h, Daily), higher-timeframe slopes are NOT drawn automatically. To view them, switch to the higher-timeframe chart itself (for example, Daily or Weekly) and draw an arrow along the slope using TradingView’s drawing tools. Once placed, the arrow will remain visible when you return to your lower base timeframe chart, giving you the higher-timeframe context alongside your current view. This step is optional, purely for visual reference, and does not affect the indicator’s calculations.
These are your higher timeframe momentum angles that can help provide context to the automatically drawn angle on your current timeframe. You can even practice drawing these lines on the lower timeframes such as using a 5min base and 15min and 1hr HTF charts. You can compare your manually drawn angles with the automatic HTF lines by enabling them in the INPUTS tab of the MTF Momentum settings menu.
Q-SCORE:
The Q-Score label presents two values ranging from 0 to 100. These values are a numerical translation of the same momentum conditions our other indicators display visually. Higher values indicate stronger readings of exhaustion within the current trend model, while lower values indicate less. You can think of this as similar to a distribution curve, where some states occur less frequently at the extreme ends of the range and more frequently near the middle. Q-Score values are provided as contextual information only and do not predict reversals or guarantee outcomes.
Blue Dotted & Solid Horizontal line:
The aqua blue horizontal line is a visual representation of the Q-Score values. When one or both numerical values is below 85 the line stays dotted -- it is only when both numerical values exceed 85 that the line changes from dotted to solid.
Green & Red Diamonds:
Diamonds mark areas where the underlying model detects counter-trend behavior. They may flicker on the current candle during intrabar calculations but are locked in at candle close and never get altered or repainted.
Red diamonds highlight points where the model detects counter-trend pressure during a bullish phase. Green diamonds highlight counter-trend pressure during a bearish phase. These markers reflect where momentum conditions have shifted relative to the prevailing trend. They appear where short-term dynamics differ from the broader trend. Traders can interpret these areas in their own context; the diamonds themselves do not predict reversals or guarantee outcomes.
Example ways to use the MTF Momentum indicator:
Look for agreement -- when both your base timeframe and higher timeframe momentums are pointing in the same direction, it reflects stronger alignment. This may help identify areas of trend continuation.
Watch for divergence -- if your short-term momentum pushes opposite to the higher timeframe, it flags a potential transition.
Disclaimer:
This tool does not generate buy or sell signals. It is a framework for visualizing momentum across layers, allowing you to incorporate that information into your own decision-making. How you apply it depends entirely on your goals, timeframe, and risk tolerance. This indicator is provided for educational and informational purposes only. It does not constitute financial advice, trading advice, or investment recommendations. Trading involves risk, and you may lose some or all of your capital. Past performance is not a guarantee of future results. You are solely responsible for any decisions you make — always trade to the best of your own abilities and within your own risk tolerance.
Release Notes:
v1.0 (Initial Release)
Cerca negli script per "weekly"
SOL Dashboard v6 — Investor / Swing / Scalp (VWAP, ATR, RS (SCP)
**SOL Dashboard v6 — Investor / Swing / Scalp (VWAP, ATR, RSI, BTC\Ð influence, noise-filters)**
**In short:** a universal indicator for SOLUSDT (Spot/Futures), combining three analysis horizons — Investor (D1), Swing (H1/H4), and Scalp (5m/3m/1m) — in a single script. It provides clean signals (arrows), a summary table of layer states, alerts, as well as a set of noise filters (VWAP/RSI/volume/EMA “gap”/candle body requirement/cooldown). Optional BTC/ETH trend influence filters are available. Suitable for both spot and futures.
---
### What the indicator does
**Investor (HTF, default D1):** market background. EMA(50/200) → defines long-term phase (BULL/BEAR/NEUTRAL).
**Swing (MTF, default H1):** medium-term direction. EMA(20/50) + weekly VWAP (option).
**Scalp (LTF, default 5m):** quick entries. EMA(9/21) → SCALP BUY/SELL arrows strictly at the crossover candle, plus filters.
---
### Visual elements
* EMA lines for each layer (toggled on/off).
* VWAP lines: daily (scalp filter) and weekly (swing filter).
* SCALP BUY / SCALP SELL arrows (optional).
* Table in the top-right corner: Investor/Swing/Scalp modes and hints (including BTC/ETH states if influence is enabled).
* (Optional) Debug label — shows which filter is blocking the signal (RSI/VWAP/GAP/BODY/VOL/AGREE/CD).
---
### Signals (arrow logic)
**Base trigger:** crossover(EMA Fast, EMA Slow) on bar close (default EMA9/21 for LTF).
Arrows appear only if confirmations are met:
1. EMA slope matches signal (both rising for BUY / both falling for SELL).
2. Candle closed on the “correct” side of both EMAs (above/below).
3. Noise filters (toggleable/configurable):
* VWAP (daily): BUY only above VWAP; SELL only below.
* RSI(14): BUY if RSI>50; SELL if RSI<50.
* EMA-Gap (%): minimum difference between Fast/Slow EMAs (avoids micro-crossovers in chop).
* Body ratio: minimum body-to-range ratio (filters out dojis/wicks).
* Volume filter: volume ≥ median over N bars (default 20).
* Cooldown: minimum bars between same-direction signals.
4. Trend agreement (optional): requires alignment with Swing and BTC/ETH Swing modes.
**Result:** an arrow appears at the crossover only if all active filters are satisfied.
---
### Alerts
* **SCALP BUY (filtered):** “ETH/SOL scalp BUY (cross-confirmed)”
* **SCALP SELL (filtered):** “ETH/SOL scalp SELL (cross-confirmed)”
* (Optional) EXIT signals (if included in your build): exit on opposite side of EMA25 or VWAP.
---
### BTC/ETH influence (optional)
* Toggleable trend filters:
* Script checks BTCUSDT and/or ETHUSDT Swing states (EMA20/50 on H1/H4).
* BUY only if BTC/ETH are in BULL and SOL(H1) is BULL.
* SELL only if all corresponding Swing modes are BEAR.
This increases accuracy in trending markets (can be disabled in chop if you want more entries).
---
### Recommended presets
**1) Conservative (cleaner, less noise):**
* LTF = 5m (or 3m); EMA 9/21
* VWAP daily: ON, RSI: ON
* minEmaGapPct: 0.12–0.14%
* minBodyRatio: 0.60–0.70
* cooldownBars: 7–10
* BTC/ETH agreement: ON
* confirmBars: 1 (or 0 in trends)
**2) Base (balanced):**
* LTF = 5m; EMA 9/21
* VWAP: ON, RSI: ON
* minEmaGapPct: 0.08–0.12%
* minBodyRatio: 0.55–0.65
* cooldownBars: 5–7
* BTC/ETH agreement: ON in trend / OFF in chop
* confirmBars: 0 (or 1 in chop)
**3) Aggressive (more entries):**
* LTF = 3m or 1m; EMA 7/14 (or 7/25 if enabled)
* VWAP: ON, RSI: ON
* minEmaGapPct: 0.06–0.08%
* minBodyRatio: 0.50
* cooldownBars: 3–5
* BTC/ETH agreement: OFF in chop
* confirmBars: 0 (or 1 if too many false signals)
---
### How to read the summary table
* **Investor (D1):** EMA50 vs EMA200 → BULL/BEAR/NEUTRAL.
* **Swing (H1/H4):** EMA20 vs EMA50 (+ W-VWAP) → trade direction.
* **Scalp (LTF):** EMA Fast vs EMA Slow → short-term phase.
* **BTC / ETH (Swing):** their states (if influence enabled).
👉 Alignment of Investor + Swing + Scalp in one direction = maximum trend strength.
👉 Disagreement = reduce position size / wait for confirmation.
---
### Practical application
* **Entries:** SCALP arrows in Swing direction (and optionally BTC/ETH) + above/below VWAP.
* **Stops:** recommended ATR(14, LTF) × 1.6–2.0 (or beyond EMA21/EMA25).
* **Targets:** at least 1.8–2.2 R, take 30–50% at +1R, leave remainder as trailing (EMA9/EMA25/VWAP).
* **Trend filter:** trade longs mainly when price > daily VWAP and Swing = BULL (and vice versa).
---
### Settings (key parameters)
* Independent TFs for Investor / Swing / Scalp.
* EMA Fast/Slow set separately for each layer.
* VWAP (Daily/Weekly) as toggleable filters.
* RSI filter (BUY >50 / SELL <50).
* Noise filters: EMA-Gap, Body ratio, Volume ≥ median, Cooldown.
* Trend agreement: BTC/ETH Swing + SOL Swing.
* Debug mode: shows which filter is blocking a signal.
---
### FAQ
**Why no arrows when “crossover is visible”?**
Because arrows are plotted on bar close only if all active filters (VWAP/RSI/GAP/BODY/VOL/AGREE/CD) are satisfied. Enable Debug to see which filter blocks the signal.
**When to enable BTC/ETH influence?**
In trending markets → ON (accuracy ↑). In chop, if you want more entries → OFF.
**Works on Spot/Futures?**
Yes. But remember: futures fees are charged on position notional, not margin — factor this into risk management.
---
### Disclaimer
This is a research tool. Not financial advice. Trading crypto assets and derivatives carries high risk (especially with leverage). Always use stop-losses and manage risk per trade.
---
\#SOL #SOLUSDT #Scalping #Swing #Investor #VWAP #EMA #RSI #ATR #Crypto #Futures #NoiseFilters #BTCInfluence #ETHInfluence #TrendFilter #TradingView

SMR - Simple Market Recap📊 Simple Market Recap (SMR)
🎯 A comprehensive market overview tool displaying price changes, percentage movements, and status indicators for multiple financial instruments across customizable timeframes with intelligent data synchronization.
━━━━━━━━━━━━━━
📋 OVERVIEW
The Simple Market Recap indicator provides a professional market analysis dashboard that displays key performance metrics for major financial instruments. This educational tool features intelligent asset selection, automatic dark mode detection, comprehensive period analysis with bilingual support, and advanced data synchronization ensuring accurate price data regardless of the current chart symbol.
Perfect for:
Market overview analysis and educational study
Multi-asset performance comparison and research
Weekly, daily, and monthly market recap visualization
Educational purposes and market trend analysis
━━━━━━━━━━━━━━
🚀 KEY FEATURES & ENHANCEMENTS
🌙 Intelligent Dark Mode Detection
Automatic chart background color analysis and adaptation
Dynamic color scheme adjustment for optimal visibility
Enhanced contrast ratios for both light and dark themes
Professional appearance across all chart backgrounds
📊 Comprehensive Asset Coverage
Major Forex Pairs: EURUSD, GBPUSD, AUDUSD, NZDUSD, USDCHF, USDJPY, USDCAD
Indices & Dollar: DXY (US Dollar Index), SPX (S&P 500)
Commodities: XAUUSD (Gold), USOIL (Crude Oil)
Bonds: US10Y (10-Year Treasury)
Cryptocurrencies: BTCUSDT, ETHUSDT
Selective asset display with individual on/off controls
Fixed asset order: DXY, EURUSD, GBPUSD, AUDUSD, NZDUSD, USDCHF, USDCAD, USDJPY, XAUUSD, USOIL, SPX, US10Y, ETHUSDT, BTCUSDT
⏰ Flexible Timeframe Analysis
Multiple Periods: Daily (1D), Weekly (1W), Monthly (1M)
Time Selection: Current Period or Previous Period analysis
Dynamic Titles: Automatic report naming with dates and periods
Historical Comparison: Compare current vs previous period performance
📈 Enhanced Data Visualization
Professional table with adaptive row count based on selected assets
Color-coded price movements: Enhanced green for positive, bright red for negative
Status emojis: ↗️ Up, ↘️ Down, ↔️ Sideways, ❓ No data
Smart price formatting based on asset type and price level
Improved contrast colors for better visibility in all lighting conditions
🔄 Advanced Data Synchronization
Symbol-Independent Accuracy: Correct data display regardless of current chart symbol
Real-Time Security Requests: Direct data fetching from specific instrument sources
Cross-Asset Reliability: Accurate price data for all monitored assets simultaneously
Data Integrity: No cross-contamination between different financial instruments
━━━━━━━━━━━━━━
🎨 PROFESSIONAL TABLE LAYOUT
Adaptive Design Features:
Automatic dark mode detection and color adaptation
Enhanced contrast ratios for better readability
Professional color scheme with clear data separation
Responsive design for all screen sizes and themes
Comprehensive Data Display:
Dynamic Title Row: Period-specific report titles with dates
Asset Column: Selected financial instruments
Open/Close Prices: Period opening and closing values
Change Percentage: Color-coded performance indicators
Pips Movement: Precise pip calculations for each asset
Status Indicators: Visual emoji representations of trend direction
Visual Design Features:
Merged title cells for clean header presentation
Asset-specific price formatting for optimal readability
Color-coded positive/negative movements
Professional table borders and spacing
━━━━━━━━━━━━━━
⚙️ ADVANCED CUSTOMIZATION
Timeframe Controls:
Report Period selection: Daily, Weekly, or Monthly analysis
Time Selection toggle: Current vs Previous period comparison
Dynamic row count based on active asset selection
Automatic title generation with period-specific formatting
Asset Selection:
Individual toggle controls for each supported asset
Major forex pairs with complete coverage
Cryptocurrency and precious metals options
Index and commodity instrument support
Display Options:
9 table positioning options across the entire chart
5 text size levels from Tiny to Huge for optimal visibility
Language selection between English and Vietnamese
Automatic theme adaptation for all chart backgrounds
━━━━━━━━━━━━━━
⚠️ EDUCATIONAL & ANALYTICAL PURPOSE
This indicator is designed exclusively for educational market analysis and research purposes .
📚 Educational Applications:
Understanding multi-asset market performance correlation
Studying period-based price movements and trends
Analyzing market volatility across different timeframes
Learning to read and interpret market recap data
📊 Analysis Capabilities:
Market overview visualization for educational study
Multi-timeframe performance comparison research
Historical period analysis and trend identification
Cross-asset correlation studies and market research
🚨 Important Disclaimer: This tool provides educational market data visualization only and does NOT generate trading signals or investment advice. All data is for learning and analysis purposes. Users must conduct independent research and consult financial professionals before making any investment decisions.
━━━━━━━━━━━━━━
🛠️ SETUP & CONFIGURATION
Quick Start Guide:
Add the indicator to your chart from the indicators library
Select your preferred language (English or Vietnamese)
Choose your desired reporting timeframe (Daily, Weekly, or Monthly)
Select Current Period or Previous Period for analysis
Toggle on/off specific assets you want to monitor
Adjust table position and text size for optimal viewing
Advanced Configuration:
Customize asset selection based on your analysis needs
Configure timeframe settings for different market studies
Set up language preferences for your region
Fine-tune display options for your screen setup
Optimize table positioning for your chart layout
Theme Optimization:
Indicator automatically detects your chart theme
Colors adapt automatically for optimal contrast and readability
No manual adjustments required for theme changes
Professional appearance maintained across all backgrounds
━━━━━━━━━━━━━━
🔧 TECHNICAL SPECIFICATIONS
Performance & Reliability:
Pine Script v6 with optimized data retrieval
Real-time updates with minimal CPU and memory usage
No repainting or lookahead bias in calculations
Stable performance across all timeframes and instruments
Universal Compatibility:
Works with all TradingView chart types and instruments
Compatible with mobile and desktop platforms
Supports all timeframes with period-specific analysis
Cross-platform functionality with consistent behavior
Data Precision:
High-precision floating-point calculations
Asset-specific formatting and pip calculations
Real-time price data from multiple exchanges
Accurate percentage and movement calculations
Advanced Features:
Automatic chart background detection and color adaptation
Dynamic table sizing based on active asset selection
Intelligent price formatting for different asset classes
Professional status indicators with emoji visualization
━━━━━━━━━━━━━━
📋 VERSION HISTORY
v1.7 - Enhanced Data Synchronization & Color Improvements
Fixed critical data synchronization issue - accurate data regardless of current chart symbol
Enhanced data retrieval system with symbol-specific security requests
Improved color scheme: brighter red for negative values, enhanced contrast
Fixed asset order: DXY, EURUSD, GBPUSD, AUDUSD, NZDUSD, USDCHF, USDCAD, USDJPY, XAUUSD, USOIL, SPX, US10Y, ETHUSDT, BTCUSDT
Optimized price formatting with proper decimal display and leading zeros
Enhanced calendar-based time calculations for accurate period reporting
Improved pip calculations for different asset classes
Professional color coding with adaptive contrast for all themes
Previous Versions:
v1.6 - Data accuracy improvements and bug fixes
v1.5 - Enhanced market analysis with flexible timeframes
v1.4 - Professional table layout and bilingual support
Earlier versions - Core market data display functionality development
━━━━━━━━━━━━━━
Author: tohaitrieu
Version: 1.7
Category: Market Analysis / Educational Overview
Language Support: English, Vietnamese
License: Educational Use Only
This indicator is provided exclusively for educational and analytical purposes to help users understand market overview concepts and multi-asset analysis. It features automatic theme adaptation, flexible timeframe analysis, enhanced data synchronization, and comprehensive market data visualization for the most accurate and informative educational experience. It does not provide trading signals or investment advice. Always conduct thorough research and consider professional guidance before making financial decisions.

Monday's Range Superpowerkyu🔔 Settings
You can customize the colors and toggle ON/OFF in the indicator settings.
Works on daily, hourly, and minute charts.
Easily visualize Monday’s high, low, and mid-line range.
📌 1. Support & Resistance with Monday’s Range
Monday High: Acts as the first resistance of the week.
◽ Example: If price breaks above Monday’s high after Tuesday, it signals potential bullish continuation → long setup.
Monday Low: Acts as the first support of the week.
◽ Example: If price breaks below Monday’s low, it signals bearish continuation → short setup.
📌 2. Mid-Line Trend Confirmation
Monday Mid-Line = average price of Monday.
Price above mid-line → bullish bias.
Price below mid-line → bearish bias.
Use mid-line breaks as entry confirmation for long/short positions.
📌 3. Breakout Strategy
Break of Monday’s High = bullish breakout → long entry.
Break of Monday’s Low = bearish breakout → short entry.
Place stop-loss inside Monday’s range for a conservative approach.
📌 4. False Breakout Strategy
If price breaks Monday’s high/low but then falls back inside Monday’s range, it is a False Breakout.
Strategy: Trade in the opposite direction.
◽ False Breakout at High → short.
◽ False Breakout at Low → long.
Stop-loss at the wick (extreme point) of the failed breakout.
📌 5. Range-Based Scalping
Use Monday’s high and low as a trading range.
Sell near Monday’s High, buy near Monday’s Low, repeat until breakout occurs.
📌 6. Weekly Volatility Forecast
Narrow Monday range → higher chance of strong trend later in the week.
Wide Monday range → lower volatility expected during the week.
📌 7. Pattern & Trend Analysis within Monday Range
Look for candlestick patterns around Monday’s High/Low/Mid-Line.
◽ Example: Double Top near Monday’s High = short setup.
◽ Repeated bounce at Mid-Line = strong long opportunity.
✅ Summary
The Monday’s Range (Superpowerkyu) Indicator helps traders:
Identify weekly support & resistance
Confirm trend direction with Mid-Line
Trade breakouts & false breakouts
Apply range scalping strategies
Forecast weekly volatility
⚡ Especially, the False Breakout strategy is powerful as it captures failed moves and sudden sentiment reversals.

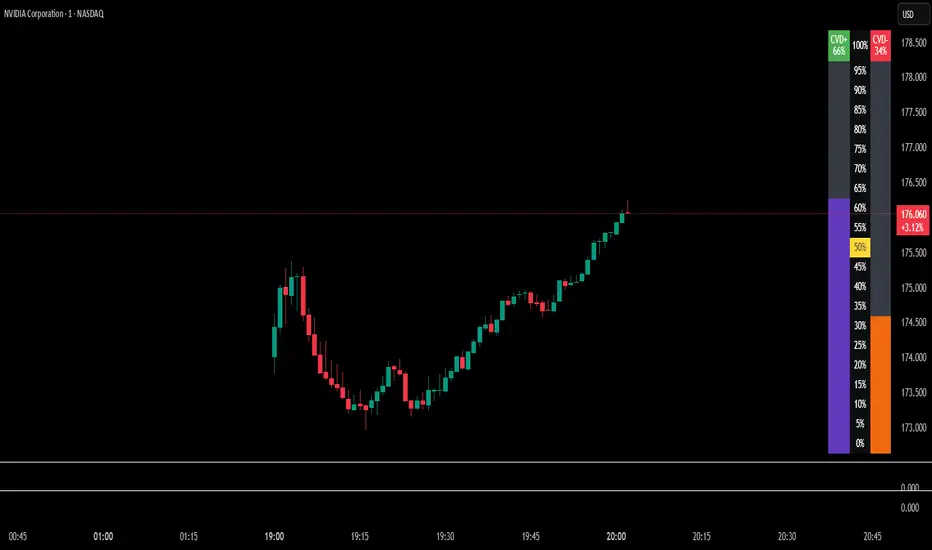
Bull/Bear Thermometer - GSK-VIZAG-AP-INDIABull/Bear Thermometer - GSK-VIZAG-AP-INDIA
Overview
The Bull/Bear Thermometer is a visual volume-based indicator designed to gauge the cumulative buying (bullish) and selling (bearish) pressure over customization time intervals on any chart. It uses Cumulative Volume Delta (CVD) to track buying and selling dominance and visually represents this data as vertical bar meters with percentage scales.
Key Features
Multi-Time frame Accumulation: Allows users to select accumulation intervals - Daily, Weekly, or Monthly - adapting to their trading style and time frame.
Cumulative Volume Delta (CVD) Computation: Calculates the net buying and selling volume by comparing volume on bullish and bearish bars to measure market strength.
Visual Thermometer Display: Presents buying (CVD+) and selling (CVD-) dominance in colorful vertical bars on an easy-to-read table overlay on the price chart.
Percentage Scale with Highlights: Includes a percentage scale from 0% to 100%, highlighting the important 50% benchmark with a yellow line for quick reference.
Clear Color Coding: Uses green and red color schemes to represent bullish and bearish pressure, with distinctive numeric labels.
Customization Reset Points: Weekly reset day and Monthly reset date options ensure the accumulation aligns with user preference or trading strategy cycles.
Inputs and Usage
Select Time frame: Choose how the buying/selling volume is accumulated — Daily, Weekly (reset day configurable), or Monthly (reset date configurable).
Volume-Based Signals: Monitor changes in buying and selling pressure levels as the market tides shift.
Table Display: A table positioned at the bottom right corner overlays the price chart showing percentage bars for both buying and selling dominance.
Ideal for: Day traders, swing traders, and volume-focused market analysts who want a quick visual summary of market sentiment.
How It Works
The indicator tracks volume on each bar, assigning positive or negative values depending on whether the bar closes higher or lower than the previous.
It accumulates these values over the selected time frame to calculate the cumulative buying (green) and selling (red) volumes.
The data is then converted to percentages and mapped as vertical colored bars in the table.
The midpoint (50%) is highlighted with a yellow line, helping traders quickly assess bullish/bearish balance.
Why Use This Indicator?
Simplicity: Easy to interpret visual thermometer of market sentiment.
Customization: Flexible period settings align with different trading styles.
Volume Insight: Goes beyond price action, factoring volume momentum for deeper market understanding.
Non-intrusive Overlay: Displayed neatly on chart without clutter or distraction.
Recommended Pairings
Use alongside price action or trend indicators.
Suitable for equities, futures, forex, and crypto instruments where volume data is reliable.
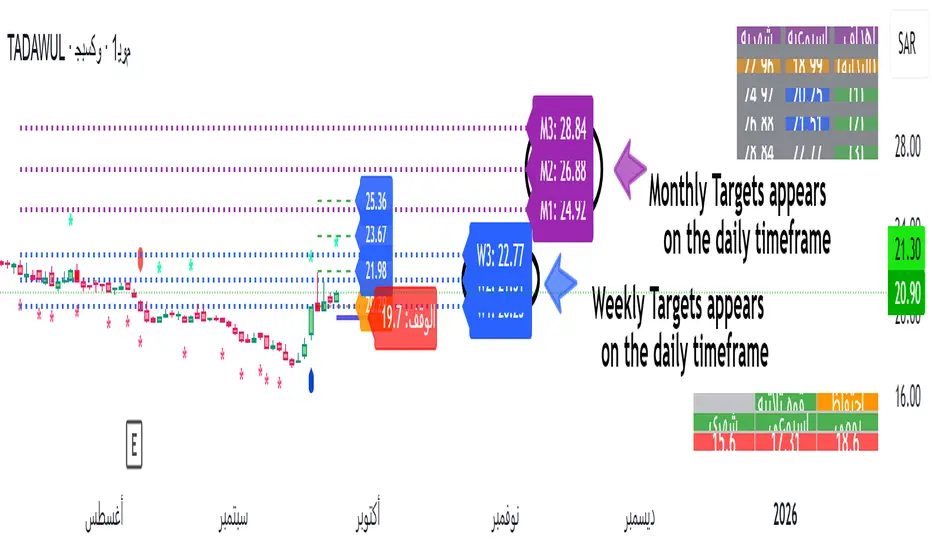
MTF POWER OF 3 TNF💻Types of Candlesticks in the Indicator
• Strong/Valid Candles: Identified by small asterisks below and above the candlestick body; Those with a body larger than 55% of the candle's total range.
• Tailed Candles: Are not marked by asterisks.
( onedrive.live.com)]! ( onedrive.live.com)
The General Idea of the Indicator's Signals
The indicator generates signals based on specific candlestick patterns. It identifies valid candlesticks (those with a body larger than 55% of the total candlestick range) and marks them with asterisks above and below the body. Candlesticks with significant tails (long wicks) that do not meet the criteria are not marked.
These signals help traders spot potential trend reversals or continuation patterns, depending on the context and location of the marked candles within the broader price action.
(onedrive.live.com)]! (onedrive.live.com)
Daily time frame conditions
( onedrive.live.com)]! ( onedrive.live.com)
Weekly and monthly time frame conditions
( onedrive.live.com)]! ( onedrive.live.com)
( onedrive.live.com)]! ( onedrive.live.com)
(onedrive.live.com)]! (onedrive.live.com)
(onedrive.live.com)]! (onedrive.live.com)
Best Trading Conditions
- Condition 1: (the best)
• Daily Timeframe: Buy
• Weekly Timeframe: Positive (Bullish)
• Monthly Timeframe: Positive (Bullish)
( onedrive.live.com)]- ! ( onedrive.live.com)
- Condition 2:
• Daily Timeframe: Buy
• Weekly Timeframe: Positive (Bullish)
• Monthly Timeframe: Negative (Bearish) (with the condition that monthly resistance is distant)
(onedrive.live.com)]- ! (onedrive.live.com)
- Confirmatory trend line
( onedrive.live.com)]- ! ( onedrive.live.com)
- Volume detection by candle colors;
- ! (onedrive.live.com)
DTT ⴵDTT ⴵ — Watermarks, Sessions & HTF Countdown
DTT ⴵ is a clean, lightweight utility for adding professional watermarks and time-based reminders to any chart. It displays your brand/title, live market data (ticker/price/timeframe), the current date, configurable trading sessions (with your own reminder header), and an optional higher-timeframe (HTF) bar-close countdown —each with independent positioning, sizing, and auto-contrast.
Designed for focus and discipline: use it to keep risk reminders visible, mark key session windows, and glance the next HTF close without cluttering the chart.
What it shows
Main Watermark (brand/message)
Big title + subtitle, anywhere on the chart, with optional auto color that adapts to light/dark themes.
Market Data Watermark
Per-line display for Ticker, Last Price, and Timeframe (formatted as M5 / H1 / D1 / W1 / MN1, etc.). Each line has its own color, or you can enable a global auto-contrast override.
Date Watermark
Current date in your preferred format (e.g., yyyy-MM-dd, MMM dd, yyyy), with optional auto-contrast.
HTF Countdown (optional)
Minutes (or smart d/h/m) remaining to the next close of selected higher timeframes (5m → Monthly). Can auto-hide lower TFs relative to the current chart timeframe.
Session Watermarks (up to 3)
Three time windows with names, colors, and a timezone selector. Show a prominent header like “Reminder ⚠︎” or “Check Position Size” and only display sessions when they’re currently active.
Quick Start
In Main Watermark, set your Title and optional Subtitle.
In Market Data, choose which lines you want (Ticker/Price/Timeframe) and their position.
In Date Watermark, pick a format and position.
Toggle HTF Countdown on (optional). Choose which TFs to track (e.g., D/W), and whether to Auto-Hide Lower TF.
In Session Watermarks, set your Timezone and edit any of the three sessions (name, time window, color). Only active sessions will render.
Inputs & Controls
Main Watermark
Enable Main Watermark — show/hide.
Position — any of the 9 corners/centers.
Main Title / Subtitle — free text.
Sizes — Tiny / Small / Normal / Large / Huge (independent per line).
Auto-Adjust Colors to Chart — adapts title/subtitle to theme, with extra protection on extremely bright/dark backgrounds.
Manual Colors — choose title/subtitle colors when Auto is off.
Market Data Watermark
Enable Market Data — show/hide.
Position / Text Size — independent of the main watermark.
Show Ticker / Price / Timeframe — toggle each line.
Ticker/Price/Timeframe Colors — per-line colors.
Auto-Adjust All Colors — override individual colors with automatic contrast to chart background.
Timeframe formatting is normalized:
1,3,5,15,30,45 → M1/M3/M5/M15/M30/M45
60,120,180,240 → H1/H2/H3/H4
D or 1D → D1 ; multi-day → D2, D3, …
W or 1W → W1 ; multi-week → W2, …
M or 1M → MN1 ; multi-month → MN2, …
Date Watermark
Enable Date
Position / Text Size
Date Format — yyyy-MM-dd, MM/dd/yyyy, dd/MM/yyyy, MMM dd, yyyy, dd MMM yyyy
Date Color or Auto-Adjust Color
HTF Countdown
Enable HTF Countdown
Position / Text Size
Show Header / Header Text / Header Color
Auto-Hide Lower Timeframes — when ON, only show countdowns above the current chart TF.
Pick TFs — 5m, 15m, 30m, 1h, 4h, D, W, M (toggle any).
Format — Smart (d/h/m) or Minutes Only (m).
Countdown Color or Auto-Adjust Colors (applies to header & lines).
Session Watermarks
Enable Session Watermarks
Position / Text Size
Timezone — select from common regions or Exchange (uses the symbol’s exchange).
Show Header / Header Text / Header Color — e.g., “Reminder ⚠︎”, “Risk Management 🔔”.
Session 1 / 2 / 3
Enable
Name — e.g., “Potential News”, “NY Open”, “Close Positions”
Time — HHMM-HHMM (24-hour) using the selected Timezone
Color
Text Opacity — 0 = fully opaque text, 100 = fully transparent text.
Auto-Adjust Session Colors — auto-contrast against background (applies opacity too).
Sessions only render when the current time is inside their time window.
How it works (under the hood)
Tables on last bar: All watermarks render via table.* only on the last bar for performance (barstate.islast).
Auto-contrast: The script inspects chart.bg_color to detect light/dark and extreme backgrounds, choosing white/black when needed.
Market data: Uses syminfo.ticker, close, and a formatter for timeframe.period.
Date: Formatted with str.format from the current bar’s time.
HTF countdowns:
Pulls time(tf) to anchor the current HTF bar start and computes the minutes until the next close.
Smart mode chooses Xd Yh, Xh Ym, or Xm automatically; Minutes Only shows Xm.
Daily/Weekly/Monthly calculations use current clock values. Weekly assumes the next week starts Monday; monthly uses actual month length for countdown display.
Auto-Hide Lower TFs compares TFs in minutes vs. the current chart TF and hides anything at or below it.
Sessions: input.session windows are evaluated in the selected timezone (or exchange hours if “Exchange” is chosen). A session row appears only while in-session.
Tips & Best Practices
Use Auto-Adjust color options when sharing charts across themes (dark/light).
Keep the Main Watermark subtle (e.g., Normal/Small) and move Market Data to a corner to avoid covering price.
For scalping charts, enable D and W countdowns—great for anticipating session/HTF closes.
Set Session 1 to your news-check window and keep the header on (e.g., “Check Position Size ”).
Limitations / Notes
Countdown logic depends on TradingView’s session/time context; exotic custom sessions may not match exchange close rules.
Weekly countdown assumes week rollover on Monday.
“Monthly” duration comparisons use an approximate 30-day minute value only for thresholding in some helpers; the visible countdown uses the real month length.
No alerts—this is a visual utility.
Performance
Very light; all drawing is table-based and only refreshed on the last bar.
Works on any symbol and timeframe.
Built for the DTT Trading Community ⴵ to promote clarity, patience, and time-based discipline on the chart.

Key levels + Session Range (Sweep-Aware Levels)Overview
This indicator provides a single, clean view of two core intraday contexts that day traders rely on:
Daily Liquidity Levels: prior day high/low (PDH/PDL), prior day open/close, weekly highs/lows, and other commonly referenced reference points.
Session Ranges: clearly plotted high/low for each active session (e.g., Asia, London, New York), tracked live as the session evolves.
By unifying these two information layers, traders can immediately see when price is sweeping a session’s extremes into known daily liquidity—a frequent precursor to reversals or continuation moves. This saves chart space, reduces cognitive overload, and turns two separate checks into one coherent read.
What it does
Plots daily liquidity references: previous day high/low, previous day open/close, and optional higher-timeframe levels (open, high, mid and low 4H ,Day, Week, month, year and quarterly).
Tracks session high/low live: as each session unfolds, the indicator updates that session’s running High and Low, then locks them at session end.
Maps interaction between the two layers: you can instantly spot session sweeps that tag PDH/PDL (or weekly extremes), highlight potential liquidity grabs, and frame risk with objective boundaries.
Keeps the chart clean: just essential lines/zones and concise labels—no extra clutter.
Why it’s useful & original
Single-purpose integration: Rather than a generic mashup, this is a purpose-built fusion where session dynamics are read in the context of daily liquidity. That relationship is the core edge—seeing when a session sweep aligns with known liquidity pools.
Workflow efficiency: One overlay replaces two indicators, simplifying visibility and reducing conflicting visuals.
Decision clarity: The combination highlights setups many intraday traders already watch manually (e.g., NY session high sweep into PDH), but makes them obvious in real time.
How it works (plain-English logic)
Daily Liquidity Engine
At the start of each day, the indicator records PDH, PDL, prior open/close and (optionally) prior week high/low.
These levels are plotted and extended across the session as static references.
Session Range Tracker
For each defined session (e.g., Asia/London/New York), the script initializes session High/Low at session open.
Throughout the session, it updates those extremes in real time and locks them on session close.
Interaction Layer
When price reaches or sweeps a session High/Low near a daily level (e.g., within your chosen tolerance), the confluence becomes visually obvious.
Traders can then decide whether it’s a likely liquidity grab (fade/reversal idea) or a continuation through the pool (breakout idea), per their plan.
How to use it
Identify session context: Start by noting where price is trading relative to the current session’s High/Low.
Locate nearby daily liquidity: Check distance to PDH/PDL, prior open/close, and weekly extremes.
Look for confluence:
Sweep-and-fade idea: Session High swept into PDH (or Session Low into PDL) with failure to hold → potential reversal context.
Break-and-go idea: Strong close through PDH/PDL following a session extreme break → potential continuation context.
Risk framing: Session High/Low and PDH/PDL provide objective anchors for stops and targets. Adapt to your own risk model (e.g., use ATR or structure-based stops).
Keep it clean: Use this as your primary overlay to avoid clutter; add confirmations (volume, structure) only if they genuinely help your process.
Settings (typical options)
Sessions: Choose which sessions to display (e.g., Asia/London/NY) and their time zones/hours.
Daily Levels: Toggle PDH/PDL, prior open/close, prior week High/Low, and other references you rely on.
Visuals: Colors, line styles, label visibility, and optional band shading for quick recognition.
Confluence Tolerance (optional): Define how near a session extreme must be to a daily level to consider it a “liquidity touch/sweep” in your visuals.
Alerts (optional): First touch/sweep of session High/Low, break/close beyond PDH/PDL, or custom distance conditions.
Chart & Publishing Notes (for reviewers and users)
Clean chart by design: Only essential lines/labels for session extremes and daily references.
Plain-English description: Explains what, why, and how so non-coders can use it confidently.
Original integration: The value here is the purposeful interaction—seeing session sweeps in context of daily liquidity in one place—rather than a cosmetic mashup.
Limitations & good practice
This tool is contextual, not predictive. It highlights structure and liquidity landmarks; trade decisions are yours.
Session definitions vary by asset/exchange; ensure your session times match your market.
Past behavior at these levels does not guarantee future outcomes; always use proper risk management.
Disclaimer
This indicator is for educational and informational purposes only and is not financial advice. Trading involves risk; always test and evaluate with your own methods and risk parameters.
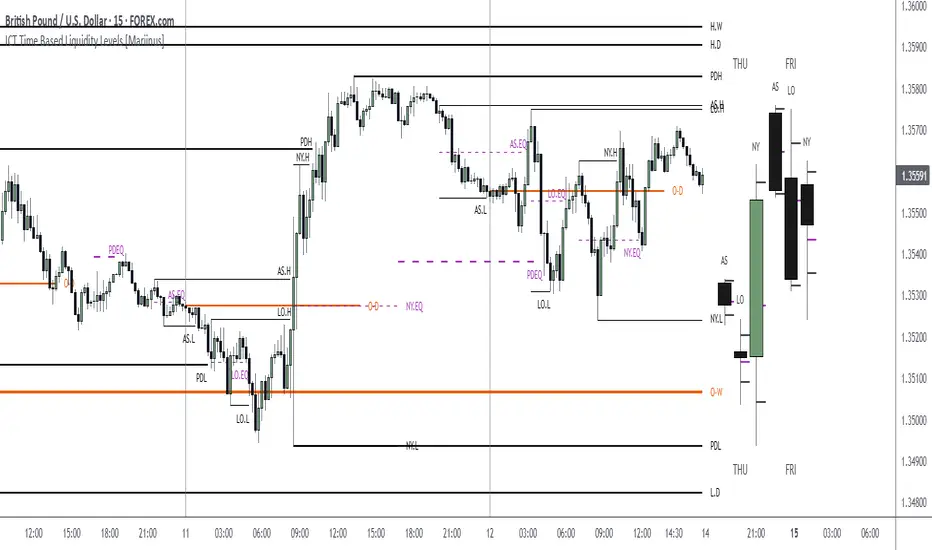
ICT Time Based Liquidity Levels [Mariinus]Indicator Overview – Inspired by ICT Concepts
This indicator helps you spot where liquidity rests and where major price moves are likely to begin or end — giving you clarity for both entries and exits.
Inspired by the teachings of the Inner Circle Trader (ICT), this tool builds on his philosophies and principles that have reshaped how traders view price action. One of the most powerful lessons that stuck with me personally is his quote:
"Time & Price, where it is Time first and then Price”
Another fundamental concept that underpins this tool is the idea that:
"Price is constantly moving in cycles from Premium to Equilibrium, from Equilibrium to Discount from Discount back to Premium."
With these core ideas in mind, this indicator was developed to help traders who are already using an ICT-based framework and focus on Kill Zones and by this on Time Based Liquidity.
In addition to plotting Session Highs and Lows on your chart, the ICT Time Based Liquidity Levels indicator also includes derived levels that provide deeper market insight. These include the Equilibrium of the full Session Range (High to Low) as well as the Equilibrium of the Wicks – offering a more nuanced view of price balance and potential turning points, in line with ICT’s core concepts.
To make sure your chart is not cluttered with lines, you can select which levels to show – and more importantly – you can plot Session Candles next to your Chart. Unlike standard time-based candles (e.g. 4H candles), these are “true” Session Candles that reflect the actual OHLC of trading Sessions, making it easier and clearer to see how Sessions interact with each other.
Next to Intraday Highs and Lows, the indicator will also plot Daily and Weekly Liquidity Pools above and below the Market, giving you insights to where Price is most likely heading towards.
You can set Alerts that trigger whenever one of these key levels is tagged, so you stay focused without staring at the screen all day.
⚠️ Important Disclaimer:
This is not a standalone trading plan.
This is not a buy or sell signal generator.
Instead, this tool is designed to support traders who follow ICT principles by helping them identify higher-probability PD Arrays – the key levels where setups are more likely to occur. If your trading plan includes looking for specific PD Arrays and structural frameworks taught by ICT, then this indicator is a visual aid to refine and focus your attention on the areas where your framework has a higher probability of playing out.
⚙️ Explanation of the Settings
You can combine up to 6 Sessions to monitor their respective levels while operating on a lower timeframe. You can define the timings and a long and short naming of those Sessions.
In the Days Section you can Set a lookback period to control how far back you want to calculate levels. Next to that you can select which Daily and or Weekly Levels you want to have shown on your Charts together with choosing their coloring, style and width.
In the Candles Section you can define how the Session Candles will look like which are plotted next to your Chart. When you have multiple Days of Session Candles it can come in handy to mirror image the Candles which will plot the Candles from right to left instead of the default left to right. In addition you can control how far the distance is between the Candles and your chart, the distance between Candles and Days and the thickness of those Candles. Next you can show or hide the Equilibrium of the total Session Range and the Equilibrium of the Wicks.
In the Lines Section you can specify which Session Levels you want to see on your Chart together with choosing their coloring, style and width.
In the Labels Section you can specify which Labels you want to show and how you want to show them.
In the Openings Section you can specify to show the Midnight Open and or Weekly Open. In addition you can add a divider to be able to distinguish between multiple Days or Weeks.
In the Alert Section you can specify for which Sessions you want to get notified when Key Levels are tagged. After setting this up, you need to set an alert via the Tradingview Alert function to really activate the Alert Function. Be aware that when you change your Alert setup, you need to setup the Tradingview Alert function again.
💡 Example Use Cases
These examples are for educational purposes only. This tool is not financial advice and should always be used in conjunction with your own trading plan—whether it involves Fair Value Gaps, Order Blocks, or a custom combination of ICT-based elements.
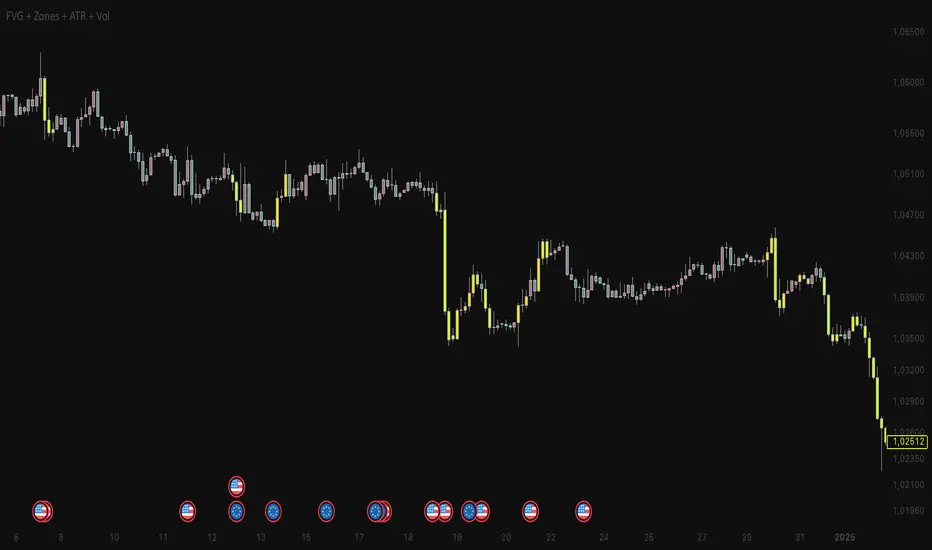
FVG + Zones + ATR + Vol + RangesThis indicator combines Fair Value Gaps (FVGs) with daily, weekly, and monthly ranges, Killzones, ATR & volume filters, and powerful alert conditions.
🔹 Key Features:
• Daily, Weekly & Monthly Ranges
• Automatic plotting of previous highs/lows
• Fully customizable (color, width, line style)
• Optional labels (T-High/T-Low, W-High/W-Low, M-High/M-Low)
• Fair Value Gaps (FVGs)
• Detection of up- and down-FVGs at the start of the 4th candle
• Two modes:
• Raw FVGs → Alerts only (no chart marking)
• Filtered FVGs → Alerts + visual highlights (barcolor)
• Filter conditions: ATR, Volume, and optionally Killzones
• Killzones (active only on < 1H timeframes)
• London (08:00 – 11:00)
• New York AM (14:30 – 17:00)
• New York PM (optional)
• Fully adjustable start/end times + UTC offset (summer/winter time)
• Filters
• ATR filter → qualify FVGs only if volatility is high enough
• Volume filter → qualify FVGs only if volume exceeds SMA
• Alerts
• Filtered FVG alerts (ATR/Vol/Killzones)
• Raw FVG alerts (pure FVG condition, no filtering)
• All alerts trigger exactly at the beginning of the 4th candle
🔹 Use Cases:
• Visualize key market ranges (daily, weekly, monthly)
• Identify and confirm high-probability FVGs within Killzones
• Focus only on quality setups using ATR & Volume filters
• Automate trading workflows with precise FVG alerts
⸻
👉 This tool gives you a complete market overview, combining market structure (ranges) with liquidity concepts (Killzones & FVGs) while enabling efficient trade execution through alerts.
Hodie Smart PD/PW/PM LevelsHodie Smart PD/PW/PM Levels is a professional tool for tracking previous daily, weekly, and monthly highs and lows (PDH/PDL, PWH/PWL, PMH/PML).
It automatically plots levels on the chart and provides unique one-time alerts per period — no more repeated or false signals.
🔧 Features & Settings
1. Levels:
Daily (PDH/PDL)
Weekly (PWH/PWL)
Monthly (PMH/PML)
2. Customization:
Show/hide each level type
Adjustable line thickness and colors
Labels with customizable text and background colors
3. Line Building:
Levels are drawn from the previous period’s high/low and extend until the end of the current period.
🚨 Alert System – Main Advantage
The key strength of this indicator is the smart alert logic:
Each level alert is triggered only once per period (day, week, or month)
No need to recreate alerts every session — the script automatically resets them with each new period
Daily levels use precise "first touch" detection, while weekly/monthly levels fire only once until the next period
✅ This means you can set an alert once and be confident it won’t spam or miss critical touches.
📖 Quick Instruction
1. Add the indicator to your chart
2. In the alerts panel, choose:
Condition: PDH Touch, PDL Touch, PWH Touch, PWL Touch, PMH Touch, or PML Touch
Options: Once per bar (recommended)
Timeframe: any (1-minute interval works best)
3. Alerts will automatically respect the logic:
Daily levels – 1 alert per day
Weekly levels – 1 alert per week
Monthly levels – 1 alert per month
🎯 Why Use This Indicator?
Saves time: set alerts once, no need to update them daily
Eliminates duplicate signals
Clear visualization of key market levels
Works across all markets and timeframes
⚡ Perfect for traders using liquidity concepts, breakout strategies, and Smart Money methods.
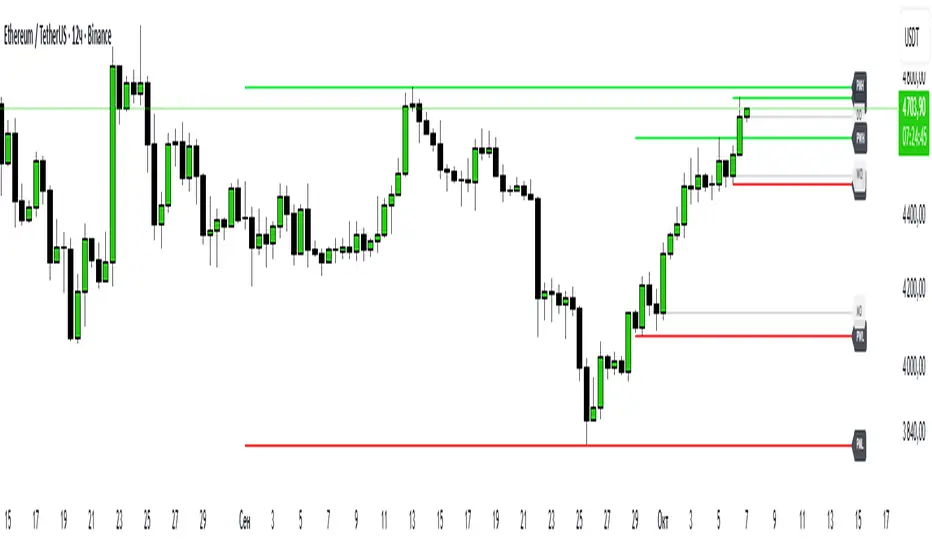
NDOG & NWOG - Liquidity + Sunday Box rroielDescription:
This script combines NDOG & NWOG liquidity levels with a Sunday Box framework to provide traders with structured levels for weekly bias, liquidity mapping, and potential entry/exit zones.
Features:
• Automatic plotting of NDOG & NWOG liquidity zones.
• Sunday Box (weekly open range) drawn to define structure and bias.
• Highlights liquidity sweeps and retests for trade confirmation.
• Configurable settings for box time, liquidity range, and display options.
• Built to support ROI/EL strategies by aligning liquidity with weekly key levels.
Use Case:
Helps traders identify where price is likely to react by combining liquidity-based zones with the Sunday box framework. Designed for clarity, confluence, and efficiency in execution.

Futures Key LevelsKey Levels — Sessions, Previous Ranges & Opens (Chicago-aligned sessions)
What it does
This indicator plots commonly used reference levels across multiple timeframes to help you frame the day and find confluence:
Sessions (Chicago TZ): London, New York, and Asia session high/low ranges.
Previous Period Ranges: Previous Day / Week / Month / Quarter / Year High/Low and optional Mid.
Opens: Current Daily / Weekly / Monthly / Quarterly / Yearly opens.
Intraday (4H): Previous 4-Hour High/Low + optional Mid.
Monday Range: Captures Monday’s High/Low (and optional Mid) to use as a weekly reference.
Price-scale markers: Optional markers that track key levels on the price scale without adding extra lines.
How it works (concepts & calculations)
Higher-timeframe values are retrieved using request.security() and update when a new period begins (e.g., previous day’s H/L become fixed at the start of the new day).
Session ranges are built from bar data within session windows using time(session, "America/Chicago"):
London: 02:00–05:00 CT
New York: 08:30–15:00 CT
Asia: 20:00–00:00 CT
“Mid” levels are simple midpoints between each period’s High and Low.
Merge Levels: when different levels land at the same price, their labels are merged to reduce clutter (e.g., “PDH / PWH”).
Why this version is useful / original bits
All-white baseline for clean charts; session colors stand out by design: London = Yellow, New York = Aquatic Blue, Asia = Red.
Right-anchored mode lets you park levels to the right side of the chart with a configurable anchor distance.
Label merging keeps the display minimal when multiple levels coincide.
Price-scale-only markers available when you prefer fewer lines on the chart.
Inputs & customization
Display Style: Standard or Right Anchored (+ distance controls).
Levels toggles: enable/disable each period (Daily/Weekly/Monthly/Quarterly/Yearly), Monday range, 4H range, and session ranges.
Text: optional shorthand labels (e.g., PDH/PDL, PWH/PWL).
Colors: global white theme, with session highlights; you can override in the Inputs.
Price-scale markers: on/off toggle.
How to use it
Use previous High/Low as liquidity pools and areas to watch for sweeps, breaks, or retests.
The Monday range often frames the rest of the week; breaks or rejections around Monday H/L can be informative.
The 4H previous range gives intraday context—great for mean-reversion vs. continuation reads.
Session ranges help you see where the active session expanded price and where liquidity may remain.
Notes & limitations
Sessions are computed in America/Chicago; higher-TF levels use the symbol’s exchange timezone.
This is an indicator, not a strategy; it does not place trades or claim performance.
Always combine levels with your own execution rules (structure, momentum, risk).
Credit: inspired by spacemanBTC; this version adds the all-white styling, Chicago-aligned sessions, right-anchoring, label merging, and price-scale markers.
Also my mentor to tell me about the levels
Disclaimer
This tool is for educational purposes only and is not financial advice. Markets involve risk; do your own research and manage risk appropriately.

Keylevels [KAWS]Overview
The Keylevels Indicator is designed to provide traders with a clear and structured view of important market reference points. It automatically detects and plots session highs and lows, weekly and monthly levels, as well as the previous day’s range. These levels are presented directly on the chart as dynamic lines with optional text labels, offering a consistent framework for understanding price action across multiple time horizons.
Understanding the Concepts
What are Key Levels?
Key levels are significant price points that often serve as reference markers in market activity. They represent areas where the market has previously established boundaries (highs and lows) within sessions, days, weeks, or months. Such levels can highlight where price has repeatedly reacted, providing insight into areas of potential importance.
Why Sessions Matter
Financial markets operate globally, and trading sessions (Asia, London, New York) reflect the activity of different regions. Each session produces distinct highs and lows that can serve as key markers for subsequent price behavior. By capturing these levels automatically, the indicator helps visualize how markets transition from one trading phase to another.
Higher Timeframe Levels
Weekly and monthly highs and lows, as well as the previous day’s range, provide broader structural reference points. These levels are often used to assess whether the market is respecting or breaking significant boundaries over time.
How the Indicator Works
The indicator automatically tracks and plots:
Session Levels: Highs and lows of the Asia, London, and New York sessions.
Session Open Price: A clear reference line marking the opening price of a chosen session.
Daily Levels: Previous day’s high and low, updated at the start of each new day.
Weekly Levels: High and low of the current week, with automatic reset each new week.
Monthly Levels: High and low of the current month, updated dynamically.
Each level is displayed with customizable line styles, colors, and labels. Labels can include text only or also display the exact price, depending on user preference. The indicator further supports the option to extend lines into the future, allowing for ongoing visibility of these reference points.
Customization Options
Display Control: Enable or disable specific sessions, daily, weekly, or monthly levels.
Visual Styling: Adjust line colors, thickness, and style (solid, dashed, dotted).
Labels: Choose whether to display text, include price information, and set text size.
Session Settings: Define your preferred timezone and session open times for accuracy across global markets.
Line Extension: Decide whether levels should extend into the future or stop when broken.
Important Considerations
This indicator is a technical reference tool. It does not generate buy or sell signals but instead provides structural context by highlighting where the market has established significant levels. As with any technical tool, it is most effective when integrated into a broader trading framework that includes market structure, trend analysis, and risk management.

TF ZONES VIPTF Zones is a session and higher-timeframe reference tool for intraday and swing traders (ICT / SMC concepts).
🔹 Features
Killzones (Sessions):
Automatically draws Asia, London, New York AM, New York Lunch, and New York PM ranges.
• Customizable box colors, transparency, and labels
• High/Low pivot lines with optional midpoints
• Alerts when pivots are broken
Day / Week / Month Levels:
• Daily / Weekly / Monthly Opens
• Daily / Weekly / Monthly Highs & Lows
• Alerts on High/Low breaks
Day-of-Week Zones:
Color-coded boxes for each weekday (Mon–Sun) to track daily ranges.
Previous Year High/Low:
Plots prior year’s H/L with labels (PY.H / PY.L).
🔧 Customization
Session drawing limits (max days stored)
Timezone selection (GMT offsets or New York)
Label size, text color, and line style
Box transparency and text display options
Optional alerts on key level breaks
📌 Use Case
Perfect for traders who want to:
Track session ranges (ICT Killzones)
Visualize intraday structure clearly
Use Daily / Weekly / Monthly opens and ranges as confluence
Monitor higher-timeframe and yearly reference levels

TF ZonesTF Zones is a session and higher-timeframe reference tool for intraday and swing traders (ICT / SMC concepts).
🔹 Features
Killzones (Sessions):
Automatically draws Asia, London, New York AM, New York Lunch, and New York PM ranges.
• Customizable box colors, transparency, and labels
• High/Low pivot lines with optional midpoints
• Alerts when pivots are broken
Day / Week / Month Levels:
• Daily / Weekly / Monthly Opens
• Daily / Weekly / Monthly Highs & Lows
• Alerts on High/Low breaks
Day-of-Week Zones:
Color-coded boxes for each weekday (Mon–Sun) to track daily ranges.
Previous Year High/Low:
Plots prior year’s H/L with labels (PY.H / PY.L).
🔧 Customization
Session drawing limits (max days stored)
Timezone selection (GMT offsets or New York)
Label size, text color, and line style
Box transparency and text display options
Optional alerts on key level breaks
📌 Use Case
Perfect for traders who want to:
Track session ranges (ICT Killzones)
Visualize intraday structure clearly
Use Daily / Weekly / Monthly opens and ranges as confluence
Monitor higher-timeframe and yearly reference levels

Pivot ConnectPivot Connect –
a condensed and educational version
Objective
Automatically draws extended horizontal lines at the pivots (relevant highs and lows) of three timeframes:
The current chart (1 min, 5 min, 1 h… whatever you're looking at)
Weekly (W)
4-hour (240 min)
These lines are considered "protected levels": resistances (highs) or supports (lows).
The script also detects when the price breaks only the wick break to change the color/style of the line and warn that the level may have become invalid.
What is a pivot here?
ta.pivothigh / ta.pivotlow calculate a local high/low that has at least n bars on either side.
The pivotStrength parameter (default 12) is that n.
Therefore, a pivot high requires 12 candles to the left and 12 to the right lower than itself.
Lines drawn:
Highs and lows of the current timeframe (red and green)
Weekly highs and lows (blue and orange) if useWeekly = true
4-hour highs and lows (fuchsia and aqua) if use4H = true
Each line extends to the right by "extendLines" bars (default 100).
Wick break
This is reviewed bar by bar:
For a High level: if the high breaks above the line but the close remains below → it is considered a false break (wick break) and the line changes to purple and dashed style.
For a Low level: if the low breaks above the line but the close remains above → same warning.
The wickBreakBars (5) parameter is not used in the current logic; it was probably intended for future validation.
Cleaning Old Lines
Every 100 bars, lines with a right end older than 500 bars are removed to avoid memory overload (max_lines_count = 500).
Quick Customization
Colors and styles for each category.
Show or hide each line group (showHighs, showLows, useWeekly, use4H).
Thickness, solid/dash/dotted style.
Example of on-screen reading
Horizontal red line: resistance of the timeframe itself.
Horizontal blue line: important weekly high.
If a line changes to dashed purple: the price pierced it with the wick but did not close above it (at highs) – possible rejection.
This gives you a visual map of multi-timeframe support and resistance levels with quick alerts for "suspicious" breakouts.
Persistence# Persistence
## What it does
Measures **price change persistence**, defined as the percentage of bars within a lookback window that closed higher than the prior close. A high value means the instrument has been closing up frequently, which can indicate durable momentum. This mirrors Stockbee’s idea: *select stocks with high price change persistence*, and then combine **momentum plus persistence**.
## Can be used for scanning in PineScreener
## Calculation
* `isUp` is true when `close > close `.
* `countUp` counts true instances over the last `len` bars.
* `pctUp = 100 * countUp / len`, bounded between 0 and 100.
* A 50% level is a natural baseline. Above 50% suggests more up closes than down closes in the window.
## Inputs
* **Lookback bars (`len`)**: default 252 for roughly one trading year on a daily chart. On weekly charts use something like 52, on monthly charts use 12.
## How to use
1. **Screen for persistence**
Sort a watchlist by the plotted value, higher is better. Many momentum traders start looking above 58 to 65 percent, then layer a trend filter.
2. **Combine with momentum**
Examples, pick tickers with:
* `pctUp > 60`, and price above a rising EMA50 or EMA100.
* `pctUp rising` and weekly ROC positive.
3. **Switch timeframe to change the horizon**
* Daily chart with `len = 252` approximates one year.
* Weekly chart with `len = 52` approximates one year.
* Monthly chart with `len = 12` approximates one year.
## TC2000 equivalence
Stockbee’s TC2000 expression:
```
CountTrue(c > c1, 252)
```
## Interpretation guide
* **70 to 90**: very strong persistence; often trend leaders, check for extensions and risk controls.
* **60 to 70**: constructive persistence; good hunting ground for swing setups that also pass momentum filters.
* **50**: neutral baseline; around random up vs down frequency.
* **Below 50**: persistent weakness; consider only for mean reversion or short strategies.
## Practical tips
* **Event effects**: ex-dividend gaps can reduce persistence on high yield names. Earnings gaps can swing the value sharply.
* **Survivorship bias**: when backtesting on curated lists, persistence can look cleaner than in live scans.
* **Liquidity**: thin names may show noisy persistence due to erratic prints.
## Reference to Stockbee
* “One way to select stocks for swing trading is to find those with high price change persistence.”
* “Persistence can be calculated on a daily, monthly, or weekly timeframe.”
* TC2000 function: `CountTrue(c > c1, 252)`
* Example noted in the tweet: CVNA had very high one-year price persistence at the time of that post.
* Takeaway: **look for momentum plus persistence**, not persistence alone.

Fibonacci Sequence Circles [BigBeluga]🔵 Overview
The Fibonacci Sequence Circles is a unique and visually intuitive indicator designed for the TradingView platform. It combines the principles of the Fibonacci sequence with geometric circles to help traders identify potential support and resistance levels, as well as price expansion zones. The indicator dynamically anchors to key price points, such as pivot highs, pivot lows, or timeframe changes (daily, weekly, monthly), and generates Fibonacci-based circles around these anchor points.
⚠️For proper indicators visualization use simple not logarithmic chart
🔵 Key Features
Customizable Anchor Points : The indicator can be anchored to Pivot Highs , Pivot Lows , or timeframe changes ( Daily, Weekly, Monthly ), making it adaptable to various trading strategies.
Fibonacci Sequence Logic : The circles are generated using the Fibonacci sequence, where the diameter of each circle is the sum of the diameters of the two preceding circles.
first = start_val
secon = start_val + int(start_val/2)
three = first + secon
four = secon + three
five = three + four
six = four + five
seven = five + six
eight = six + seven
nine = seven + eight
ten = eight + nine
Adjustable Start Value : Traders can modify the starting value of the sequence to scale the circles larger or smaller, ensuring they fit the current price action.
Color Customization : Each circle can be individually enabled or disabled, and its color can be customized for better visual clarity.
Visual Labels : The diameter of each circle (in bars) is displayed next to the circle, providing additional context for analysis.
🔵 Usage
Step 1: Set the Anchor Point - Choose the anchor type ( Pivot High, Pivot Low, Daily, Weekly, Monthly ) to define the center of the Fibonacci circles.
Step 2: Adjust the Start Value - Modify the starting value of the Fibonacci sequence to scale the circles according to the price action.
Step 3: Customize Circle Colors - Enable or disable specific circles and adjust their colors for better visualization.
Step 4: Analyze Price Action - Use the circles to identify potential support/resistance levels, price expansion zones, or trend continuation areas.
Step 5: Combine with Other Tools - Enhance your analysis by combining the indicator with other technical tools like trendlines, moving averages, or volume indicators.
The Fibonacci Sequence Circles is a powerful and flexible tool for traders who rely on Fibonacci principles and geometric patterns. Its ability to anchor to key price points and dynamically scale based on market conditions makes it suitable for various trading styles and timeframes. Whether you're a day trader or a long-term investor, this indicator can help you visualize and anticipate price movements with greater precision.

UniqueHorn - MA Indicator with SMI📊 Overview
The UniqueHorn MA-SMI Indicator is a comprehensive trading tool that combines multiple Moving Averages with the Stochastic Momentum Index (SMI) in a clean, organized display. Designed for traders who need clear visual analysis of trend, momentum, and potential reversal points.
✨ Key Features
Moving Averages (8 Total)
3 EMAs: 5, 10, 20 (for quick trend detection)
5 SMAs: 30, 40, 50, 65, 200 (for medium to long-term trends)
Smart Timeframe Adaptation
Daily & Lower: EMA 5, 10, 20 | SMA 50, 65, 200
Weekly Chart: EMA 10, 20 | SMA 30, 40, 50, 200
Automatic display optimization based on timeframe
SMI Integration (Stochastic Momentum Index)
Visual signals directly on main chart
Overbought/Oversold markers
Bullish/Bearish crossover signals
Optional background coloring for extreme zones
Current SMI value as label
Climax Detection
Buying Climax: New 52-week high with red candle (weakness signal)
Selling Climax: New 52-week low with green candle (strength signal)
Works optimally on weekly charts
📈 Usage & Strategies
Trend Following
Use MAs as dynamic support/resistance
EMA crossovers for entry/exit signals
SMA 200 as primary trend filter
Momentum Trading
SMI < -40: Oversold zone → Potential long opportunity
SMI > 40: Overbought zone → Potential short opportunity
SMI crossovers as early trend reversal signals
Climax Trading
Buying Climax: Warning of potential top formation
Selling Climax: Indication of potential bottom formation
⚙️ Customization Options
Individual color selection for each MA
Separate line widths for EMA 5, 10, and other MAs
Show/Hide individual components
Fully adjustable SMI parameters
Optional info table with status overview
Comprehensive alert system for all signals
🎯 Ideal For
Swing Traders: Use the combination of MAs and SMI for optimal entries/exits
Position Traders: Focus on longer-term MAs and weekly chart signals
Day Traders: Fast EMAs with SMI momentum for short-term setups
📝 Notes
Climax signals work exclusively on weekly charts
SMI signals are available in all timeframes
Timeframe-specific MA display reduces visual clutter
Combine multiple signals for higher probability trades
🔔 Alert Functions
The indicator provides alerts for:
Buying/Selling Climaxes
SMI Overbought/Oversold zones
SMI Bullish/Bearish crossovers
EMA crossovers
Price-SMA200 crossovers
Version: 1.0
Pine Script: v6
Author: UniqueHorn
This indicator is the result of careful development and optimization for professional trading. For questions or suggestions, please use the comments section.
Androlog DailyWeeklyMonthlyAndrologLevel — Daily / Weekly / Monthly Levels
This indicator visualizes the Daily, Weekly, and Monthly key levels introduced by Daniel. It’s intentionally minimal and fast, focused on clean higher‑timeframe references for intraday and daily trading.
What it shows:
Daily open and prior‑day high/low
Weekly and Monthly “open”-based levels
Optional labels for quick price readouts
Controls
Show only new levels or keep/extend old ones
Choose whether levels extend to the right
Alerts
Optional alert conditions for level touches (per your settings)
Uses confirmed higher‑timeframe bars; no historical repaint
Inicio de Semana (línea vertical completa)This indicator plots a vertical line at the start of each new trading week. The line extends across the entire chart window, making it easy to visually identify weekly boundaries.
Key features:
Full-height vertical lines marking the beginning of every week.
Customizable color, width, and style (solid, dotted, or dashed).
Works on any timeframe (daily, intraday, etc.), automatically adjusting to weekly changes.
Purpose:
This tool is designed to help traders quickly spot the start of a new trading week, improving time-based analysis and making it easier to evaluate price action, weekly cycles, and strategy performance.
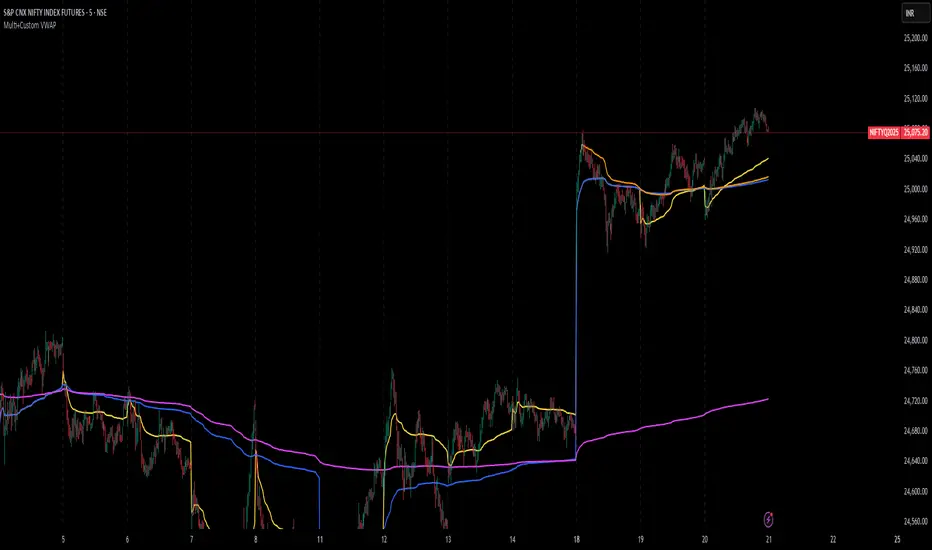
Multi+Custom VWAPMulti-VWAP (Session, Weekly, Monthly, Custom)
Description:
This script plots multiple VWAP (Volume Weighted Average Price) levels on the chart, giving traders a broader perspective of price action across different time horizons.
Features:
Session VWAP → Resets at the start of each trading session.
Weekly VWAP → Resets every Monday.
Monthly VWAP → Resets at the start of each new month.
Custom VWAP → User can specify a custom start date and time, and the script will calculate VWAP from that moment until the current bar.
Use Cases:
Compare intraday (session) VWAP with higher-timeframe VWAPs (weekly & monthly) to spot confluence levels.
Track how price interacts with institutional benchmarks.
Use custom VWAP to anchor from specific events (earnings, news releases, breakouts, etc.).
Notes:
Works on any timeframe and instrument that has volume data.
Designed to be clean and minimal with adjustable colors and line styles.
Useful for day traders, swing traders, and long-term investors who monitor VWAP across multiple time horizons.