Ichimoku DoubleTF overlay
Hello guys, this code allow to overlay a second ichimoku over the first one loaded on the used time-frame.
It's simple.
Choose your preferred Time-frame.
Set the Time-frame for the second Ichimoku in the settings menu .
Now you can see two Ichimoku clouds based on two different time-frame.
It can be very usefull and more ordered of a multi-windows layout.
On second Ichimoku the Chikou-span is omitted 'cause i think that is useless and cumbersome.
To help to reading the graph i set two labels to identify the "2nds" tenkan and kijun.
Tell me if this script was useful and remember to follow me and adding a like.
Available combinations:
DAILY: WEEKLY AND MONTLY
4H: WEEKLY, DAILY
1H: WEEKLY, DAILY, 4H
30m: DAILY, 4H, 1H
15m: DAILY, 4H, 1H, 30m
5m: DAILY, 4H, 1H, 30m, 15m
3m: 1H, 30m, 15m
1m: 1H, 30m, 15m,5m,3min
Thanks, bhutano
*****************************************************************************************************
Ciao ragazzi, questo codice permette di sovrapporre un secondo Ichimoku a quello del time-frame utilizzato.
Scegliete il vostro time-frame preferito.
Impostate il time-frame del secondo Ichimoku dalle impostazioni dello script .
Adesso vedrete due Nuvole Ichimoku basati su due time-frame diversi.
Può essere davvero utile e più ordinato di un layout multi-window.
Sul secondo Ichimoku la Chickou è stata omessa perchè penso che sia inutile e ingombrante.
Per aiutare la lettura del grafico ho impostato due etichette per identificare le seconde tenkan e kijun.
Ditemi se questo script vi è stato utile e ricordatevi di seguirmi e aggiungere un mi piace.
Combinazioni possibili:
DAILY: WEEKLY AND MONTLY
4H: WEEKLY, DAILY
1H: WEEKLY, DAILY, 4H
30m: DAILY, 4H, 1H
15m: DAILY, 4H, 1H, 30m
5m: DAILY, 4H, 1H, 30m, 15m
3m: 1H, 30m, 15m
1m: 1H, 30m, 15m,5m,3min
Grazie, bhutano
Cerca negli script per "weekly"

Volumeweighted macd leader with bb squeezethis indicator is very useful for stocks or crytpto especialy 3d and weekly charts
daily shows good too but if u re a daily trader use it if not dont use it coz 4h and daily is noisy some when there is no trend
thats why weekly and 3d is good because it ll give u accurate signal and trend reversals
this is not my script just a combination of lazybear squeeze momentum, macdleader and volume weighted macd of kivanc
i merge them so it also shows bb squeeze on zero line and settings name is median
macd leader is 2 differen color above zero line and below zero line
above zero line if macd leader is green its buy signal and trend is up
if blue it meand no trend or trend reversal so sell or wait if u use 4h or daily but 3d and weekly it means sell
below zero line macd leader color is red and means that there is downtrend and do not buy
when 3d or weekly turns blue on macd leader it means trend reversal about the start
good with heiken ashi candles
DO NOT FORGET THIS IS NOT PERFECT INDICATOR FOR SHORT TERM, PREFER IT 3D AND WEEKLY FR BETTER RESULTS

Stepped Multi Timeframe MAs with PDH PDL TDH TDL Dynamic Labels
Plots stepped (blocky) higher‑timeframe moving averages and VWAP on the current chart (HMA/EMA/VWMA/SMA/VWAP toggles).
Automatically switches MA source to the chart’s timeframe on Daily/Weekly/Monthly (e.g., Weekly chart shows weekly MAs), while intraday charts can use a user-selected higher timeframe.
Draws Previous Day High/Low (PDH/PDL) anchored from the exact candle that formed the level, then extends the line across the chart up to the latest bar.
Draws Today’s High/Low (TDH/TDL) the same way, and updates dynamically as new intraday highs/lows are made (the anchor shifts to the new wick candle).
Keeps labels readable by placing them above/below each line with no background and a clean grey style, and repositions label X based on the visible chart window (so labels stay at a consistent % from the right edge while you pan/zoom)

DeltaPulseDeltaPulse: Professional Cumulative Volume Delta Indicator
DeltaPulse is a free cumulative volume delta (CVD) indicator engineered for modern traders who demand precision, adaptability, and visual clarity. Unlike traditional CVD tools that often suffer from scaling issues, excessive noise, or poor responsiveness across timeframes, DeltaPulse delivers a streamlined, professional-grade solution that "just works" – providing actionable insights into buying and selling pressure with minimal setup.
This indicator accumulates the net difference between buying and selling volume (inferred from candle direction), normalizes it intelligently for consistent readability, and applies advanced smoothing to filter out market noise while preserving momentum signals. The result is a clean, momentum-colored line in a dedicated pane, enhanced by subtle visual cues that highlight key market dynamics.
Whether you're a day trader scalping intraday moves, a swing trader analyzing weekly trends, or an institutional analyst reviewing futures contracts, DeltaPulse adapts seamlessly to your workflow. It's designed to be your go-to tool for confirming trends, spotting divergences, and identifying order flow imbalances – all without the bloat of overcomplicated features.
Key Features
Intelligent Normalization for Universal Compatibility
Automatically adjusts scaling based on chart timeframe and symbol volume profile.
Intraday (1-5 min): Uses a 100-period volume average for responsive, lively signals.
Intraday (15+ min): 50-period average for balanced sensitivity.
Daily/Weekly+: 20-period average for clean, long-term perspective.
Ensures the indicator remains visually meaningful and non-flat on any asset – from low-volume penny stocks to high-liquidity indices like ES or NQ.
Advanced Smoothing Options
Six moving averages to match your trading style:
EMA - Quick reactions to recent delta shifts
SMA - Simple Moving Average - Stable, noise-resistant baseline
WMA - Weighted Moving Average - Emphasizes recent data with linear weighting
HMA - Hull Moving Average - Ultra-smooth yet lag-free – ideal for momentum trading
RMA - Running Moving Average (Wilder's) - Trend-following with minimal whipsaws
VWMA - Volume-Weighted Moving Average - Highlights high-volume delta moves
Lower values increase reactivity; higher values enhance smoothness.
Flexible Reset Mechanisms
Session Reset: Clears CVD at the first regular trading bar each day – perfect for intraday analysis.
Weekly Reset: Resets at the start of each new week – suited for swing and position trading.
No manual intervention required; the indicator handles resets reliably across all timeframes.
Background Shading:
Light green tint above zero; light red below.
Extreme highlights when smoothed CVD exceeds 90% of its 80-bar high/low – flags potential exhaustion or absorption zones.
How It Works
DeltaPulse calculates a simple yet effective volume delta on each bar:
Bullish Bar (close ≥ open): Adds full volume as positive delta.
Bearish Bar (close < open): Subtracts full volume as negative delta.
This raw delta accumulates into a running total (CVD), resetting based on your chosen mode. The total is then:
Normalized against a timeframe-adaptive volume average to ensure consistent scaling.
Smoothed using your selected MA type for noise reduction and trend clarity.
Plotted with momentum-based coloring and visual enhancements.
The output is a single, intuitive line that reveals the underlying battle between buyers and sellers – far more reliably than raw volume bars or basic oscillators.
Trading Applications
DeltaPulse shines in revealing order flow dynamics that price action alone often conceals. Here are proven ways to integrate it:
Trend Confirmation & Momentum Trading
Bullish Setup: Rising green line above zero confirms buyer control – enter longs on pullbacks to support.
Bearish Setup: Falling red line below zero signals seller dominance – short on rallies to resistance.
Zero Line Crosses as Reversal Signals
A crossover from negative to positive territory often marks a sentiment shift – use for entry triggers.
Combine with volume spikes or key levels for high-probability setups.
Enhancement: VWMA mode amplifies signals on high-volume breakouts.
Absorption & Exhaustion Zones
Watch for extreme background highlights: A spike to highs followed by reversal suggests large players absorbing supply.
Ideal for fade trades near overextended levels (e.g., after news events).
Avoid low-volume or illiquid symbols, as delta inference relies on reliable candle data.
Timeframe-Agnostic: Solves the common CVD pitfall of being "dead" on intraday charts or erratic on daily ones through smart, automatic normalization.
Lag-Free Responsiveness: The default HMA smoothing strikes a rare balance – smoother than EMA, faster than SMA – without the computational overhead of exotic filters.
Zero Clutter: No histograms, no extraneous plots, no overwhelming alerts. Just pure, distilled order flow intelligence.

VWAP Flow ParmezanThe "Official Bank Flow VWAP" is a comprehensive trading suite designed for institutional Forex traders.
This indicator solves the problem of chart clutter by combining two critical components of liquidity: Price (Value) and Time (Sessions). It is specifically optimized for EUR/USD and GBP/USD on intraday timeframes (M5, M15), helping you identify high-probability setups where "Fair Value" meets "Volatility."
Key Features
1. Multi-Timeframe VWAP Hierarchy Unlike standard indicators, this tool visualizes the interaction between three distinct timeframes:
Daily VWAP (Dynamic Color): Your primary trend filter. Green when Bullish (Price > VWAP), Red when Bearish (Price < VWAP).
Weekly VWAP (Orange Dots): Represents the medium-term balance. Acts as a magnet for mean reversion mid-week.
Monthly VWAP (Purple Line): The institutional "line in the sand." Major support/resistance level.
2. Standard Deviation Bands (Market Balance) The indicator plots SD1 and SD2 bands around the Daily VWAP:
Inner Zone (SD1): Represents the "Fair Value" area.
Outer Bands (SD2): Represents overbought/oversold conditions. Useful for identifying mean reversion plays back to the center.
3. Official Exchange Sessions (Time) Forget confusing "killzones." This tool highlights the Official Open times for major exchanges, adjusted for Daylight Savings via New York time:
London Open (08:00 LDN): The start of European volume.
New York Open (08:00 NY): The injection of US liquidity.
London Close/Fix: The daily overlap close, often marking trend reversals.
Note: Sessions are visualized with non-intrusive black "shadow" backgrounds to keep your chart clean.
4. "Ghost" Levels (Previous VWAP) A unique feature that plots the closing VWAP level of the previous day. Institutional algorithms often target these "untested" levels as Take Profit targets or liquidity pools.
How to Use
Trend Following: If Price is above the Daily VWAP (Green) during the London Open, look for Long entries targeting the SD1/SD2 upper bands.
Mean Reversion: If Price hits the SD2 Band while far away from the Weekly VWAP, look for a reversal back to the mean.
Confluence: The strongest signals occur when price touches a key VWAP level (e.g., Weekly VWAP) specifically during the highlighted Session Start times.
Settings
Timezone: Defaults to America/New_York to automatically handle DST shifts for London/NY opens.
Visuals: Fully customizable colors and transparency. Default is set to a "Dark Mode" friendly professional palette.

Worstfx Key Time Windows + 5 Day Journal🕒 Key Time Windows — Features & Purpose
✔️ Includes 6 Major Time Windows:
• 7:45 PM (Asia Open Overview)
• 12:00 AM (Daily Reset Liquidity Shift)
• 2:00 AM (London Accumulation / Manipulation)
• 7:00 AM (Pre-NY / Expansion Setup)
• 10:00 AM (NY Reversal Window)
• 2:00 PM (NY Power Move / Final Push) ← added
These windows are not random — they are the exact points in the day where:
• Liquidity resets
• Volatility compresses or expands
• Session trends form or reverse
• Market makers reposition
• High-probability setups appear
The panel shows:
➤ INSIDE
You are currently in the window.
Expect movement, structure breaks, or trap/reversal behavior.
➤ NEAR
Approaching a key window.
Prepare, observe order flow, plan entries.
➤ FAR
Out of the actionable range.
Ideal for reducing screen time and avoiding emotional trades.
➤ IDLE
The window passed.
High-probability moment is over — walk away or wait for the next one.
⚡ Why this matters
Most blown accounts come from trading outside high-probability times.
Your edge comes from timing, not randomness.
This panel keeps your brain aligned with the correct moments — not boredom, FOMO, or impulse.
📊 5-Day Performance Journal — Features
✔️ Enter daily P/L manually
• Monday → Friday
• Accepts positive or negative values
• Example: +2500, -300, 0
✔️ Auto-Calculated Weekly Total
• Shown right next to Friday
• Colored based on profit or loss
• Light highlight tint to stand out without distractions
✔️ Two Clean Layouts
• Vertical → For corner placement
• Horizontal → For header-like week summaries
✔️ Psychology Through Design
• Green = rewarded discipline
• Red = consequence of breaking plan
• White-dim = zero day → neutral, no shame, no heat
The goal is not the number —
It’s accountability, awareness, and emotional grounding.
🧠Consistency Over Drama
The weekly total next to Friday forces your brain to think in weeks, not minutes.
Bad day?
You stop early to protect weekly total.
Good day?
You don’t overtrade because the number is already green.
This shifts your psychology from:
“I need to win right now.”
to:
“I need to preserve my weekly edge.
🔋To unlock the full power of the framework, run this together with Worstfx Fractal Sessions🔋

Majors FX-REER/NEER Suite [BIG]═══════════════════════════════════════════════════════════════════════════════
BIG MAJORS FX-REER/NEER SUITE
═══════════════════════════════════════════════════════════════════════════════
OVERVIEW
The BIG Majors FX-REER/NEER Suite is a multi-currency valuation framework designed for institutional FX traders, macro strategists, and systematic currency allocators. This indicator calculates Real Effective Exchange Rates (REER) and Nominal Effective Exchange Rates (NEER) for the seven major currency pairs (G7 FX), integrating macroeconomic fundamentals (CPI inflation differentials) with technical trend analysis to identify structural currency misvaluations and mean-reversion opportunities.
Unlike standard FX indicators that only analyze bilateral price action, this suite constructs trade-weighted basket indices that measure each currency's strength against a portfolio of its major trading partners, adjusted for inflation differentials. This approach mirrors central bank and sovereign wealth fund methodologies for assessing equilibrium exchange rate levels.
The framework combines:
- Fundamental valuation metrics – REER/NEER indices with Z-score normalization
- Technical trend filters – Ichimoku Cloud and Aroon oscillator confluence
- Signal classification system – Long/Short/Watch/Conflict regime identification
- Quantitative confidence scoring – 0-100% signal reliability weighting
═══════════════════════════════════════════════════════════════════════════════
CORE METHODOLOGY
═══════════════════════════════════════════════════════════════════════════════
• NEER Calculation (Nominal Effective Exchange Rate)
The NEER measures a currency's value against a trade-weighted basket of its seven major trading partners, geometrically averaged in log-space to ensure symmetry:
1. All seven G7 FX pairs are normalized to USD-pivot (A/USD format)
2. Each currency's log-normalized rate is compared to the arithmetic mean of the other six
3. Formula: NEER_i = (8/7) × log(CCY_i/USD) - mean(log(CCY_others/USD))
This construction ensures that:
- A rising NEER indicates currency appreciation against the basket
- The methodology is symmetric and avoids base-currency bias
- Changes reflect multilateral competitive dynamics, not just bilateral moves
• REER Calculation (Real Effective Exchange Rate)
The REER adjusts the NEER for inflation differentials using Consumer Price Index (CPI) data:
Formula: REER_i = NEER_i + log(CPI_i) - mean(log(CPI_others))
By incorporating CPI differentials, the REER provides a purchasing-power-parity-adjusted valuation metric that accounts for relative inflation rates. This is the institutional standard for assessing fundamental currency equilibrium levels.
Data Sources :
- FX rates: TradingView composite feed (FX:), OANDA, FXCM, FOREXCOM
- CPI data: ECONOMICS namespace (monthly frequency, official statistical releases)
- Supported currencies: USD, EUR, JPY, GBP, CHF, AUD, CAD, NZD
• Valuation Bias Detection
Each currency pair is classified as overvalued (bias = -1, "Short") or undervalued (bias = +1, "Long") based on two independent criteria:
1. Percentage Band Deviation – Relative Index distance from 100 baseline
• Overvalued: Index > 100 × (1 + deviation%), default +5%
• Undervalued: Index < 100 × (1 - deviation%), default -5%
2. Z-Score Threshold – Statistical extremes in rolling lookback window
• Overvalued: Z-Score > +1.5 (default)
• Undervalued: Z-Score < -1.5 (default)
Either condition triggers a bias classification. This dual-filter approach captures both absolute deviations and relative extremes within recent historical context.
• Trend Confirmation (Ichimoku + Aroon)
To avoid counter-trend entries in strong momentum regimes, the suite integrates two independent trend filters:
Ichimoku Cloud
- Bull: Price > Cloud AND Conversion > Base Line
- Bear: Price < Cloud AND Conversion < Base Line
- Parameters: Conv(9), Base(26), Span B(52), Displacement(26)
Aroon Oscillator
- Bull: Aroon Up > 70 AND Aroon Down < 30
- Bear: Aroon Down > 70 AND Aroon Up < 30
- Default lookback: 25 periods
Trend is confirmed only when both indicators agree (Ichimoku + Aroon ≥ +1 for bull, ≤ -1 for bear).
• Setup Classification Logic
The framework combines Bias (fundamental valuation) with Trend (technical momentum) to generate four distinct setup types:
- Long↗︎ (Setup = 1) – Undervalued + Bullish Trend
Context : Mean reversion opportunity with momentum confirmation. Currency trading at fundamental discount while technical trend supports upside.
- Short↘︎ (Setup = -1) – Overvalued + Bearish Trend
Context : Mean reversion opportunity with momentum confirmation. Currency trading at fundamental premium while technical trend supports downside.
- Watch (Setup = 2) – Valuation bias present, but no clear trend
Context : Fundamental mispricing without directional conviction. Monitor for trend emergence before entering.
- Conflict (Setup = 3) – Bias and trend pointing opposite directions
Context : Overvalued currency in uptrend OR undervalued currency in downtrend. Avoid—either trend continuation or valuation mean reversion, but unclear which dominates.
• Confidence Score (0-100%)
Each setup receives a quantitative confidence weighting based on three factors:
1. Band Distance (40%) – How far the Relative Index deviates from 100 baseline
2. Z-Score Magnitude (40%) – Statistical extremeness within lookback window
3. Trend Confluence (20%) – Agreement between Ichimoku and Aroon signals
Score interpretation:
- 70-100% = High confidence (both valuation and trend extremes aligned)
- 40-69% = Moderate confidence (one factor strong, others weak)
- 0-39% = Low confidence (marginal signals, questionable reliability)
═══════════════════════════════════════════════════════════════════════════════
VISUAL COMPONENTS
═══════════════════════════════════════════════════════════════════════════════
• Dashboard Table (Top-Right)
Displays real-time valuation metrics for all seven major pairs:
Column 1: Pair – Currency pair identifier
Column 2: RelIdx – Relative Index (100 = baseline at first valid bar)
Column 3: Z – Z-Score vs. rolling lookback window
Column 4: Bias – Long/Short/Neutral valuation classification
Column 5: Trend – ↑/↓/– trend direction (Ichimoku + Aroon)
Column 6: Setup – Long↗︎/Short↘︎/Watch/Conflict (color-coded)
Column 7: Conf – Confidence score 0-100% (color-coded)
Column 8: Quelle – REER (inflation-adjusted) or NEER (nominal only)
Color coding :
- Green = Long↗︎ setup
- Red = Short↘︎ setup
- Orange = Watch (no trend)
- Purple = Conflict (bias/trend divergence)
• Optional Chart Plot
Select any of the seven pairs to plot its Relative Index on the chart with:
- Baseline at 100 (horizontal gray line)
- +Band at 100 × (1 + deviation%), dashed red
- -Band at 100 × (1 - deviation%), dashed green
- Aqua line tracking the selected pair's Relative Index evolution
• Signal Labels
When a pair transitions into Long↗︎ or Short↘︎ setup:
- Green label below bar = Long↗︎ entry signal
- Red label above bar = Short↘︎ entry signal
- Positioned using ATR offset for visibility
═══════════════════════════════════════════════════════════════════════════════
KEY FEATURES
═══════════════════════════════════════════════════════════════════════════════
- Institutional valuation methodology – REER/NEER framework used by central banks and sovereign wealth funds
- Macro-fundamental integration – CPI inflation differentials adjust for purchasing power parity
- Multi-timeframe flexibility – Daily (D), Weekly (W), Monthly (M) resolution options
- Seven simultaneous pairs – Monitors all G7 FX majors in single unified dashboard
- No repainting – All signals confirm on bar close
- Automated alerts – TradingView notifications when setups transition (Long/Short triggers)
- Confidence weighting – Quantitative scoring allows position sizing calibration
- Fallback logic – Automatically switches to NEER if CPI data incomplete
═══════════════════════════════════════════════════════════════════════════════
HOW TO USE
═══════════════════════════════════════════════════════════════════════════════
1. Apply to any chart – The indicator pulls multi-security data; chart symbol does not matter (commonly applied to SPY or DXY for reference)
2. Select data feed – Default FX: (TradingView composite) is recommended; alternatives: OANDA, FXCM, FOREXCOM
3. Choose timeframe :
• Daily (D) = Swing trading, medium-term mean reversion (2-8 week horizons)
• Weekly (W) = Position trading, macro regime shifts (1-6 month horizons)
• Monthly (M) = Strategic allocation, long-term equilibrium analysis (6-24 month horizons)
4. Configure parameters :
• Z-Score Lookback : Default 252 (one trading year on Daily); adjust for timeframe (52 for Weekly, 36 for Monthly)
• Deviation Band : Default ±5%; tighten to ±3% for more signals, widen to ±7% for higher conviction
• Z-Threshold : Default ±1.5; increase to ±2.0 for extreme-only signals
5. Monitor dashboard table :
• Focus on pairs showing Long↗︎ or Short↘︎ setups with Conf ≥ 70%
• Watch for Watch setups transitioning to directional signals
• Avoid Conflict setups unless you have strong macro conviction
6. Execute mean-reversion trades :
• Long↗︎ = Buy undervalued currency (e.g., EURUSD Long if EUR undervalued)
• Short↘︎ = Sell overvalued currency (e.g., USDJPY Short if JPY overvalued)
• Target: Mean reversion toward 100 baseline or opposite band
7. Position sizing by confidence :
• High confidence (70-100%) → Standard position size
• Moderate confidence (40-69%) → Reduce size by 50%
• Low confidence (<40%) → Avoid or use minimal pilot size
8. Risk management :
• Stop loss: Place beyond recent swing high/low or 1.5× ATR
• Take profit: Opposite valuation band or 100 baseline
• Time stop: Exit if setup reverses (Long→Neutral→Short or vice versa)
═══════════════════════════════════════════════════════════════════════════════
LIMITATIONS
═══════════════════════════════════════════════════════════════════════════════
- CPI data lag – Consumer Price Index releases are monthly and report with 2-4 week delay. REER calculations may lag real-time inflation dynamics.
- Structural shifts ignored – The baseline (100) is set at first valid bar. Long-term structural appreciation/depreciation (e.g., 20-year USD bull market) is not accounted for. Suitable for cyclical mean reversion, not secular trend analysis.
- Equal-weighting assumption – All seven currencies are equally weighted in basket construction. Actual trade-weighted indices use GDP or trade volume weights, which this framework simplifies.
- No emerging market currencies – Limited to G7 majors (USD, EUR, JPY, GBP, CHF, AUD, CAD, NZD). Does not cover EM FX (e.g., CNY, BRL, MXN).
- Technical filter limitations – Ichimoku and Aroon are lagging indicators. In fast-moving markets (e.g., central bank interventions, geopolitical shocks), trend signals may arrive late.
- Mean reversion assumption – The framework assumes currencies revert to equilibrium. During regime changes (e.g., monetary policy divergence, crisis flows), deviations can persist or expand before eventual reversal.
═══════════════════════════════════════════════════════════════════════════════
TECHNICAL SPECIFICATIONS
═══════════════════════════════════════════════════════════════════════════════
- Pine Script v6
- Non-repainting (signals confirmed on bar close)
- Multi-security data feeds (7 FX pairs + 8 CPI series)
- Automated alert system (transitions to Long↗︎/Short↘︎)
- Real-time dashboard table (8 columns × 8 rows)
- Maximum 500 labels supported (100 per pair direction)
- Fallback logic: NEER used if CPI data unavailable
═══════════════════════════════════════════════════════════════════════════════
NOTES
═══════════════════════════════════════════════════════════════════════════════
This indicator is designed for experienced FX traders, macro strategists, and portfolio managers familiar with:
- Real and nominal effective exchange rate concepts
- Purchasing power parity theory and inflation differentials
- Multi-currency portfolio construction and basket hedging
- Carry trade and convergence strategies
- Central bank policy impacts on FX equilibrium levels
The framework provides objective valuation signals but does not account for:
- Interest rate differentials (carry)
- Capital flow dynamics (risk-on/risk-off)
- Central bank intervention zones
- Geopolitical risk premiums
Always combine REER/NEER valuation analysis with macro event calendars, positioning data (CFTC COT reports), and fundamental policy divergence assessments.
═══════════════════════════════════════════════════════════════════════════════
Developed for institutional FX valuation analysis based on central bank REER/NEER methodologies.

NWOG/NDOG [NINE Θ]Overview
A professional-grade indicator for detecting and visualizing New Week Opening Gaps (NWOGs) and New Day Opening Gaps (NDOGs), essential concepts in ICT (Inner Circle Trader) methodology and analysis.
What Are Opening Gaps?
Opening gaps represent price inefficiencies created between trading sessions. When one session closes and the next session opens at a different price, the resulting "gap" creates a zone of unfilled orders and potential liquidity. These gaps often act as magnets for price, providing high-probability trading opportunities as the market seeks to rebalance these inefficiencies.
NWOG (New Week Opening Gap)
The gap between Friday's close and Sunday's open. These weekly imbalances are significant because they represent the collective repositioning of institutional traders over the weekend. NWOGs frequently serve as major support/resistance zones that can influence price action for days or even weeks. Due to their larger timeframe context, NWOGs typically carry more weight than daily gaps.
NDOG (New Day Opening Gap)
The gap between one session's close and the next session's open. Daily gaps occur more frequently than weekly gaps, offering more regular trading setups. While individually less significant than NWOGs, NDOGs provide valuable intraday reference points and often fill within the same trading session.
Features In Depth
Gap Detection & Visualization
The indicator automatically identifies and plots opening gaps as they form in real-time.
Automatic Detection: The indicator monitors session transitions and instantly identifies when a gap forms between the previous close and current open. NWOGs are detected on Sunday opens, while NDOGs are detected at each new daily session open (excluding Sundays, which are reserved for NWOG detection).
Bullish vs Bearish Classification: Each gap is automatically classified based on its direction:
Bullish Gap (Gap Up): Current open is higher than previous close, indicates overnight buying pressure
Bearish Gap (Gap Down): Current open is lower than previous close, indicates overnight selling pressure
The indicator uses distinct color schemes for bullish and bearish gaps, making it easy to identify gap direction at a glance. Current/most recent gaps use the "new" color settings, while historical gaps use the standard color settings.
Historical Tracking: Track up to 20 gaps of each type simultaneously. The "Historical Count" setting controls how many gaps remain visible on your chart. Older gaps are automatically removed as new ones form, keeping your chart clean while maintaining relevant historical context.
Visual Customization:
Toggle gap boundary lines (HIGH/LOW) on or off independently from the background fill
Choose line styles: solid (⎯⎯⎯), dashed (----), or dotted (····)
Adjust line thickness from 1-4 pixels
Enable/disable background fill with customizable transparency
Set colors independently for current vs historical gaps
Consequent Encroachment (C.E.)
The Consequent Encroachment represents the 50% midpoint of a gap — a critical level in ICT methodology.
Why C.E. Matters: In smart money concepts, the C.E. level represents the point of maximum efficiency within an imbalance. Price often gravitates toward this level as it seeks to rebalance the gap. Many traders use C.E. as their primary target when trading gap fills, or as a key level for entries and stop placement.
C.E. Display Options:
Independent color settings for current vs historical gaps
Separate line style and thickness controls
Can be shown/hidden independently from gap boundaries
Quarter Levels (25% and 75%): For traders who want additional precision, the indicator offers optional quarter levels at 25% and 75% of the gap range. These levels can serve as:
Partial profit targets
Scaling entry points
Additional support/resistance zones within the gap
Fill Tracking & Percentage
The indicator provides sophisticated fill tracking to monitor how much of each gap has been "filled" by subsequent price action.
How Fill Percentage Works:
For bullish gaps (gap up): Measures how far price has retraced DOWN from the gap's high toward its low
For bearish gaps (gap down): Measures how far price has retraced UP from the gap's low toward its high
The fill percentage updates in real-time as price moves through the gap zone, giving you instant feedback on gap fill progress.
Fill Detection Methods:
Wicks: Uses the full candle range (high/low) — more sensitive, detects fills earlier
Bodies: Uses only open/close prices — more conservative, requires stronger commitment
Visual Fill Indicators: The fill percentage is displayed with intuitive symbols:
〇 0-24% filled — Gap is largely untouched
◔ 25-49% filled — Minor fill in progress
◑ 50-74% filled — C.E. level has been reached
◕ 75-99% filled — Gap nearly complete
⬤ 100% filled — Gap fully filled
Hide Filled Gaps: Enable this option to automatically remove gaps from your chart once they reach 100% fill. This keeps your chart focused on active, unfilled gaps that still represent potential trading opportunities.
Projection Levels
When price breaks out of a gap zone, projection levels provide potential targets based on the gap's size.
How Projections Work: Once price closes above a gap's high (for upward projections) or below a gap's low (for downward projections), the indicator calculates extension levels using the gap's range as a measuring unit. These projections function similarly to Fibonacci extensions but are anchored to the gap's dimensions.
Projection Direction:
Upward Projections: Triggered when price closes above the gap's high — levels project above the gap
Downward Projections: Triggered when price closes below the gap's low — levels project below the gap
Customizable Multipliers: Define your own projection levels using the "Projection Levels" input. Enter comma-separated values representing multiples of the gap size:
Default: 0.5,1,2,2.5
Example custom: 0.618,1,1.618,2,2.618 (Fibonacci-based)
Each value creates a projection line at that multiple of the gap range
Projection Display Options:
Side: Display projections on the Left (extending back from gap formation) or Right (extending forward)
Color, Style, Thickness: Full visual customization
Labels: Show multiplier values at each projection level
"Extend Until Tapped" Feature: When enabled (Left side only), projection lines stop extending once price touches them. This creates a visual record of which levels have been reached and when, helping you track projection performance over time. Untapped projections continue extending until they're reached.
Labels & Formatting
Comprehensive labeling options help you quickly identify and reference gaps on your chart.
Label Format Options:
Gap Type: Simple label showing "NWOG" or "NDOG"
Gap Type + Date: Includes the full date with day of week (e.g., "NWOG Monday, November 3, 2025")
Gap Type + Date + Filled Percent: Adds the fill percentage and symbol (e.g., "NWOG Monday, November 3, 2025 ")
Label Positioning:
When Show Levels is ON: Separate labels appear at the HIGH and LOW boundaries
When Show Levels is OFF: A single label appears at the C.E. (midpoint) level
Label Customization:
Text size: Tiny, Small, Normal, or Large
Text color and background color (set background transparency to 100 for no background)
Tooltips provide detailed information including all price levels and fill percentage
Hide Historical Labels: Enable this option to hide labels and projection text on all gaps except the most recent. Lines remain visible, but text clutter is reduced — useful when tracking many historical gaps.
Status Table
An optional summary table provides at-a-glance information about all active gaps.
Table Contents: For each active gap, the table displays:
Gap Type: NWOG or NDOG with date
HIGH: Upper boundary of the gap
LOW: Lower boundary of the gap
C.E.: Consequent Encroachment (50% level)
% Filled: Current fill percentage with visual symbol
Display Settings:
Position: 9 positions available (Top/Middle/Bottom × Left/Center/Right)
Size: Tiny, Small, or Normal text
Gap Count: Control how many NWOGs and NDOGs appear in the table (1-3 each)
Adaptive Theming: The table automatically detects your chart's background color and adjusts text colors for optimal readability on both light and dark themes.
Smart Filtering: The table only shows unfilled gaps (or gaps not hidden by the "Hide Filled" setting), keeping the display focused on actionable information.
Alert System
Stay informed of key gap events without constantly monitoring your charts.
Gap Formation Alerts: Receive an alert the moment a new gap is detected. The alert includes:
Gap direction (Bullish/Bearish)
Gap type (NWOG/NDOG)
Symbol name
Example: "Bullish NWOG formed on AMEX:SPY "
Gap Filled Alerts: Get notified when a gap reaches 100% fill. This is valuable for:
Confirming trade targets have been reached
Identifying when gaps are no longer active reference points
Example: "NWOG filled on AMEX:SPY "
Projection Level Alerts: Receive alerts when price reaches your defined projection levels. Each level only alerts once, preventing spam. Useful for:
Taking profits at projection targets
Identifying extended moves beyond the gap
Example: "NWOG 2x projection reached on AMEX:SPY "
General Settings
Gap Offset: Controls how many bars the gap lines extend to the right of the current candle (0-15 bars). A higher offset keeps labels and lines visible further into the future, while a lower offset keeps the display tighter to current price action.
Tips
NWOG Priority: NWOGs typically hold more significance than NDOGs due to their weekly timeframe. When NWOG and NDOG levels conflict, consider giving more weight to the NWOG.
Unfilled Historical Gaps: Gaps from days or weeks ago can still influence current price action. Don't ignore older unfilled gaps — they often become relevant when price returns to those zones.
Session Context: Pay attention to which session created the gap. Gaps formed during high-volume sessions (like NYSE open) may carry more significance than gaps from lower-volume periods.
Gap Size Matters: Larger gaps represent more significant imbalances and often provide stronger support/resistance. Smaller gaps may fill quickly and offer less reliable levels.
Clean Chart Option: Use "Hide Historical Labels" combined with the status table to maintain a clean chart while still having access to all gap information.
Requirements
Intraday Timeframes Only: This indicator works exclusively on intraday timeframes (minutes, hours). Gap detection requires session open/close data that is only available on intraday charts.
Sufficient Historical Data: Ensure your chart has enough historical bars loaded for accurate gap tracking, especially if using higher historical count settings.
Session-Based Markets: The indicator is optimized for markets with distinct trading sessions (stocks, futures, forex). 24/7 markets like crypto may show fewer or different gap patterns.
Disclaimer
For Educational and Informational Purposes Only
This indicator is provided as a technical analysis tool for educational and informational purposes only. It is not intended as, and should not be construed as, financial advice, investment advice, trading advice, or any other type of advice.
No Guarantees: Past performance of any trading strategy, indicator, or methodology is not indicative of future results. The identification of gaps, projections, and fill levels does not guarantee that price will behave in any predicted manner. Markets are inherently unpredictable, and no technical indicator can accurately predict future price movements.
Risk Warning: Trading financial instruments involves substantial risk of loss and is not suitable for all investors. You should carefully consider your investment objectives, level of experience, and risk appetite before trading. Never trade with money you cannot afford to lose.
Not Financial Advice: The creator of this indicator (NINE) is not a licensed financial advisor, broker, or dealer. Nothing in this indicator or its documentation should be interpreted as a recommendation to buy, sell, or hold any financial instrument.
Your Responsibility: You are solely responsible for your own trading decisions. Always conduct your own research and due diligence before making any trading or investment decisions. Consider consulting with a qualified financial professional before trading.
No Liability: The creator assumes no responsibility or liability for any errors, inaccuracies, or omissions in this indicator or its documentation. The creator shall not be held liable for any losses, damages, or costs arising from the use or inability to use this indicator.

SMC Pro+ ICT v4 Enhanced - FINAL🎯 SMC Pro+ ICT v4 Enhanced - Complete Smart Money Trading System📊 Professional All-in-One Indicator for Smart Money Concepts & ICT MethodologyThe SMC Pro+ ICT v4 Enhanced is a comprehensive trading system that combines Smart Money Concepts (SMC) with Inner Circle Trader (ICT) methodology. This indicator provides institutional-grade market structure analysis, liquidity mapping, and volume profiling in one powerful package.✨ CORE FEATURES🏗️ Advanced Market Structure Detection
MSS (Market Structure Shift) - Identifies major trend reversals with precision
BOS (Break of Structure) - Confirms trend continuation moves
CHoCH (Change of Character) - Detects internal structure shifts
Modern LuxAlgo-Style Lines - Clean, professional visualization
Dual Sensitivity System - External structure (major swings) + Internal structure (minor swings)
Customizable Labels - Tiny, Small, or Normal sizes
Structure Break Visualization - Clear break point markers
💎 Supply & Demand Zones (POI - Point of Interest)
Institutional Order Blocks - Where smart money enters/exits
ATR-Based Zone Sizing - Dynamically adjusted to market volatility
Smart Overlap Detection - Prevents cluttered charts
Historical Zone Tracking - Maintains up to 50 zones
POI Central Lines - Pinpoint entry/exit levels
Auto-Extension - Zones extend to current price
Auto-Cleanup - Removes broken zones automatically
📦 Fair Value Gap (FVG) Detection
Bullish & Bearish FVGs - Institutional inefficiencies
Consequent Encroachment (CE) - 50% fill levels
Auto-Delete Filled Gaps - Keeps charts clean
Customizable Lookback - 1-30 days of history
Color-Coded Zones - Easy visual identification
CE Line Styles - Dotted, Dashed, or Solid
🚀 Enhanced PVSRA Volume Analysis
This is one of the most powerful features:
200% Volume Candles - Extreme institutional activity (Lime/Red)
150% Volume Candles - High institutional interest (Blue/Fuchsia)
Volume Climax Detection - Major reversal signals with 2.5x+ volume
Exhaustion Signals - Identifies buying/selling exhaustion with high accuracy
Enhanced Volume Divergence - NEW! High-quality reversal detection
Price makes lower low, Volume makes higher low = Bullish Divergence
Price makes higher high, Volume makes lower high = Bearish Divergence
Strict trend context filtering for accuracy
Rising/Falling Volume Patterns - Momentum confirmation (allows 1 exception in 3 bars)
Volume Spread Analysis - Price range × Volume for true strength
Body/Wick Ratio Analysis - Candle structure quality
ATR Normalization - Adjusts for different market volatility
Volume Profile Indicators - 🔥 EXTREME, ⚡ VERY HIGH, 📈 HIGH, ✅ ABOVE AVG
💧 Advanced Liquidity System
Smart money targets these levels:
Weekly High/Low Liquidity - Major institutional targets
Daily High/Low Liquidity - Intraday key levels
4H Session Liquidity - Short-term targets
Distance Indicators - Shows % distance from current price
Strength Indicators - Identifies high-probability sweeps
Swept Level Detection - Tracks executed liquidity grabs
Customizable Line Styles - Width, length, offset controls
Color-Coded Levels - Easy visual hierarchy
🎯 Master Bias System
Data-driven directional bias with 9-factor scoring:
Bull/Bear Bias Calculation - 0-100% scoring system
Multi-Timeframe Analysis - Daily, 4H, 1H trend alignment
Kill Zone Integration - London (2-5 AM) & NY (8-11 AM) sessions
EMA Alignment Factor - Trend confirmation
Volume Confirmation - Adds 5% when volume supports direction
Range Filter Integration - Adds 10% for trending markets
Session Context - Above/below session midpoint scoring
Bias Strength Rating - STRONG (>75%), MODERATE (60-75%), WEAK (<60%)
Real-Time Updates - Dynamic recalculation
📈 Premium & Discount Zones
Fibonacci-based institutional pricing:
Extreme Premium - Above 78.6% (Overvalued)
Premium Zone - 61.8% - 78.6% (Expensive)
Equilibrium - 38.2% - 61.8% (Fair Value)
Discount Zone - 21.4% - 38.2% (Cheap)
Extreme Discount - Below 21.4% (Undervalued)
Visual Zone Boxes - Color-coded for instant recognition
200-500 Bar Lookback - Customizable range calculation
🔄 Range Filter
Advanced trend detection:
Smoothed Range Calculation - Eliminates noise
Dynamic Support/Resistance - Auto-adjusting levels
Upward/Downward Counters - Measures trend strength
Color-Coded Line - Green (uptrend), Red (downtrend), Orange (ranging)
Adjustable Period - 1-200 bars
Multiplier Control - Fine-tune sensitivity (0.1-10.0)
🌊 Liquidity Zones (Vector Zones)
PVSRA-based horizontal liquidity:
Above Price Zones - Resistance clusters
Below Price Zones - Support clusters
Maximum 500 Zones - Professional-grade capacity
Body/Wick Definition - Choose zone boundaries
Auto-Cleanup - Removes cleared zones
Color Override - Custom styling options
Transparency Control - 0-100% opacity
📊 EMA System
Triple EMA trend confirmation:
Fast EMA (9) - Green line - Immediate trend
Medium EMA (21) - Blue line - Short-term trend
Slow EMA (50) - Red line - Major trend
EMA Alignment Detection - Bull/Bear stack confirmation
Dashboard Integration - Status: 📈 BULL ALIGN, 📉 BEAR ALIGN, 🔀 MIXED
Adjustable Lengths - Customize all three EMAs (5-200)
🎯 IDM (Institutional Decision Maker) Levels
Key institutional price levels:
Latest IDM Detection - 20-bar pivot lookback
Extended Lines - Projects 50 bars into future
Customizable Styles - Solid, Dashed, or Dotted
Line Width Control - 1-5 pixels
Color Selection - Match your chart theme
Price Label - Shows exact level with tick precision
📱 Professional Dashboard
Real-time market intelligence panel:
🎯 SIGNAL - 🟢 LONG, 🔴 SHORT, ⏳ WAIT, 🛑 NO TRADE
🎲 BIAS - Bull/Bear with STRONG/MODERATE/WEAK rating
📊 BULL/BEAR Scores - 0-100% percentage display
💎 ZONE - Current premium/discount location
🕐 KZ - Kill Zone status (🇬🇧 LONDON/🇺🇸 NY/⏸️ OFF)
🏗️ STRUCT - Market structure status (BULLISH/BEARISH/NEUTRAL)
⚡ EVENT - Last structure event (MSS/BOS)
⚡ INT - Internal structure trend
🎯 IDM - Latest institutional level
📊 EMA - EMA alignment status
🔄 RF - Range Filter direction
📊 PVSRA - Volume status (🚀 CLIMAX/📈 RISING/📉 FALLING)
📅 MTF - Multi-timeframe alignment (✅ FULL/⚠️ PARTIAL/❌ CONFLICT)
💪 CONF - Confidence score (0-100%)
📊 VOL - Volume ratio (e.g., 1.8x average)
Advanced Metrics (Toggle On/Off):
📏 RSI - Value + Status (OVERBOUGHT/STRONG/NEUTRAL/WEAK/OVERSOLD)
📈 MACD - Value + Direction (BULL/BEAR)
🌪️ VOL - Volatility state (⚠️ EXTREME/🔥 HIGH/📊 NORMAL/😴 LOW)
🔊 VOL PROF - Volume profile ratio
⏱️ TF - Current timeframe
Dashboard Customization:
4 Positions - Top Left, Top Right, Bottom Left, Bottom Right
3 Sizes - Small, Normal, Large
2 Modes - Compact (MTF combined) or Full (separate rows)
Professional Design - Dark theme with color-coded cells
🎮 TRADING SIGNALS & SETUP SCORING🟢 LONG Setup Requirements (9-Factor Confidence Score)
MTF Alignment - Daily/4H/1H/Structure all bullish (+2 points for full, +1 for partial)
Volume Confirmation - Above 1.2x average (+1 point)
Structure Event - MSS or BOS bullish (+2 points)
EMA Alignment - 9 > 21 > 50 (+1 point)
Kill Zone Active - London/NY + Bull bias >75% (+2 points)
Bias Match - Master bias matches structure trend (+1 point)
Confidence Threshold - >60% minimum for signal
🔴 SHORT Setup Requirements
Same 9-factor system but inverted for bearish conditions.💪 Confidence Levels
75-100% - ⭐ HIGH CONFIDENCE (Strong setup, all factors aligned)
50-74% - ⚠️ MODERATE (Good setup, partial alignment)
0-49% - ❌ LOW CONFIDENCE (Wait for better setup)
🎯 Signal Output
🟢 LONG - Bull bias + Bullish structure + >60% confidence
🔴 SHORT - Bear bias + Bearish structure + >60% confidence
⏳ WAIT LONG - Bull bias but low confidence
⏳ WAIT SHORT - Bear bias but low confidence
🛑 NO TRADE - Neutral bias or conflicting signals
🔔 COMPREHENSIVE ALERT SYSTEM (12 Alerts)Structure Alerts
⚡ MSS Bullish - Major bullish reversal
⚡ MSS Bearish - Major bearish reversal
📈 BOS Bullish - Bullish continuation
📉 BOS Bearish - Bearish continuation
⚠️ CHoCH Bullish - Internal bullish shift
⚠️ CHoCH Bearish - Internal bearish shift
Bias & Confidence Alerts
🟢 Bias Shift Bull - Master bias turns bullish
🔴 Bias Shift Bear - Master bias turns bearish
⭐ High Confidence - Setup reaches 75%+ confidence
Volume Alerts (High Probability)
🚀 Volume Climax Buy - Extreme bullish volume spike
💥 Volume Climax Sell - Extreme bearish volume spike
⚠️ Selling Exhaustion - Potential bullish reversal
⚠️ Buying Exhaustion - Potential bearish reversal
📊 Bullish Volume Divergence - High-quality bullish reversal signal
📊 Bearish Volume Divergence - High-quality bearish reversal signal
🎨 EXTENSIVE CUSTOMIZATIONColors & Styling
✅ All colors customizable for every component
✅ Supply/Demand zone colors + outlines
✅ FVG colors (bullish/bearish)
✅ PVSRA candle colors (6 types)
✅ Liquidity level colors (Weekly/Daily/4H/Swept)
✅ Structure line colors
✅ Premium/Equilibrium/Discount zone colorsDisplay Controls
✅ Toggle each feature on/off independently
✅ Adjustable sensitivities (Structure: 5-30, Internal: 3-15)
✅ Label size controls (Tiny/Small/Normal)
✅ Line width adjustments (1-5 pixels)
✅ Transparency controls (0-100%)
✅ Extension lengths (20-100 bars)
✅ Lookback periods (50-500 bars)Volume Settings
✅ PVSRA symbol override (trade one asset, analyze another)
✅ Climax threshold (2.0-5.0x)
✅ Rising volume bar count (2-5 bars)
✅ Divergence filters (Strict/Lenient)
✅ Divergence minimum bars (10-30)
✅ Volume threshold multiplier (1.0-2.0x)Dashboard Settings
✅ Position (4 corners)
✅ Size (Small/Normal/Large)
✅ Compact/Full mode
✅ Show/Hide advanced metrics
✅ Show/Hide EMA status💡 BEST PRACTICES & USAGE TIPS⏰ Optimal Timeframes
Scalping - 1m, 5m (Use Kill Zones, Volume Climax, FVG)
Day Trading - 5m, 15m, 1H (Use Structure, Liquidity, Bias)
Swing Trading - 4H, Daily (Use MTF, Premium/Discount, Structure)
Position Trading - Daily, Weekly (Use major structure, liquidity)
🎯 Asset Classes
✅ Forex - All pairs (especially majors during Kill Zones)
✅ Crypto - BTC, ETH, altcoins (24/7 liquidity)
✅ Stocks - All stocks and indices (use session times)
✅ Commodities - Gold, Silver, Oil (high volume periods)
✅ Indices - S&P 500, NASDAQ, DAX, etc.🔥 High-Probability Setups
The Perfect Storm
MSS in direction of daily trend
Kill Zone active
Volume climax
Confidence >75%
Price in discount (long) or premium (short)
Volume Divergence Play
Enhanced volume divergence signal
CHoCH confirms direction change
Price near liquidity level
FVG forms for entry
Liquidity Sweep
Price sweeps weekly/daily high/low
Immediate rejection (selling/buying exhaustion)
Structure shift (MSS)
Volume confirmation
Structure Retest
BOS breaks structure
Price returns to POI/FVG
Volume confirms (>1.2x)
Kill Zone active
📊 Multi-Timeframe Analysis
Higher Timeframe - Identify trend & structure (Daily/4H)
Trading Timeframe - Find entries (15m/1H)
Lower Timeframe - Precise entries (1m/5m)
Look for MTF alignment - Dashboard shows ✅ FULL or ⚠️ PARTIAL
⚠️ Risk Management
Always use stop-loss (below/above recent structure)
Position size: 1-2% risk per trade
Target liquidity levels for take profit
Use supply/demand zones for SL placement
Watch for exhaustion signals near targets

D/W/M RSI & %CHNG + ATRThis indicator provides a comprehensive, at-a-glance dashboard displaying key technical metrics across multiple timeframes: Daily, Weekly, and Monthly. It tracks Price Change Percentage, Relative Strength Index (RSI), and Average True Range (ATR) for each timeframe, helping traders quickly assess market trends, momentum, and volatility in one view.
Key Features:
Price Change % (Daily/Weekly/Monthly):
Displays the percentage change in price over the selected timeframes, giving traders insight into short-term, medium-term, and long-term price movement trends.
Relative Strength Index (RSI):
Shows the RSI value on Daily, Weekly, and Monthly timeframes. The RSI measures momentum, indicating overbought or oversold conditions:
Average True Range (ATR):
Tracks the ATR across multiple timeframes to assess market volatility. Higher ATR values signify more significant price movement (higher volatility), while lower values suggest quieter markets.
This indicator helps traders make informed decisions by quickly visualizing price momentum, market volatility, and possible trend reversals. It's ideal for swing traders, day traders, and long-term investors who need a bird's-eye view of the market across different timeframes.
How to Use:
Add the indicator to your TradingView chart.
Review the Price Change % to see how the market is trending across the selected timeframes.
Use the RSI to identify overbought or oversold conditions.
Check the ATR to assess current market volatility and adjust position sizes accordingly.
ONE Clear Multi‑Timeframe Synchronization (MTS) [Sync]**Script Profile — ONE Clear Multi‑Timeframe Synchronization (MTS) (Pine v6)**
* **Purpose:** Identifies a *multi‑timeframe “ignition”* pattern—strong daily upside confirmed by the next day and aligned with weekly & monthly structure—designed for pattern recognition and research (non‑financial advice).
* **Core Signals:**
* **MTS D1 (Ignition):** Day‑1 ≥ **+7%**, **close near high** (≥95%), **volume expansion** vs 20‑day average, and **prior‑day hammer** (stabilization).
* **MTS D2 (Confirmation):** Day‑2 ≥ **+5%** to validate D1.
* **Higher‑TF Alignment:** Confirms **weekly** (close above prior week’s high or green week) and **monthly** (close above prior month’s high or green month) conditions via `request.security`.
* **Context Overlays (optional):** Pivot‑based **Support/Resistance** with **“B” breaks** (green = resistance break; red = support break) gated by a **volume oscillator** (EMA5 vs EMA10).
* **Alerts:**
* **MTS Ignition Confirmed** (D1 + D2 + hammer + weekly/monthly + volume gate)
* **Support/Resistance Broken** (with volume gate)
* **Stability Fix:** Precomputes `ta.crossover`/`ta.crossunder` **once per bar** and reuses variables in conditions to avoid inconsistent historical evaluation—*no change in strategy logic or thresholds.*
* **Typical Read:** Use D1 (low/mid/high) as reference levels; D2 confirms regime shift; green “B” after D2 suggests continuation, red “B” warns of failure.

Swing Trading IndicatorThis script is a swing‑trading dashboard designed for BTC, ETH, S&P 500 (for now). It combines weekly RSI, USDT.D, VIX, moving averages and Fisher Transform into a single visual tool, with background highlights, an on‑chart info table and ready‑made alerts to help you time high‑probability swing entries and manage risk.
1. Overview
The indicator is intended to work on daily timeframe.
Signals are context‑aware: BTC and ETH get USDT.D conditions, SPX gets VIX and EMA‑100 logic, and all non‑ETH symbols can also use Fisher Transform as a mean‑reversion filter.
2. Conditions and background highlights
Each component sets a boolean condition and, when active, paints a background layer:
Weekly RSI condition
True when weekly RSI is below its symbol‑specific threshold.
USDT.D conditions
BTC: triggered when USDT.D is above the user threshold and the chart symbol is BTC.
ETH: same logic for ETH, but tracked separately..
VIX condition (SPX only)
True when VIX high is at or above the VIX threshold while the chart is SPX.
EMA condition (BTC & SPX)
BTC: daily close below EMA‑200.
SPX: daily close below EMA‑100.
Fisher Transform condition (non‑ETH)
Fisher Transform on the chart timeframe, using the configured period.
True when Fisher value is below the Fisher threshold.
3. Intended use and notes
This indicator is designed as a confluence tool for swing traders, not a standalone buy/sell system. It works best on assets that are in a clear uptrend, where the main idea is to accumulate during corrections within that broader bullish structure.
During larger market shocks, deep corrections, or black‑swan events, trend‑based and mean‑reversion filters can produce false signals, because volatility and correlations often behave abnormally in those periods. For that reason, this script should always be combined with independent risk management, higher‑timeframe trend analysis, and your own discretion.

Simple Multi VWAPSimple Multi VWAP - Release Notes
Overview
**Simple Multi VWAP** is a powerful Volume Weighted Average Price (VWAP) indicator that allows you to display up to **four independent VWAP lines** simultaneously on your chart, each with its own customisable anchor period. This provides traders with a comprehensive view of volume-weighted price levels across different timeframes, enabling better analysis of price action and support/resistance levels.
Key Features
Multiple VWAP Lines
- Display up to **4 independent VWAP lines** on a single chart
- Each VWAP can be individually enabled or disabled
- Each VWAP maintains its own anchor period independently
Flexible Anchor Periods
Choose from **10 different anchor periods** for each VWAP:
- **Session** - Resets daily
- **Week** - Resets weekly
- **Month** - Resets monthly
- **Quarter** - Resets quarterly
- **Year** - Resets annually
- **Decade** - Resets every 10 years
- **Century** - Resets every 100 years
- **Earnings** - Resets on earnings announcements
- **Dividends** - Resets on dividend payments
- **Splits** - Resets on stock splits
Native Styling Support
- Full integration with TradingView's native style dialog
- Right-click any VWAP line to customise:
- Colour
- Line style (solid, dashed, dotted, etc.)
- Line thickness
- Opacity
- Default colours provided for easy identification:
- **VWAP #1**: Orange (#f19d37)
- **VWAP #2**: Purple (#7859bc)
- **VWAP #3**: Red (#df484b)
- **VWAP #4**: Cyan (#54b9d1)
Global Settings
- **Source**: Choose the price source (default: Close)
- **Offset**: Shift VWAP lines forward/backward in time
- **Hide on 1D or Above**: Automatically hide VWAPs on daily or higher timeframes
How to Use
Basic Setup
1. **Add the Indicator**: Search for "Simple Multi VWAP" in TradingView's indicator library
2. **Enable VWAPs**: Check the boxes next to the VWAPs you want to display
3. **Select Anchor Periods**: Choose the anchor period for each enabled VWAP using the dropdown next to each VWAP toggle
4. **Customise Styling**: Right-click any VWAP line → "Style" to customise appearance
Recommended Configurations
Intraday Trading
- **VWAP #1**: Session (daily reset)
- **VWAP #2**: Week (weekly reset)
- **VWAP #3**: Month (monthly reset)
Swing Trading
- **VWAP #1**: Week (weekly reset)
- **VWAP #2**: Month (monthly reset)
- **VWAP #3**: Quarter (quarterly reset)
Long-term Analysis
- **VWAP #1**: Month (monthly reset)
- **VWAP #2**: Quarter (quarterly reset)
- **VWAP #3**: Year (yearly reset)
- **VWAP #4**: Decade (decade reset)
Input Settings
Global Settings
- **Source**: Price source for all VWAP calculations (default: Close)
- **Offset**: Number of bars to shift the VWAP lines (default: 0)
- **Hide VWAP on 1D or Above**: Toggle to hide all VWAPs on daily/weekly/monthly charts
VWAP Settings
Each VWAP has two settings displayed on the same line:
- **Enable Toggle**: Checkbox to show/hide the VWAP line (labelled as "VWAP#1", "VWAP#2", etc.)
- **Anchor Period**: Dropdown to select the reset period (labelled as "---> Anchor Period")
*Note: All VWAP settings are grouped under a single "VWAPs" group for easy organisation.*
Technical Details
Calculation Method
The indicator uses TradingView's built-in `ta.vwap()` function, which calculates:
**VWAP** = Σ(Price × Volume) / Σ(Volume)
The calculation resets based on the selected anchor period, ensuring accurate volume-weighted averages for each timeframe.
Event-Based Anchors
For Earnings, Dividends, and Splits anchors, the indicator uses TradingView's data requests to detect these events automatically, ensuring precise reset points.
Use Cases
Support and Resistance Levels
Multiple VWAPs help identify key support and resistance zones across different timeframes. Price often respects these levels, making them valuable for entry and exit decisions.
Trend Analysis
Compare price action against multiple VWAPs to gauge trend strength:
- Price above all VWAPs = Strong uptrend
- Price below all VWAPs = Strong downtrend
- Mixed positioning = Consolidation or trend change
Mean Reversion
When price deviates significantly from VWAP, it may indicate overextension and potential mean reversion opportunities.
Entry/Exit Signals
- **Long Entry**: Price crosses above VWAP with volume confirmation
- **Short Entry**: Price crosses below VWAP with volume confirmation
- **Exit**: Price returns to VWAP after a significant move
Tips & Best Practices
1. **Start Simple**: Begin with 1-2 VWAPs to avoid chart clutter
2. **Match Timeframes**: Use anchor periods that align with your trading timeframe
3. **Combine with Volume**: VWAP works best when combined with volume analysis
4. **Use Multiple Timeframes**: Apply the indicator to multiple chart timeframes for confirmation
5. **Customise Colours**: Use distinct colours for each VWAP to easily identify them
Notes
- The indicator requires volume data to function properly
- VWAP calculations are most accurate on intraday charts
- Event-based anchors (Earnings, Dividends, Splits) require symbol data availability
- All VWAPs share the same source input for consistency
Version Information
**Current Version**: 1.0.0

BTC vs Russell2000Description
The BTC vs Russell2000 – Weekly Cycle Map compares Bitcoin’s performance against the Russell 2000 (IWM) to identify long-term risk-on and risk-off market regimes.
The indicator calculates the BTC/RUT ratio on a weekly timeframe and applies a moving average filter to highlight macro momentum shifts.
White line: BTC/RUT ratio (Bitcoin relative strength vs small-cap equities)
Yellow line: Weekly SMA of the ratio (trend filter)
Green background: BTC outperforming → macro bull regime
Red background: Russell 2000 outperforming → macro bear regime
Halving markers: Visual reference points for Bitcoin market cycles
This tool is designed to help traders understand capital rotation between crypto and traditional markets, improve timing of macro entries, and visualize where Bitcoin stands within its broader cycle.

HTF Frequency Zone [BigBeluga]🔵 OVERVIEW
HTF Frequency Zone highlights the dominant price level (Point of Control) and the full high–low expansion of any higher timeframe — Daily, Weekly, or Monthly. It captures the frequency of closes inside each HTF candle and plots the most traded “frequency zone”, allowing traders to easily see where price spent the most time and where buy/sell pressure accumulated.
This tool transforms each higher-timeframe bar into a fully visualized structure:
• Top = HTF high
• Bottom = HTF low
• Midline = HTF Frequency POC
• Color-coded zones = bullish or bearish bias
• Labels = counts of bullish and bearish candles inside the HTF range
It is designed to give traders an immediate understanding of high-timeframe balance, imbalance, and price attraction zones.
🔵 CONCEPTS
HTF Partitioning — Each Weekly/Daily/Monthly candle is converted into a dedicated zone with its own High, Low, and Frequency Point of Control.
Frequency POC (Most Touched Price) — The indicator divides the HTF range into 100 bins and counts how many times price closed near each level.
Dominant Zone — The level with the highest frequency becomes the HTF “Value Zone,” plotted as a bold central line.
Directional Bias —
• Bullish HTF zone
• Bearish HTF zone
Internal Candle Counting — Within each HTF period the indicator counts:
• Buy candles (close > open)
• Sell candles (close < open)
This reveals whether intraperiod flow was bullish or bearish.
HTF Structure Blocks — High, Low, and POC are connected across the entire higher-timeframe duration, showing the real shape of HTF balance.
🔵 FEATURES
Automatic HTF Zone Construction — Generates a complete price zone every time the selected timeframe flips (Daily / Weekly / Monthly).
Dynamic High & Low Extraction — The indicator scans every bar inside the HTF window to find true extremes of the range.
100-Level Frequency Scan — Each close within the period is assigned to a bin, creating a detailed distribution of price interaction.
HTF POC Highlighting — The most frequent price level is plotted with a bold red line for immediate visual clarity.
Bull/Bear Coloring —
• Green → Bullish HTF zone.
• Orange → Bearish HTF zone.
Zone Shading — High–Low range is filled with a semi-transparent color matching trend direction.
Buy/Sell Candle Counters — Printed at the top and bottom of each HTF block, showing how many internal candles were bullish or bearish.
POC Label — Displays frequency count (how many touches) at the POC level.
Adaptive Threshold Warning — If bars inside the HTF window are too few (<10), the indicator warns the trader to switch timeframe.
🔵 HOW TO USE
Higher-Timeframe Biasing — Read the zone color to determine if the HTF candle leaned bullish or bearish.
Value Zone Reactions — Price often reacts to the Frequency POC; use it as support/resistance or liquidity magnet.
Range Context — Identify when price is trading near HTF highs (breakout potential) or lows (reversal potential).
Momentum Evaluation — More bullish internal candles = internal buying pressure; more bearish = internal selling pressure.
Swing Trading — Use HTF zones as the “macro map,” then execute trades on lower timeframes aligned with the zone structure.
Liquidity Awareness — The HTF POC often aligns with algorithmic liquidity levels, making it a strong reaction point.
🔵 CONCLUSION
HTF Frequency Zone transforms raw higher-timeframe candles into detailed distribution zones that reveal true market behavior inside the HTF structure. By showing highs, lows, buying/selling activity, and the most interacted price level (Frequency POC), this tool becomes invaluable for traders who want to align executions with powerful HTF levels, liquidity magnets, and structural zones.

NoProcess PivotsNoProcess Pivots
Visualize the structural framework of price action with NoProcess Pivots, a precision tool for multi-timeframe confluence trading.
Pivots are mathematically derived levels where price statistically finds support, resistance, or equilibrium. Institutional order flow respects these levels as key decision points where liquidity pools form and inefficiencies seek rebalancing.
NoProcess Pivots displays historical pivot ranges as period-bounded zones across Daily, Weekly, and Quarterly timeframes—allowing you to observe how price has respected or violated these levels over time. By projecting ±33% extensions beyond R1/S1, traders can identify targets, retracement levels, and key reversal points.
Cross-reference pivots across multiple timeframes to find confluence zones where Daily, Weekly, and Quarterly levels stack. These high-conviction areas offer the clearest setups for entries and exits.
Features:
Multi-timeframe pivots: Daily, Weekly, Quarterly
Historical levels with adjustable depth
Period-bounded zones
±33% extensions
Adaptive light/dark mode table
Real-time Δ PP percentage
Pivot cross alerts
Built for traders who respect the math behind the markets.

MTF S/R Array - Full CustomA clean, institutional-style multi-timeframe support and resistance indicator designed for precision trading decisions. Plots previous and current period levels with full customization for backtesting and live trading.
━━━━━━━━━━━━━━━━━━━━━━
WHAT IT PLOTS
━━━━━━━━━━━━━━━━━━━━━━
MONTHLY
- Previous Month High / Low / Close
- Previous Month Highest Closing Price
- Current Month High / Low / Highest Close
WEEKLY
- Previous Week High / Low / Close
- Current Week High / Low
DAILY
- Previous Day High / Low / Close
- Current Day High / Low
SESSIONS (Full Session - EST)
- Asian: 7pm - 4am
- London: 3am - 12pm
- New York: 8am - 5pm
OPENING RANGE
- Monday/Tuesday combined high and low
- Clean box visualization for weekly initial balance
━━━━━━━━━━━━━━━━━━━━━━
WHY THESE LEVELS MATTER
━━━━━━━━━━━━━━━━━━━━━━
Institutions and smart money reference these key levels for:
- Liquidity targets
- Stop hunts
- Reversal zones
- Trend continuation entries
Previous period levels act as magnets for price. Current levels show where the battle is happening now.
━━━━━━━━━━━━━━━━━━━━━━
FULL CUSTOMIZATION
━━━━━━━━━━━━━━━━━━━━━━
Every level type has independent controls:
- Show/Hide Previous and Current separately
- Extend Bars - control how far each level stretches
- Line Width - adjust thickness per level
- Transparency - fade previous levels for clarity
- Colors - separate colors for High/Low vs Close
Additional settings:
- Labels on/off with size and style options
- Info table with position and size controls
- Opening range box transparency and border width
━━━━━━━━━━━━━━━━━━━━━━
HOW TO USE
━━━━━━━━━━━━━━━━━━━━━━
1. Use on lower timeframes (1m, 5m, 15m) to see HTF levels
2. Watch for price reactions at previous period highs/lows
3. Look for session high/low sweeps followed by reversals
4. Use Monday/Tuesday opening range for weekly bias and targets
5. Previous levels extend further back for backtesting context
━━━━━━━━━━━━━━━━━━━━━━
TIPS
━━━━━━━━━━━━━━━━━━━━━━
- Increase "Prev Extend Bars" on monthly/weekly to see levels across more history
- Use higher transparency on previous levels to keep chart clean
- Turn off sessions you don't trade to reduce clutter
- The info table shows all values at a glance - position it where it doesn't block price action
━━━━━━━━━━━━━━━━━━━━━━
BEST FOR
━━━━━━━━━━━━━━━━━━━━━━
- ICT / Smart Money Concepts traders
- Session-based strategies
- Swing traders using HTF levels on LTF entries
- Anyone who wants clean, customizable S/R levels
Works on Forex, Crypto, Stocks, Futures, and Indices.

ATR/ADR MTF Projection ArrayATR/ADR MTF Projection Array
Overview
A powerful predictive tool that projects ATR (Average True Range) and ADR (Average Daily Range) levels as clean support and resistance arrays on your chart. Designed for traders who want to anticipate the high and low of the day using volatility-based projections with multi-timeframe confluence.
This indicator combines traditional ATR analysis with ICT-style ADR methodology, giving you institutional-grade level projections from a single, customizable tool.
Key Features
🎯 Dual Volatility Metrics
ATR Projections — Classic volatility-based levels with full multi-timeframe support
ADR Projections (ICT Style) — Average Daily Range levels using Inner Circle Trader methodology
Enable/disable each independently based on your trading preference
📊 Multi-Timeframe ATR Analysis
Plot ATR levels from up to 3 timeframes simultaneously (Daily, Weekly, Monthly or custom)
Each timeframe displays with distinct styling for easy identification
Perfect for confluence trading across multiple time horizons
⚡ ICT ADR Methodology
NY Midnight calculation mode (ICT standard) or Classic Daily
Key ICT levels built-in:
1/3 ADR (Judas Swing) — Critical manipulation level where fake moves often terminate
1/2 ADR — Mid-range reference
2/3 ADR — Trending day continuation target
100% ADR — Full daily range completion
150% ADR — Extension target for expansion days
Two projection modes: Static (from anchor) or Dynamic (from session high/low)
🔧 Flexible Anchor Points
Previous Close (default)
Daily Open
Weekly Open
Monthly Open
Session Open
📈 Range Completion Tracking
Real-time display of how much of the expected daily range has been consumed
Visual status indicator helps identify when the day's move may be exhausted
How To Use
For Bias Confirmation:
Establish your directional bias using your preferred method (trigger day, market structure, etc.)
Monitor the 1/3 ADR level during London/NY open for potential Judas Swing (manipulation move)
Target 2/3 to 100% ADR for your HOD/LOD objective
For Target Setting:
Use ATR levels as volatility-based profit targets
ADR 100% level often marks session extremes
When Range Used reaches 100%+, expect consolidation or reversal
For Multi-Timeframe Confluence:
Enable Weekly/Monthly ATR levels alongside Daily
Look for clustering of levels across timeframes for high-probability zones
Settings Guide
Master Controls — Toggle ATR/ADR systems and bull/bear levels independently
ATR Settings — Configure period, multiplier, anchor point, and select which timeframes to display
ATR Level Multipliers — Choose which projection levels to show (0.5x, 0.75x, 1.0x, 1.25x, 1.5x)
ADR Settings (ICT Style) — Select calculation mode (NY Midnight recommended), period (5 days is ICT standard), and projection mode
ADR Level Selection — Toggle individual ICT levels (1/3, 1/2, 2/3, 100%, 150%)
Visual Settings — Customize colors, line styles, labels, and info table position
Alerts Included
ATR 1.0x Bull/Bear Cross
ADR 1/3 Judas Swing Zone (Bull/Bear)
ADR 100% Range Completion (Bull/Bear)

6EMA & SMA with alertOverview
This indicator is designed to combine multiple moving averages, higher-timeframe levels, and flexible alerts into a single tool. It helps you monitor trend direction, dynamic support/resistance, and key daily/weekly/monthly levels without loading several separate indicators.
Main Features
1 12 Moving Averages in One Indicator
・Plots a total of 12 lines: 6 EMAs and 6 SMAs.
・All lengths and sources are fully configurable from the settings, so you can adapt them to your own style and timeframe.
2 Slope-Based Color Change
・One EMA and one SMA are colored based on their slope (rising vs. falling).
・This makes it easy to visually confirm when the medium/long-term bias is turning up or down.
3 Price-vs-MA Alerts
・You can enable alerts when price touches or crosses any selected EMA or SMA.
・Direction can be set to “Up”, “Down”, or “Both”, and you can choose to trigger only on bar close.
・The script can also send detailed alert() messages containing the symbol, timeframe, price, and line value at the moment of the cross.
4 Daily / Weekly / Monthly High–Low Levels
・Optionally display the current Daily, Weekly, and Monthly high/low levels as rays extended to the right.
・Each set of levels can be shown or hidden individually, and has its own color, style, and width options.
・Labels (DH/DL, WH/WL, MH/ML) are attached at the right side of each line for quick identification.
Notes & Disclaimer
This indicator is for charting and alerting purposes only. It does not open, close, or manage any positions.
It does not guarantee any specific results or performance. All examples are for educational and informational purposes only.
Always test and adjust the settings on your own symbols and timeframes, and use proper risk management when applying it to live trading.

DarkPool FlowDarkPool Flow is a professional-grade technical analysis tool designed to align retail traders with the dominant "smart money" flow. Unlike standard moving average crossovers that often generate false signals during consolidation, this script employs a multi-layered filtering engine to isolate high-probability trends.
The core philosophy of this indicator is that Trends are fractal. A sustainable move on a lower timeframe must be supported by momentum on a higher timeframe. By comparing a "Fast Signal Trend" against a "Slow Anchor Trend" (e.g., Daily vs. Weekly), the script identifies the market bias used by institutional algorithms.
This edition features a Smart Recovery Engine, ensuring that valid trends are not missed simply because momentum started slowly, and a Dynamic Cloud that visually represents the strength of the trend spread.
Key Features
1. Auto-Adaptive Timeframe Logic
The script eliminates the guesswork of Multi-Timeframe (MTF) selection. By enabling "Auto-Adapt," the indicator detects your current chart timeframe and automatically maps it to the mathematically correct institutional pairings:
Scalping (<15m): Uses 15-Minute Trend vs. 1-Hour Anchor.
Day Trading (15m - 1H): Uses 4-Hour Trend vs. Daily Anchor.
Swing Trading (4H - Daily): Uses Daily Trend vs. Weekly Anchor (The classic "Golden" setup).
Investing (Weekly): Uses 21-Week EMA vs. 50-Week SMA (Bull Market Support Band logic).
2. Smart Recovery Signal Engine
Standard crossover scripts often miss major moves if the specific breakout candle has low volume or weak ADX. This script utilizes a state-machine logic that "remembers" the trend direction. If a trend begins during low volatility (gray candles), the script waits. The moment volatility and momentum confirm the move, a Smart Recovery Signal is triggered, allowing you to enter an existing trend safely.
3. Chop Protection (Gray Candles)
Preservation of capital is the priority. The script analyzes the Average Directional Index (ADX) and Volatility (ATR).
Colored Candles (Green/Red): The market is trending with sufficient strength. Trading is permitted.
Gray Candles: The market is in a low-energy chop or consolidation (ADX < 20). Trading is discouraged.
4. Dynamic Trend Cloud
The space between the Fast and Slow trends is filled with a dynamic cloud.
Darker/Opaque Cloud: Indicates a widening spread, suggesting accelerating momentum.
Lighter/Transparent Cloud: Indicates a narrowing spread, suggesting the trend may be weakening or consolidating.
5. Pullback & Retest Signals (+)
While triangles mark the start of a trend, the Plus (+) signs mark low-risk opportunities to add to a position. These appear when price dips into the cloud, finds support at the "Fair Value" zone, and closes back in the direction of the trend with confirmed momentum.
User Guide & Strategy
Setup
Add the indicator to your chart.
For Beginners: Enable "Auto-Adaptive Timeframes" in the settings.
For Advanced Users: Disable Auto-Adapt and manually configure your Fast/Slow pairings (Default is Daily 50 EMA / Weekly 50 EMA).
Signal Mode: Choose "First Breakout Only" for a cleaner chart, or "All Signals" if you wish to see re-entry points during choppy starts.
Long Entry Criteria (Buy)
Trend: The Cloud must be Green (Fast Trend > Slow Trend).
Signal: A Green Triangle appears below the bar.
Confirmation: The signal candle must not be Gray.
Re-Entry: A small Green (+) sign appears, indicating a successful test of the cloud support.
Short Entry Criteria (Sell)
Trend: The Cloud must be Red (Fast Trend < Slow Trend).
Signal: A Red Triangle appears above the bar.
Confirmation: The signal candle must not be Gray.
Re-Entry: A small Red (+) sign appears, indicating a successful test of the cloud resistance.
Stop Loss & Risk Management
Stop Loss: A standard institutional stop loss is placed just beyond the Slow Trend Line (the outer edge of the cloud). If price closes beyond the Slow Trend, the macro thesis is invalid.
Take Profit: Target liquidity pools or use a trailing stop based on the Fast Trend line.
Settings Overview
Mode Selection: Toggle between Auto-Adaptive logic or Manual control.
Manual Configuration: Define the specific Timeframe, Length, and Type (EMA, SMA, WMA) for both Fast and Slow trends.
Signal Logic: Toggle "Show Pullback Signals" on/off. Switch between "First Breakout" or "All Signals."
Quality Filters: Toggle individual filters (ATR, RSI, ADX) to adjust sensitivity. Turning these off makes the script more responsive but increases false signals.
Visual Style: Customize colors for Bullish, Bearish, and Neutral (Gray) states. Adjust cloud transparency.
Disclaimer
Risk Warning: Trading financial markets involves a high degree of risk and is not suitable for all investors. You could lose some or all of your initial investment.
Educational Use Only: This script and the information provided herein are for educational and informational purposes only. They do not constitute financial advice, investment advice, trading advice, or any other recommendation.
No Guarantee: Past performance of any trading system or methodology is not necessarily indicative of future results. The "Institutional Trend" indicator is a tool to assist in technical analysis, not a crystal ball. The creators of this script assume no responsibility or liability for any trading losses or damages incurred as a result of using this tool. Always perform your own due diligence and consult with a qualified financial advisor before making investment decisions.

Multi-TF EMA(20) — JcsatasiyaOverview
This indicator plots 7 multi-timeframe EMA(20) lines on any chart and displays a clean dynamic label for each EMA showing:
Full timeframe name (Yearly, Half-Yearly, Quarterly, Monthly, Weekly, etc.)
EMA(20) value formatted with exactly 2 decimals
A label that is positioned automatically to the right of the latest candle
White text for maximum readability
Color-coded lines for each timeframe
All EMA lines extend horizontally and update in real-time when new candles form on the selected timeframes.
✅ Key Features
• 7 Custom Timeframes
Choose any timeframe for each EMA (Yearly, 6-Month, 3-Month, Monthly, Weekly, Daily, 4H, etc.)
• Horizontal EMA Levels
Each EMA is drawn as a fixed horizontal level, making structure and bias easier to analyze.
• Dynamic Label Placement
Labels automatically position:
Horizontally: Left, Middle, or Right of the right-side future area
Vertically: Above, Middle, or Below the EMA line
• Clean Readable Labels
Always white text
Shows: EMA (20) – Timeframe Price: 123.45
Price always displays with 2 decimals
Label style auto-adjusts based on position
• Color Customization
Each timeframe EMA has its own color picker.
• All EMA Thickness Unified
Set one line thickness for all EMA lines.
• Reliable Multi-TF Accuracy
Uses request.security() with proper lookahead handling.
⭐ Why This Indicator Is Useful
This tool makes it extremely easy to visualize where your chart sits relative to major multi-timeframe EMA levels.
You immediately see:
Higher-timeframe trend direction
Bias zones
Key support/resistance EMA levels
Long-term vs short-term trend alignment
Price interaction with institutional EMAs
Perfect for day traders, swing traders, and position traders.
📘 HOW TO USE
1️⃣ Add to Chart
After adding the indicator, open the Settings → Inputs panel.
2️⃣ Choose the 7 Timeframes
For each slot, select your desired timeframe (example setup):
Yearly
Half Yearly
Quarterly
Monthly
Weekly
Daily
4H
3️⃣ Customize Colors
Pick a different color for each EMA for clarity.
4️⃣ Choose Label Placement
Use the label position controls:
Vertical: Upper / Middle / Below
Horizontal: Left / Middle / Right (relative to right-side future space)
5️⃣ Adjust Line Thickness (Optional)
A single slider controls the thickness of all 7 EMAs.
📝 NOTES
The indicator places labels 2–50 bars into the future depending on chosen position.
Labels are always visible and readable due to white text.
EMA values always show exactly two decimals, even for crypto, indices, and forex.
Works on any market and any chart timeframe.
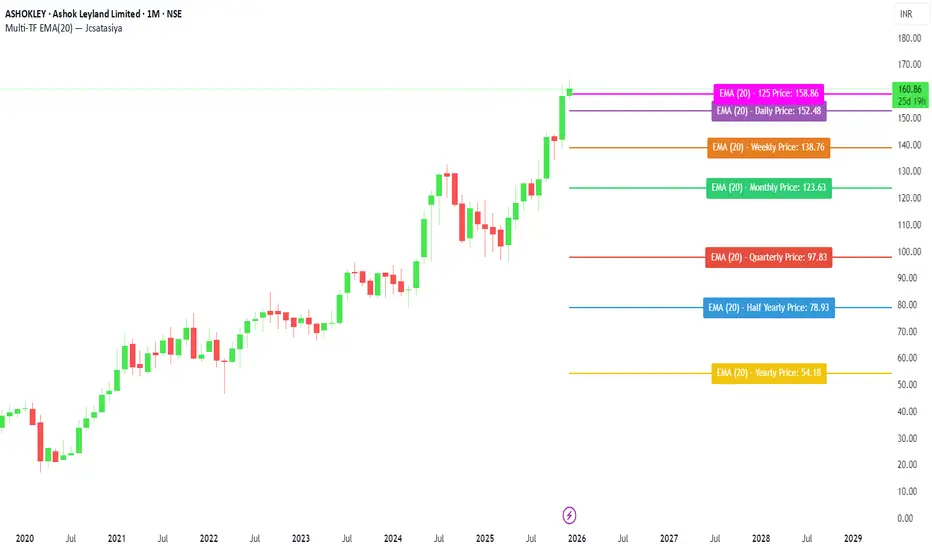
TMT Support & Resistance - Hitesh NimjeTMT Support & Resistance - HiteshNimje Indicator
Overview
The TMT Support & Resistance indicator is a professional pivot point analysis tool that automatically calculates and displays key support and resistance levels across multiple timeframe perspectives. It offers various pivot point calculation methods and provides customizable visual elements for comprehensive technical analysis.
Key Features
Pivot Point Calculation Methods
1. Traditional Pivot Points
Standard pivot point calculation using Previous Period High, Low, and Close
Creates P, S1, S2, S3, R1, R2, R3 levels
Most widely used method for day trading and swing trading
2. Fibonacci Pivot Points
Incorporates Fibonacci retracement levels (38.2%, 61.8%)
Uses traditional pivot as base with Fibonacci extensions
Popular among traders following Fibonacci analysis
3. Woodie Pivot Points
Alternative calculation method with different weighting
Emphasizes opening price in calculations
Preferred by some intraday traders
4. Classic Pivot Points
Similar to traditional but with different level calculations
Balanced approach to support/resistance identification
Timeframe Options
* Auto: Automatically selects optimal timeframe based on chart timeframe
Intraday ≤15min → Daily
Intraday >15min → Weekly
Daily → Monthly
* Fixed Timeframes: Daily, Weekly, Monthly, Quarterly, Yearly
* Extended Periods: Biyearly, Triyearly, Quinquennially, Decennially
Level Management System
Support Levels (Blue Colored)
* TMT Support 1 (S1): First major support level
* TMT Support 2 (S2): Second support level
* TMT Support 3 (S3): Third support level
* TMT Support 4 (S4): Fourth support level (Traditional/Camarilla only)
* TMT Support 5 (S5): Fifth support level (Traditional/Camarilla only)
Resistance Levels (Black Colored)
* TMT Resistance 1 (R1): First major resistance level
* TMT Resistance 2 (R2): Second resistance level
* TMT Resistance 3 (R3): Third resistance level
* TMT Resistance 4 (R4): Fourth resistance level (Traditional/Camarilla only)
* TMT Resistance 5 (R5): Fifth resistance level (Traditional/Camarilla only)
Central Pivot (Orange Colored)
* Pivot Point (P): Central price level used for S/R calculations
Customization Options
Display Settings
* Show Labels: Toggle pivot level identification labels
* Show Prices: Display actual price values next to levels
* Labels Position: Choose between Left or Right positioning
* Line Width: Adjustable thickness (1-100 pixels) for all pivot lines
Data Source Options
* Use Daily-based Values:
ON: Uses official daily OHLC values for calculations
OFF: Uses intraday data with extended hours consideration
* Number of Pivots Back: Historical pivot display (1-200 levels)
Color Customization
* Individual color selection for each support/resistance level
* Default colors: Supports (Blue), Resistances (Black), Pivot (Orange)
* Full color picker integration for all levels
Technical Features
Smart Display Logic
* Intraday Charts: Automatically uses daily-based calculations when intraday data is insufficient
* Multi-timeframe Compatibility: Adapts to chart timeframe and pivot timeframe differences
* Extended Hours Handling: Incorporates extended trading hours when enabled on chart
Dynamic Level Management
* Real-time Updates: Levels update as new data becomes available
* Historical Tracking: Maintains configurable number of historical pivot periods
* Automatic Cleanup: Removes old pivot graphics when limit is exceeded
Visual Elements
* Time-based Lines: Lines extend across full time periods for clear visual reference
* Price Labels: Contextual information showing level names and prices
* Professional Styling: Clean, professional appearance suitable for any trading style
Use Cases
Day Trading Applications
* Session Management: Use daily pivots for intraday trading decisions
* Range Trading: Camarilla levels excellent for range-bound strategies
* Breakout Confirmation: Use pivot breaks as entry/exit signals
Swing Trading Applications
* Weekly/Monthly Pivots: Identify key levels for multi-day positions
* Trend Analysis: Track how price interacts with higher timeframe pivots
* Risk Management: Set stop-losses and take-profits at pivot levels
Long-term Trading Applications
* Quarterly/Yearly Pivots: Major institutional levels for position trading
* Support/Resistance Maps: Create comprehensive price level roadmap
* Market Structure Analysis: Understand price behavior around key levels
Benefits for Traders
Professional Analysis
* Multiple Methodologies: Choose pivot calculation that matches trading style
* Timeframe Flexibility: Analyze from multiple temporal perspectives
* Historical Context: See how price has historically responded to pivot levels
Risk Management
* Level Identification: Clear visual reference for stop-loss placement
* Position Sizing: Use pivot distances for risk/reward calculations
* Entry Timing: Identify optimal entry points near support/resistance
Market Understanding
* Psychological Levels: Understand where market participants react
* Volume Confirmation: Cross-reference pivot levels with volume data
* Trend Continuation: Identify pivot levels that may continue or reverse trends
Technical Specifications
* Pine Script Version: 6
* Overlay: True (displays on price chart)
* Performance: Optimized for up to 200 historical pivot periods
* Compatibility: All trading instruments and timeframes
* Data Source: OHLC-based pivot calculations with security function integration
Trading Strategy Integration
1. Support/Resistance Trading: Enter trades at S1/R1 with stops beyond S2/R2
2. Pivot Bounce Strategy: Trade bounces from established pivot levels
3. Range Trading: Use Camarilla pivots for tight range strategies
4. Breakout Strategy: Enter breakouts with confirmation from pivot breaks
5. Multiple Timeframe Analysis: Combine daily, weekly, and monthly pivots for comprehensive analysis
This indicator serves as a comprehensive support and resistance analysis tool, providing traders with institutional-quality pivot point analysis across multiple calculation methods and timeframes. It combines professional-grade pivot point calculations with intuitive customization options, making it suitable for traders of all experience levels and trading styles.
TRADING DISCLAIMER
RISK WARNING
Trading involves substantial risk of loss and is not suitable for all investors. Past performance is not indicative of future results. You should carefully consider whether trading is suitable for you in light of your circumstances, knowledge, and financial resources.
NO FINANCIAL ADVICE
This indicator is provided for educational and informational purposes only. It does not constitute:
* Financial advice or investment recommendations
* Buy/sell signals or trading signals
* Professional investment advice
* Legal, tax, or accounting guidance
LIMITATIONS AND DISCLAIMERS
Technical Analysis Limitations
* Pivot points are mathematical calculations based on historical price data
* No guarantee of accuracy of price levels or calculations
* Markets can and do behave irrationally for extended periods
* Past performance does not guarantee future results
* Technical analysis should be used in conjunction with fundamental analysis
Data and Calculation Disclaimers
* Calculations are based on available price data at the time of calculation
* Data quality and availability may affect accuracy
* Pivot levels may differ when calculated on different timeframes
* Gaps and irregular market conditions may cause level failures
* Extended hours trading may affect intraday pivot calculations
Market Risks
* Extreme market volatility can invalidate all technical levels
* News events, economic announcements, and market manipulation can cause gaps
* Liquidity issues may prevent execution at calculated levels
* Currency fluctuations, inflation, and interest rate changes affect all levels
* Black swan events and market crashes cannot be predicted by technical analysis
USER RESPONSIBILITIES
Due Diligence
* You are solely responsible for your trading decisions
* Conduct your own research before using this indicator
* Verify calculations with multiple sources before trading
* Consider multiple timeframes and confirm levels with other technical tools
* Never rely solely on one indicator for trading decisions
Risk Management
* Always use proper risk management and position sizing
* Set appropriate stop-losses for all positions
* Never risk more than you can afford to lose
* Consider the inherent risks of leverage and margin trading
* Diversify your portfolio and trading strategies
Professional Consultation
* Consult with qualified financial advisors before trading
* Consider your tax obligations and legal requirements
* Understand the regulations in your jurisdiction
* Seek professional advice for complex trading strategies
LIMITATION OF LIABILITY
Indemnification
The creator and distributor of this indicator shall not be liable for:
* Any trading losses, whether direct or indirect
* Inaccurate or delayed price data
* System failures or technical malfunctions
* Loss of data or profits
* Interruption of service or connectivity issues
No Warranty
This indicator is provided "as is" without warranties of any kind:
* No guarantee of accuracy or completeness
* No warranty of uninterrupted or error-free operation
* No warranty of merchantability or fitness for a particular purpose
* The software may contain bugs or errors
Maximum Liability
In no event shall the liability exceed the purchase price (if any) paid for this indicator. This limitation applies regardless of the theory of liability, whether contract, tort, negligence, or otherwise.
REGULATORY COMPLIANCE
Jurisdiction-Specific Risks
* Regulations vary by country and region
* Some jurisdictions prohibit or restrict certain trading strategies
* Tax implications differ based on your location and trading frequency
* Commodity futures and options trading may have additional requirements
* Currency trading may be regulated differently than stock trading
Professional Trading
* If you are a professional trader, ensure compliance with all applicable regulations
* Adhere to fiduciary duties and best execution requirements
* Maintain required records and reporting
* Follow market abuse regulations and insider trading laws
TECHNICAL SPECIFICATIONS
Data Sources
* Calculations based on TradingView data feeds
* Data accuracy depends on broker and exchange reporting
* Historical data may be subject to adjustments and corrections
* Real-time data may have delays depending on data providers
Software Limitations
* Internet connectivity required for proper operation
* Software updates may change calculations or functionality
* TradingView platform dependencies may affect performance
* Third-party integrations may introduce additional risks
MONEY MANAGEMENT RECOMMENDATIONS
Conservative Approach
* Risk only 1-2% of capital per trade
* Use position sizing based on volatility
* Maintain adequate cash reserves
* Avoid over-leveraging accounts
Portfolio Management
* Diversify across multiple strategies
* Don't put all capital into one approach
* Regularly review and adjust trading strategies
* Maintain detailed trading records
FINAL LEGAL NOTICES
Acceptance of Terms
* By using this indicator, you acknowledge that you have read and understood this disclaimer
* You agree to assume all risks associated with trading
* You confirm that you are legally permitted to trade in your jurisdiction
Updates and Changes
* This disclaimer may be updated without notice
* Continued use constitutes acceptance of any changes
* It is your responsibility to stay informed of updates
Governing Law
* This disclaimer shall be governed by the laws of the jurisdiction where the indicator was created
* Any disputes shall be resolved in the appropriate courts
* Severability clause: If any part of this disclaimer is invalid, the remainder remains enforceable
REMEMBER: THERE ARE NO GUARANTEES IN TRADING. THE MAJORITY OF RETAIL TRADERS LOSE MONEY. TRADE AT YOUR OWN RISK.
Contact Information:
* Creator: Hitesh_Nimje
* Phone: Contact@8087192915
* Source: Thought Magic Trading
© HiteshNimje - All Rights Reserved
This disclaimer should be prominently displayed whenever the indicator is shared, sold, or distributed to ensure users are fully aware of the risks and limitations involved in trading.

STRAT Private Beta v2.0 – OPTIMIZED (FROZEN)Name: STRAT Private Beta v2.0 – OPTIMIZED (FROZEN)
Timeframe: Weekly only (runs every Friday after US close)
What it does in one sentence:
Scans 200+ liquid stocks, ETFs, indices, and cryptos every Friday night and instantly shows only the highest-conviction STRAT weekly setups that pass Rob Smith’s exact rules (true 2-2 continuations + Rev Strats, FTC ≥ 80 %, no broadening, no earnings weeks, 3:1 minimum R:R).
What you see every Friday after 4 pm ET:
0–12 tickers (usually 4–8) with a big green “L” (long) or red “S” (short)
Exact entry, stop, and 3R target printed on the chart and in alerts
FTC percentage (80–100 %) so you know conviction level
Nothing else – if there’s no clean setup, it stays silent
How to use it (testers only):
Click the invite link → add script to TradingView
Open the regular Stock Screener → select watchlist “STRAT Universe”
Load saved layout “STRAT Weekly Live” (or add the 4 columns)
Every Friday after close: refresh → see the short list → place 1 % risk bracket orders → done until next Friday.
Zero daily monitoring. Zero discretion. Pure frozen STRAT rules.
