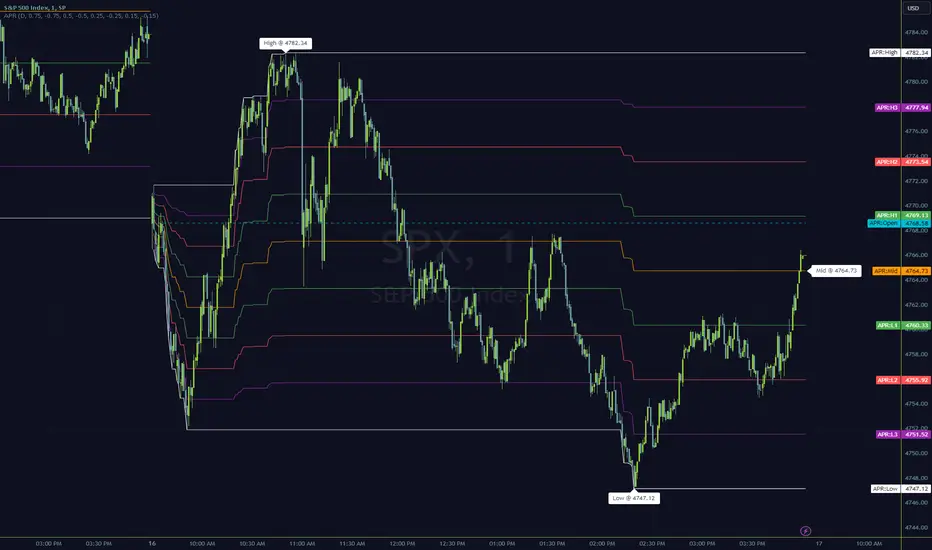
Anchored Progressive RangeIntroducing a simple script based off of the idea that ranges form from a point of origin that can be measured and produce interesting analysis indicating potential opportunities.
Specifically I use this on daily and weekly anchorage to find mid range retracements once range has developed.
Configure internal multipliers to provide potentially useful measurements between range high and mid point, as well as mid point and range low. By default it's standard .25 based multipliers but one could adjust to fib multipliers such as .615, .65, etc.
Anchored open price is plotted as continuous line as often times reversals will occur and open price will be tested on daily, weekly, monthly timeframes.
Once a bit of range is established and there's a rapid adjustment of range mid up or down, these can signal interesting breakouts. Also areas where the range stays flat due to no new high or low being printed can be indicative of consolidation, etc.
I've tested this with heikin ashi, renko, bars, line and regular candles through various markets such as futures, etfs and stocks and everything appears to anchor correctly, please feedback if experiencing otherwise.
I hope you enjoy this indicator as much as I enjoyed creating it, happy trading!
Cerca negli script per "weekly"
Short Interest Tracker [SS]This is a simple indicator that is designed to provide you with a synopsis of short interest on the daily, weekly and monthly timeframes.
How it works:
It pulls FINRA ticker data on short volume for whichever ticker you are on. It works with all tickers provided they are listed on FINRA (which is all tickers).
It will not work with futures, for futures, you would want to use a COT-based indicator, but for indices and equities, this indicator will provide you with the short volume information.
What it shows:
It breaks short volume down into current short volume, the 14-period SMA of short volume over the day, week and month, it also provides you with a short volume to SMA ratio. This is Short Volume divided by the SMA. Anything below 1 is good, it means short interest is low. Anything above 1 is not good, it means that short volume is above the SMA.
It also will show you the weekly, daily and monthly short volume change.
And last but not least, it will tell you whether short interest is falling, rising or steady. How it does this is by tracking whether the SMA is increasing, decreasing or stagnant.
Customization:
You can customize the SMA length and the assessment of whether short volume is increasing or decreasing. The default SMA length is 14 and the default assessment of rising/falling short volume is 4. This means, short volume has to rise or fall over a 4-period timeframe for it to register. So on the week, if it displays short volume increasing, it means that, over the past 4 weeks, the sma has steadily risen. Inverse if it decreases. If you want it to be more sensitive, you can reduce it to 2 or 3. If you want it to be more strict, you can increase it to 5 or 6.
NOTE:
If the volume information for a ticker is not available, it will return a runtime error indicating as such.
And that's the indicator!
I wanted something similar to COT data for equities and indices, so this was my attempt to bridge that gap.
Hope you enjoy and find it useful! Leave your suggestions below.
Take care everyone!

PB wTF50What kind of traders/investors are we?
We are trend followers, always on the lookout for the next big move in the market. Our scripts are meticulously crafted for higher timeframes (daily, weekly, monthly) aiming to capture the large market trends.
What does this script do?
The Pb wTF50 script simplifies the complex world of investing by colour-coding bars to indicate the trend direction. Green bars signify a bullish trend, red indicates a bearish trend, and a combination of both signifies a sideways market. This visual representation ensures investors can quickly gauge the market's direction and act accordingly.
How is the PB wTF50 produced?
The PB wTF50 script employs the simple moving averages (SMAs) as its backbone. Bars positioned above both the SMAs turn green, indicating a bullish trend. Conversely, bars below these SMAs turn red, signalling a bearish trend.
What is the best timeframe to use the script?
The PB wTF50 script is designed for the weekly timeframe. This ensures that traders and investors are aligned with the long-term market trend, filtering out the noise of shorter timeframes.
What makes this script unique?
The challenges of identifying the onset, progression, and culmination of trends are well-known in the investing community. The PbF script addresses these challenges head-on.
The PB wTF50 is not a lagging indicator. It is aligned with price movement, which helps investors and traders focus on what the asset’s price is doing. The asset’s price is the primary indicator of its direction.
Lagging indicators can be used alongside the PB wTF50 to confirm the asset’s direction.
The PBwTF50 continues to remain green during extended periods of bullish pullbacks and red during extended periods of bearish pullbacks. This helps investors and traders hold positions during corrections in the market.
When interacting with OB/OS zones, investors and traders are positioned to align with the trend and ignore short-term fluctuations against the trend.
The PB wTF50 can be used to enter additional positions, also known as compounding, when an asset’s price has pulled back into an OS zone, but the trend filter has remained green in a bull trend/OB zone, but the trend filter has remained red in a bear trend.
In essence, the PB wTF50 script is a trend filter that gives investors and traders the ability to apply discretion with the start and end of long-term trends as they develop.

Supertrend Advance Pullback StrategyHandbook for the Supertrend Advance Strategy
1. Introduction
Purpose of the Handbook:
The main purpose of this handbook is to serve as a comprehensive guide for traders and investors who are looking to explore and harness the potential of the Supertrend Advance Strategy. In the rapidly changing financial market, having the right tools and strategies at one's disposal is crucial. Whether you're a beginner hoping to dive into the world of trading or a seasoned investor aiming to optimize and diversify your portfolio, this handbook offers the insights and methodologies you need. By the end of this guide, readers should have a clear understanding of how the Supertrend Advance Strategy works, its benefits, potential pitfalls, and practical application in various trading scenarios.
Overview of the Supertrend Advance Pullback Strategy:
At its core, the Supertrend Advance Strategy is an evolution of the popular Supertrend Indicator. Designed to generate buy and sell signals in trending markets, the Supertrend Indicator has been a favorite tool for many traders around the world. The Advance Strategy, however, builds upon this foundation by introducing enhanced mechanisms, filters, and methodologies to increase precision and reduce false signals.
1. Basic Concept:
The Supertrend Advance Strategy relies on a combination of price action and volatility to determine the potential trend direction. By assessing the average true range (ATR) in conjunction with specific price points, this strategy aims to highlight the potential starting and ending points of market trends.
2. Methodology:
Unlike the traditional Supertrend Indicator, which primarily focuses on closing prices and ATR, the Advance Strategy integrates other critical market variables, such as volume, momentum oscillators, and perhaps even fundamental data, to validate its signals. This multidimensional approach ensures that the generated signals are more reliable and are less prone to market noise.
3. Benefits:
One of the main benefits of the Supertrend Advance Strategy is its ability to filter out false breakouts and minor price fluctuations, which can often lead to premature exits or entries in the market. By waiting for a confluence of factors to align, traders using this advanced strategy can increase their chances of entering or exiting trades at optimal points.
4. Practical Applications:
The Supertrend Advance Strategy can be applied across various timeframes, from intraday trading to swing trading and even long-term investment scenarios. Furthermore, its flexible nature allows it to be tailored to different asset classes, be it stocks, commodities, forex, or cryptocurrencies.
In the subsequent sections of this handbook, we will delve deeper into the intricacies of this strategy, offering step-by-step guidelines on its application, case studies, and tips for maximizing its efficacy in the volatile world of trading.
As you journey through this handbook, we encourage you to approach the Supertrend Advance Strategy with an open mind, testing and tweaking it as per your personal trading style and risk appetite. The ultimate goal is not just to provide you with a new tool but to empower you with a holistic strategy that can enhance your trading endeavors.
2. Getting Started
Navigating the financial markets can be a daunting task without the right tools. This section is dedicated to helping you set up the Supertrend Advance Strategy on one of the most popular charting platforms, TradingView. By following the steps below, you'll be able to integrate this strategy into your charts and start leveraging its insights in no time.
Setting up on TradingView:
TradingView is a web-based platform that offers a wide range of charting tools, social networking, and market data. Before you can apply the Supertrend Advance Strategy, you'll first need a TradingView account. If you haven't set one up yet, here's how:
1. Account Creation:
• Visit TradingView's official website.
• Click on the "Join for free" or "Sign up" button.
• Follow the registration process, providing the necessary details and setting up your login credentials.
2. Navigating the Dashboard:
• Once logged in, you'll be taken to your dashboard. Here, you'll see a variety of tools, including watchlists, alerts, and the main charting window.
• To begin charting, type in the name or ticker of the asset you're interested in the search bar at the top.
3. Configuring Chart Settings:
• Before integrating the Supertrend Advance Strategy, familiarize yourself with the chart settings. This can be accessed by clicking the 'gear' icon on the top right of the chart window.
• Adjust the chart type, time intervals, and other display settings to your preference.
Integrating the Strategy into a Chart:
Now that you're set up on TradingView, it's time to integrate the Supertrend Advance Strategy.
1. Accessing the Pine Script Editor:
• Located at the top-center of your screen, you'll find the "Pine Editor" tab. Click on it.
• This is where custom strategies and indicators are scripted or imported.
2. Loading the Supertrend Advance Strategy Script:
• Depending on whether you have the script or need to find it, there are two paths:
• If you have the script: Copy the Supertrend Advance Strategy script, and then paste it into the Pine Editor.
• If searching for the script: Click on the “Indicators” icon (looks like a flame) at the top of your screen, and then type “Supertrend Advance Strategy” in the search bar. If available, it will show up in the list. Simply click to add it to your chart.
3. Applying the Strategy:
• After pasting or selecting the Supertrend Advance Strategy in the Pine Editor, click on the “Add to Chart” button located at the top of the editor. This will overlay the strategy onto your main chart window.
4. Configuring Strategy Settings:
• Once the strategy is on your chart, you'll notice a small settings ('gear') icon next to its name in the top-left of the chart window. Click on this to access settings.
• Here, you can adjust various parameters of the Supertrend Advance Strategy to better fit your trading style or the specific asset you're analyzing.
5. Interpreting Signals:
• With the strategy applied, you'll now see buy/sell signals represented on your chart. Take time to familiarize yourself with how these look and behave over various timeframes and market conditions.
3. Strategy Overview
What is the Supertrend Advance Strategy?
The Supertrend Advance Strategy is a refined version of the classic Supertrend Indicator, which was developed to aid traders in spotting market trends. The strategy utilizes a combination of data points, including average true range (ATR) and price momentum, to generate buy and sell signals.
In essence, the Supertrend Advance Strategy can be visualized as a line that moves with the price. When the price is above the Supertrend line, it indicates an uptrend and suggests a potential buy position. Conversely, when the price is below the Supertrend line, it hints at a downtrend, suggesting a potential selling point.
Strategy Goals and Objectives:
1. Trend Identification: At the core of the Supertrend Advance Strategy is the goal to efficiently and consistently identify prevailing market trends. By recognizing these trends, traders can position themselves to capitalize on price movements in their favor.
2. Reducing Noise: Financial markets are often inundated with 'noise' - short-term price fluctuations that can mislead traders. The Supertrend Advance Strategy aims to filter out this noise, allowing for clearer decision-making.
3. Enhancing Risk Management: With clear buy and sell signals, traders can set more precise stop-loss and take-profit points. This leads to better risk management and potentially improved profitability.
4. Versatility: While primarily used for trend identification, the strategy can be integrated with other technical tools and indicators to create a comprehensive trading system.
Type of Assets/Markets to Apply the Strategy:
1. Equities: The Supertrend Advance Strategy is highly popular among stock traders. Its ability to capture long-term trends makes it particularly useful for those trading individual stocks or equity indices.
2. Forex: Given the 24-hour nature of the Forex market and its propensity for trends, the Supertrend Advance Strategy is a valuable tool for currency traders.
3. Commodities: Whether it's gold, oil, or agricultural products, commodities often move in extended trends. The strategy can help in identifying and capitalizing on these movements.
4. Cryptocurrencies: The volatile nature of cryptocurrencies means they can have pronounced trends. The Supertrend Advance Strategy can aid crypto traders in navigating these often tumultuous waters.
5. Futures & Options: Traders and investors in derivative markets can utilize the strategy to make more informed decisions about contract entries and exits.
It's important to note that while the Supertrend Advance Strategy can be applied across various assets and markets, its effectiveness might vary based on market conditions, timeframe, and the specific characteristics of the asset in question. As always, it's recommended to use the strategy in conjunction with other analytical tools and to backtest its effectiveness in specific scenarios before committing to trades.
4. Input Settings
Understanding and correctly configuring input settings is crucial for optimizing the Supertrend Advance Strategy for any specific market or asset. These settings, when tweaked correctly, can drastically impact the strategy's performance.
Grouping Inputs:
Before diving into individual input settings, it's important to group similar inputs. Grouping can simplify the user interface, making it easier to adjust settings related to a specific function or indicator.
Strategy Choice:
This input allows traders to select from various strategies that incorporate the Supertrend indicator. Options might include "Supertrend with RSI," "Supertrend with MACD," etc. By choosing a strategy, the associated input settings for that strategy become available.
Supertrend Settings:
1. Multiplier: Typically, a default value of 3 is used. This multiplier is used in the ATR calculation. Increasing it makes the Supertrend line further from prices, while decreasing it brings the line closer.
2. Period: The number of bars used in the ATR calculation. A common default is 7.
EMA Settings (Exponential Moving Average):
1. Period: Defines the number of previous bars used to calculate the EMA. Common periods are 9, 21, 50, and 200.
2. Source: Allows traders to choose which price (Open, Close, High, Low) to use in the EMA calculation.
RSI Settings (Relative Strength Index):
1. Length: Determines how many periods are used for RSI calculation. The standard setting is 14.
2. Overbought Level: The threshold at which the asset is considered overbought, typically set at 70.
3. Oversold Level: The threshold at which the asset is considered oversold, often at 30.
MACD Settings (Moving Average Convergence Divergence):
1. Short Period: The shorter EMA, usually set to 12.
2. Long Period: The longer EMA, commonly set to 26.
3. Signal Period: Defines the EMA of the MACD line, typically set at 9.
CCI Settings (Commodity Channel Index):
1. Period: The number of bars used in the CCI calculation, often set to 20.
2. Overbought Level: Typically set at +100, denoting overbought conditions.
3. Oversold Level: Usually set at -100, indicating oversold conditions.
SL/TP Settings (Stop Loss/Take Profit):
1. SL Multiplier: Defines the multiplier for the average true range (ATR) to set the stop loss.
2. TP Multiplier: Defines the multiplier for the average true range (ATR) to set the take profit.
Filtering Conditions:
This section allows traders to set conditions to filter out certain signals. For example, one might only want to take buy signals when the RSI is below 30, ensuring they buy during oversold conditions.
Trade Direction and Backtest Period:
1. Trade Direction: Allows traders to specify whether they want to take long trades, short trades, or both.
2. Backtest Period: Specifies the time range for backtesting the strategy. Traders can choose from options like 'Last 6 months,' 'Last 1 year,' etc.
It's essential to remember that while default settings are provided for many of these tools, optimal settings can vary based on the market, timeframe, and trading style. Always backtest new settings on historical data to gauge their potential efficacy.
5. Understanding Strategy Conditions
Developing an understanding of the conditions set within a trading strategy is essential for traders to maximize its potential. Here, we delve deep into the logic behind these conditions, using the Supertrend Advance Strategy as our focal point.
Basic Logic Behind Conditions:
Every strategy is built around a set of conditions that provide buy or sell signals. The conditions are based on mathematical or statistical methods and are rooted in the study of historical price data. The fundamental idea is to recognize patterns or behaviors that have been profitable in the past and might be profitable in the future.
Buy and Sell Conditions:
1. Buy Conditions: Usually formulated around bullish signals or indicators suggesting upward price momentum.
2. Sell Conditions: Centered on bearish signals or indicators indicating downward price momentum.
Simple Strategy:
The simple strategy could involve using just the Supertrend indicator. Here:
• Buy: When price closes above the Supertrend line.
• Sell: When price closes below the Supertrend line.
Pullback Strategy:
This strategy capitalizes on price retracements:
• Buy: When the price retraces to the Supertrend line after a bullish signal and is supported by another bullish indicator.
• Sell: When the price retraces to the Supertrend line after a bearish signal and is confirmed by another bearish indicator.
Indicators Used:
EMA (Exponential Moving Average):
• Logic: EMA gives more weight to recent prices, making it more responsive to current price movements. A shorter-period EMA crossing above a longer-period EMA can be a bullish sign, while the opposite is bearish.
RSI (Relative Strength Index):
• Logic: RSI measures the magnitude of recent price changes to analyze overbought or oversold conditions. Values above 70 are typically considered overbought, and values below 30 are considered oversold.
MACD (Moving Average Convergence Divergence):
• Logic: MACD assesses the relationship between two EMAs of a security’s price. The MACD line crossing above the signal line can be a bullish signal, while crossing below can be bearish.
CCI (Commodity Channel Index):
• Logic: CCI compares a security's average price change with its average price variation. A CCI value above +100 may mean the price is overbought, while below -100 might signify an oversold condition.
And others...
As the strategy expands or contracts, more indicators might be added or removed. The crucial point is to understand the core logic behind each, ensuring they align with the strategy's objectives.
Logic Behind Each Indicator:
1. EMA: Emphasizes recent price movements; provides dynamic support and resistance levels.
2. RSI: Indicates overbought and oversold conditions based on recent price changes.
3. MACD: Showcases momentum and direction of a trend by comparing two EMAs.
4. CCI: Measures the difference between a security's price change and its average price change.
Understanding strategy conditions is not just about knowing when to buy or sell but also about comprehending the underlying market dynamics that those conditions represent. As you familiarize yourself with each condition and indicator, you'll be better prepared to adapt and evolve with the ever-changing financial markets.
6. Trade Execution and Management
Trade execution and management are crucial aspects of any trading strategy. Efficient execution can significantly impact profitability, while effective management can preserve capital during adverse market conditions. In this section, we'll explore the nuances of position entry, exit strategies, and various Stop Loss (SL) and Take Profit (TP) methodologies within the Supertrend Advance Strategy.
Position Entry:
Effective trade entry revolves around:
1. Timing: Enter at a point where the risk-reward ratio is favorable. This often corresponds to confirmatory signals from multiple indicators.
2. Volume Analysis: Ensure there's adequate volume to support the movement. Volume can validate the strength of a signal.
3. Confirmation: Use multiple indicators or chart patterns to confirm the entry point. For instance, a buy signal from the Supertrend indicator can be confirmed with a bullish MACD crossover.
Position Exit Strategies:
A successful exit strategy will lock in profits and minimize losses. Here are some strategies:
1. Fixed Time Exit: Exiting after a predetermined period.
2. Percentage-based Profit Target: Exiting after a certain percentage gain.
3. Indicator-based Exit: Exiting when an indicator gives an opposing signal.
Percentage-based SL/TP:
• Stop Loss (SL): Set a fixed percentage below the entry price to limit potential losses.
• Example: A 2% SL on an entry at $100 would trigger a sell at $98.
• Take Profit (TP): Set a fixed percentage above the entry price to lock in gains.
• Example: A 5% TP on an entry at $100 would trigger a sell at $105.
Supertrend-based SL/TP:
• Stop Loss (SL): Position the SL at the Supertrend line. If the price breaches this line, it could indicate a trend reversal.
• Take Profit (TP): One could set the TP at a point where the Supertrend line flattens or turns, indicating a possible slowdown in momentum.
Swing high/low-based SL/TP:
• Stop Loss (SL): For a long position, set the SL just below the recent swing low. For a short position, set it just above the recent swing high.
• Take Profit (TP): For a long position, set the TP near a recent swing high or resistance. For a short position, near a swing low or support.
And other methods...
1. Trailing Stop Loss: This dynamic SL adjusts with the price movement, locking in profits as the trade moves in your favor.
2. Multiple Take Profits: Divide the position into segments and set multiple TP levels, securing profits in stages.
3. Opposite Signal Exit: Exit when another reliable indicator gives an opposite signal.
Trade execution and management are as much an art as they are a science. They require a blend of analytical skill, discipline, and intuition. Regularly reviewing and refining your strategies, especially in light of changing market conditions, is crucial to maintaining consistent trading performance.
7. Visual Representations
Visual tools are essential for traders, as they simplify complex data into an easily interpretable format. Properly analyzing and understanding the plots on a chart can provide actionable insights and a more intuitive grasp of market conditions. In this section, we’ll delve into various visual representations used in the Supertrend Advance Strategy and their significance.
Understanding Plots on the Chart:
Charts are the primary visual aids for traders. The arrangement of data points, lines, and colors on them tell a story about the market's past, present, and potential future moves.
1. Data Points: These represent individual price actions over a specific timeframe. For instance, a daily chart will have data points showing the opening, closing, high, and low prices for each day.
2. Colors: Used to indicate the nature of price movement. Commonly, green is used for bullish (upward) moves and red for bearish (downward) moves.
Trend Lines:
Trend lines are straight lines drawn on a chart that connect a series of price points. Their significance:
1. Uptrend Line: Drawn along the lows, representing support. A break below might indicate a trend reversal.
2. Downtrend Line: Drawn along the highs, indicating resistance. A break above might suggest the start of a bullish trend.
Filled Areas:
These represent a range between two values on a chart, usually shaded or colored. For instance:
1. Bollinger Bands: The area between the upper and lower band is filled, giving a visual representation of volatility.
2. Volume Profile: Can show a filled area representing the amount of trading activity at different price levels.
Stop Loss and Take Profit Lines:
These are horizontal lines representing pre-determined exit points for trades.
1. Stop Loss Line: Indicates the level at which a trade will be automatically closed to limit losses. Positioned according to the trader's risk tolerance.
2. Take Profit Line: Denotes the target level to lock in profits. Set according to potential resistance (for long trades) or support (for short trades) or other technical factors.
Trailing Stop Lines:
A trailing stop is a dynamic form of stop loss that moves with the price. On a chart:
1. For Long Trades: Starts below the entry price and moves up with the price but remains static if the price falls, ensuring profits are locked in.
2. For Short Trades: Starts above the entry price and moves down with the price but remains static if the price rises.
Visual representations offer traders a clear, organized view of market dynamics. Familiarity with these tools ensures that traders can quickly and accurately interpret chart data, leading to more informed decision-making. Always ensure that the visual aids used resonate with your trading style and strategy for the best results.
8. Backtesting
Backtesting is a fundamental process in strategy development, enabling traders to evaluate the efficacy of their strategy using historical data. It provides a snapshot of how the strategy would have performed in past market conditions, offering insights into its potential strengths and vulnerabilities. In this section, we'll explore the intricacies of setting up and analyzing backtest results and the caveats one must be aware of.
Setting Up Backtest Period:
1. Duration: Determine the timeframe for the backtest. It should be long enough to capture various market conditions (bullish, bearish, sideways). For instance, if you're testing a daily strategy, consider a period of several years.
2. Data Quality: Ensure the data source is reliable, offering high-resolution and clean data. This is vital to get accurate backtest results.
3. Segmentation: Instead of a continuous period, sometimes it's helpful to backtest over distinct market phases, like a particular bear or bull market, to see how the strategy holds up in different environments.
Analyzing Backtest Results:
1. Performance Metrics: Examine metrics like the total return, annualized return, maximum drawdown, Sharpe ratio, and others to gauge the strategy's efficiency.
2. Win Rate: It's the ratio of winning trades to total trades. A high win rate doesn't always signify a good strategy; it should be evaluated in conjunction with other metrics.
3. Risk/Reward: Understand the average profit versus the average loss per trade. A strategy might have a low win rate but still be profitable if the average gain far exceeds the average loss.
4. Drawdown Analysis: Review the periods of losses the strategy could incur and how long it takes, on average, to recover.
9. Tips and Best Practices
Successful trading requires more than just knowing how a strategy works. It necessitates an understanding of when to apply it, how to adjust it to varying market conditions, and the wisdom to recognize and avoid common pitfalls. This section offers insightful tips and best practices to enhance the application of the Supertrend Advance Strategy.
When to Use the Strategy:
1. Market Conditions: Ideally, employ the Supertrend Advance Strategy during trending market conditions. This strategy thrives when there are clear upward or downward trends. It might be less effective during consolidative or sideways markets.
2. News Events: Be cautious around significant news events, as they can cause extreme volatility. It might be wise to avoid trading immediately before and after high-impact news.
3. Liquidity: Ensure you are trading in assets/markets with sufficient liquidity. High liquidity ensures that the price movements are more reflective of genuine market sentiment and not due to thin volume.
Adjusting Settings for Different Markets/Timeframes:
1. Markets: Each market (stocks, forex, commodities) has its own characteristics. It's essential to adjust the strategy's parameters to align with the market's volatility and liquidity.
2. Timeframes: Shorter timeframes (like 1-minute or 5-minute charts) tend to have more noise. You might need to adjust the settings to filter out false signals. Conversely, for longer timeframes (like daily or weekly charts), you might need to be more responsive to genuine trend changes.
3. Customization: Regularly review and tweak the strategy's settings. Periodic adjustments can ensure the strategy remains optimized for the current market conditions.
10. Frequently Asked Questions (FAQs)
Given the complexities and nuances of the Supertrend Advance Strategy, it's only natural for traders, both new and seasoned, to have questions. This section addresses some of the most commonly asked questions regarding the strategy.
1. What exactly is the Supertrend Advance Strategy?
The Supertrend Advance Strategy is an evolved version of the traditional Supertrend indicator. It's designed to provide clearer buy and sell signals by incorporating additional indicators like EMA, RSI, MACD, CCI, etc. The strategy aims to capitalize on market trends while minimizing false signals.
2. Can I use the Supertrend Advance Strategy for all asset types?
Yes, the strategy can be applied to various asset types like stocks, forex, commodities, and cryptocurrencies. However, it's crucial to adjust the settings accordingly to suit the specific characteristics and volatility of each asset type.
3. Is this strategy suitable for day trading?
Absolutely! The Supertrend Advance Strategy can be adjusted to suit various timeframes, making it versatile for both day trading and long-term trading. Remember to fine-tune the settings to align with the timeframe you're trading on.
4. How do I deal with false signals?
No strategy is immune to false signals. However, by combining the Supertrend with other indicators and adhering to strict risk management protocols, you can minimize the impact of false signals. Always use stop-loss orders and consider filtering trades with additional confirmation signals.
5. Do I need any prior trading experience to use this strategy?
While the Supertrend Advance Strategy is designed to be user-friendly, having a foundational understanding of trading and market analysis can greatly enhance your ability to employ the strategy effectively. If you're a beginner, consider pairing the strategy with further education and practice on demo accounts.
6. How often should I review and adjust the strategy settings?
There's no one-size-fits-all answer. Some traders adjust settings weekly, while others might do it monthly. The key is to remain responsive to changing market conditions. Regular backtesting can give insights into potential required adjustments.
7. Can the Supertrend Advance Strategy be automated?
Yes, many traders use algorithmic trading platforms to automate their strategies, including the Supertrend Advance Strategy. However, always monitor automated systems regularly to ensure they're operating as intended.
8. Are there any markets or conditions where the strategy shouldn't be used?
The strategy might generate more false signals in markets that are consolidative or range-bound. During significant news events or times of unexpected high volatility, it's advisable to tread with caution or stay out of the market.
9. How important is backtesting with this strategy?
Backtesting is crucial as it allows traders to understand how the strategy would have performed in the past, offering insights into potential profitability and areas of improvement. Always backtest any new setting or tweak before applying it to live trades.
10. What if the strategy isn't working for me?
No strategy guarantees consistent profits. If it's not working for you, consider reviewing your settings, seeking expert advice, or complementing the Supertrend Advance Strategy with other analysis methods. Remember, continuous learning and adaptation are the keys to trading success.
Other comments
Value of combining several indicators in this script and how they work together
Diversification of Signals: Just as diversifying an investment portfolio can reduce risk, using multiple indicators can offer varied perspectives on potential price movements. Each indicator can capture a different facet of the market, ensuring that traders are not overly reliant on a single data point.
Confirmation & Reduced False Signals: A common challenge with many indicators is the potential for false signals. By requiring confirmation from multiple indicators before acting, the chances of acting on a false signal can be significantly reduced.
Flexibility Across Market Conditions: Different indicators might perform better under different market conditions. For example, while moving averages might excel in trending markets, oscillators like RSI might be more useful during sideways or range-bound conditions. A mashup strategy can potentially adapt better to varying market scenarios.
Comprehensive Analysis: With multiple indicators, traders can gauge trend strength, momentum, volatility, and potential market reversals all at once, providing a holistic view of the market.
How do the different indicators in the Supertrend Advance Strategy work together?
Supertrend: This is primarily a trend-following indicator. It provides traders with buy and sell signals based on the volatility of the price. When combined with other indicators, it can filter out noise and give more weight to strong, confirmed trends.
EMA (Exponential Moving Average): EMA gives more weight to recent price data. It can be used to identify the direction and strength of a trend. When the price is above the EMA, it's generally considered bullish, and vice versa.
RSI (Relative Strength Index): An oscillator that measures the magnitude of recent price changes to evaluate overbought or oversold conditions. By cross-referencing with other indicators like EMA or MACD, traders can spot potential reversals or confirmations of a trend.
MACD (Moving Average Convergence Divergence): This indicator identifies changes in the strength, direction, momentum, and duration of a trend in a stock's price. When the MACD line crosses above the signal line, it can be a bullish sign, and when it crosses below, it can be bearish. Pairing MACD with Supertrend can provide dual confirmation of a trend.
CCI (Commodity Channel Index): Initially developed for commodities, CCI can indicate overbought or oversold conditions. It can be used in conjunction with other indicators to determine entry and exit points.
In essence, the synergy of these indicators provides a balanced, comprehensive approach to trading. Each indicator offers its unique lens into market conditions, and when they align, it can be a powerful indication of a trading opportunity. This combination not only reduces the potential drawbacks of each individual indicator but leverages their strengths, aiming for more consistent and informed trading decisions.
Backtesting and Default Settings
• This indicator has been optimized to be applied for 1 hour-charts. However, the underlying principles of this strategy are supply and demand in the financial markets and the strategy can be applied to all timeframes. Daytraders can use the 1min- or 5min charts, swing-traders can use the daily charts.
• This strategy has been designed to identify the most promising, highest probability entries and trades for each stock or other financial security.
• The combination of the qualifiers results in a highly selective strategy which only considers the most promising swing-trading entries. As a result, you will normally only find a low number of trades for each stock or other financial security per year in case you apply this strategy for the daily charts. Shorter timeframes will result in a higher number of trades / year.
• Consequently, traders need to apply this strategy for a full watchlist rather than just one financial security.
• Default properties: RSI on (length 14, RSI buy level 50, sell level 50), EMA, RSI, MACD on, type of strategy pullback, SL/TP type: ATR (length 10, factor 3), trade direction both, quantity 5, take profit swing hl 5.1, highest / lowest lookback 2, enable ATR trail (ATR length 10, SL ATR multiplier 1.4, TP multiplier 2.1, lookback = 4, trade direction = both).

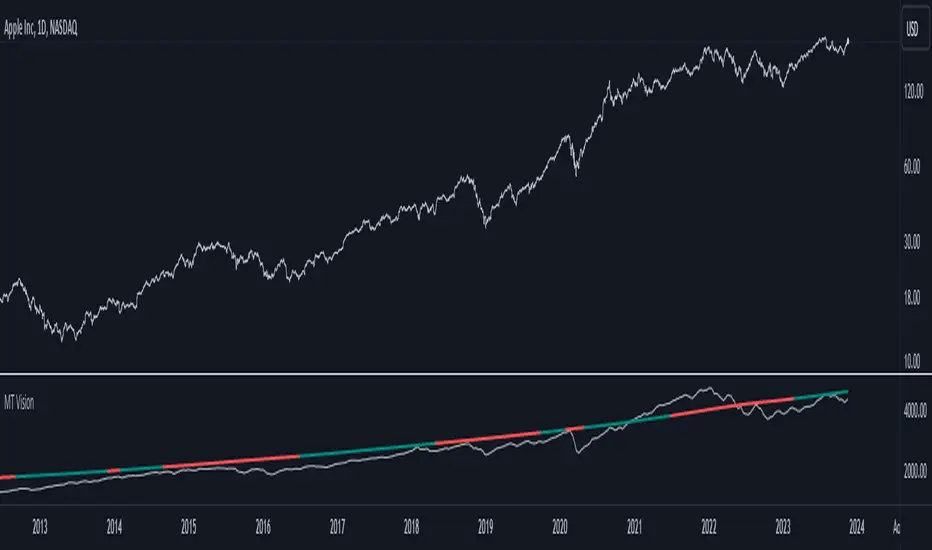
MacroTrend VisionThe "MacroTrend Vision" indicator is crafted with a singular goal – to provide traders with a quick and insightful snapshot of a country's global index. Seamlessly combining macroeconomic and technical perspectives, this tool is designed for those seeking a straightforward yet comprehensive overview. Let's explore the key features that make the "MacroTrend Vision" a valuable asset for traders looking to grasp both the big-picture economic context and technical nuances.
1. Long-Term Vision with Weekly Periods:
Gain a genuine long-term perspective with the ability to process 2500 weekly periods. This feature ensures a holistic understanding of global indices from both macroeconomic and technical viewpoints.
2. Composite Leading Indicator (CLI) Conditions:
Integrate both macroeconomic trends and technical signals through Composite Leading Indicator (CLI) conditions derived from the Relative Strength Index (RSI), offering a comprehensive outlook for informed decision-making.
3. Deviation Bands for Volatility Analysis:
Refine market analysis with strategically integrated deviation bands (0.2 and 0.4) based on smoothed linear regression. Anticipate volatility and potential trend shifts, aligning macro and technical insights.
4. Logarithmic Scale Transformation:
Enhance precision in understanding price movements with a logarithmic scale transformation, especially beneficial for assets with exponential growth patterns.
5. Separated Window for Easy Navigation:
Streamline your analysis with a user-friendly design – a separated window allowing easy navigation through different symbols without altering indicator settings.
6. Alert System for CLI Conditions:
Stay informed about critical shifts with an alert system for both long and close conditions based on the RSI of the CLI. Even during periods of limited chart monitoring, this feature keeps you connected to macroeconomic and technical changes.
In essence, the "MacroTrend Vision" is your go-to tool for a balanced view, simplifying the complexities of global indices with a blend of macroeconomic insights and technical clarity.
TASC 2023.12 Growth and Value Switching System█ OVERVIEW
This script implements a rotation system for trading value and growth ETFs, as developed by Markos Katsanos and detailed in the article titled 'Growth Or Value?' in TASC's December 2023 edition of Traders' Tips . The purpose of this script is to demonstrate how short-term momentum can be employed to track market trends and provide clarity on when to switch between value and growth.
█ CONCEPTS
The central concept of the presented rotation strategy is based on the observation that the stock market undergoes cycles favoring either growth or value stocks. Consequently, the script introduces a momentum trading system that is designed to switch between value and growth equities based on prevailing market conditions. Specifically tailored for long-term index investors, the system focuses on trading Vanguard's value and growth ETFs ( VTV and VUG ) on a weekly timeframe.
To identify the ETF likely to outperform, the script uses a custom relative strength indicator applied to both VTV and VUG in comparison with an index ( SPY ). To minimize risk and drawdowns during bear markets, when both value and growth experience downtrends, the script employs the author's custom volume flow indicator (VFI) and blocks trades when its reading indicates money outflow . Positions are closed if the relative strength of the current open trade ETF falls below that of the other ETF for two consecutive weeks and is also below its moving average. Additionally, the script implements a stop-loss when the ETF is trading below its 40-week moving average, but only during bear markets.
The script plots the relative strengths of the value and growth equities along with the signals triggered by the aforementioned rules. Information about the current readings of the relative strength and volume flow indicators, along with the current open position, is displayed in a table.
█ CALCULATIONS
The script uses the request.security() function to gather price data for both equities and the reference index. Custom relative strength and volume flow indicators are calculated based on the formulas presented in the original article. By default, the script employs the same parameters for these indicators as proposed in the original article for VTV and VUG on a weekly timeframe.

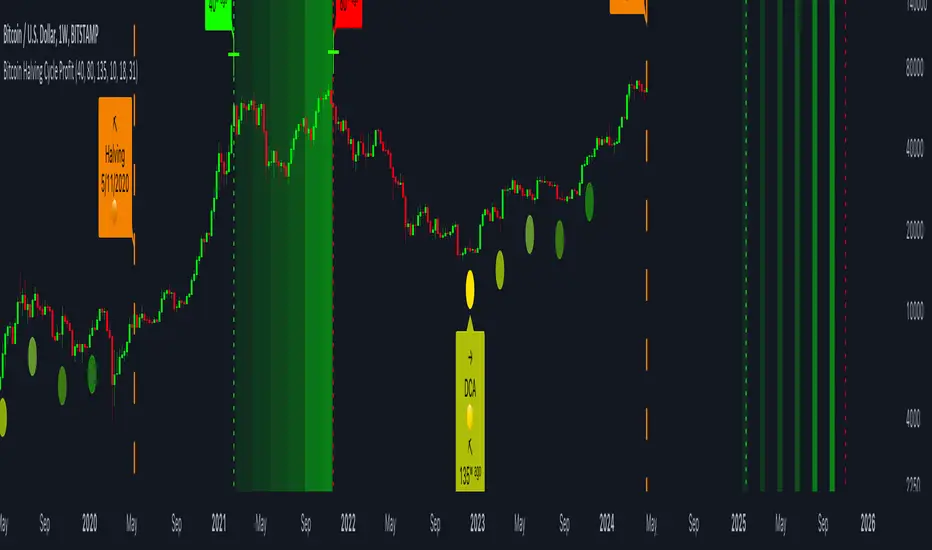
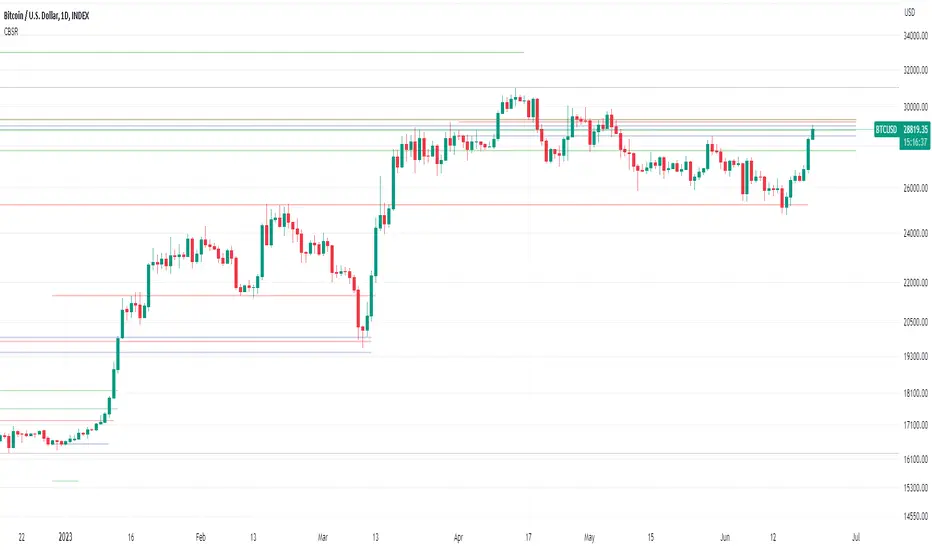
Bitcoin Halving Cycle ProfitThe Bitcoin Halving Cycle Profit indicator, developed by Kevin Svenson , unveils a consistent and predetermined profit-taking cycle triggered by each Bitcoin halving event. This indicator streamlines the analysis of halving occurrences, providing explicit signals for both profit-taking and Dollar-Cost Averaging strategies.
Following each Bitcoin halving event, a fixed number of weeks consistently mark the period of maximum profitability for profit-taking:
🔄 Halving Cycle Profit Timeline Explained:
• 40 Weeks (Post-Halving) = Start of the optimal profit-taking zone.
• 80 Weeks (Post-Halving) = "Last Call" for profit-taking before the onset of a bear market.
• 125 Weeks (Post-Halving) = The optimal timeframe to begin Dollar-Cost Averaging.
(Bitcoin Weekly Chart using Halving Cycle Profit)
One standout feature of this indicator is its inherent clarity and comprehensive labeling. This quality makes it exceptionally easy to discern the locations of key factors and turning points, enhancing your understanding of the market dynamics it highlights.
(Bitcoin Daily Chart using Halving Cycle Profit)
🚀 This indicator doesn't limit its effectiveness to just Bitcoin; it seamlessly integrates with top blue-chip altcoins like Ethereum and most household names in the crypto industry.
( Ethereum Weekly Chart using Halving Cycle Profit)
🛠️ Customizable display options are availible. Users have the flexibility to toggle/adjust labels, lines, and color fills according to their preferences.
📑 In summary, the Bitcoin Halving Cycle Profit indicator is a versatile and user-friendly tool, offering clarity and customization for traders navigating both Bitcoin and top altcoins.
⚠️ It's important to note that while the Bitcoin Halving Cycle Profit indicator provides historical insights, past performance does not guarantee future results. Timing profitability in the cryptocurrency market involves inherent risks, and this indicator should not be construed as financial advice. Users are encouraged to exercise caution, conduct thorough research, and make informed decisions based on their individual risk tolerance and financial goals.
Yearly and 12-Week Percentage Difference with EMAThe indicator "Yearly and 12-Week Percentage Difference with EMA" is designed to display the annual and 12-week difference in the percentage variability of asset prices, as well as their exponential moving averages (EMA) on the TradingView chart.
EMA Period (EMA Period): This is a configurable parameter that allows you to select a period for calculating the EMA.
Yearly % Difference (Annual percentage difference): This indicator shows the percentage difference between the current price and the asset price a year ago on weekly bars. The graph is displayed in blue.
12-Week % Difference (12 weeks difference as a percentage): This indicator shows the percentage difference between the current price and the asset price 12 weeks ago on weekly bars. The graph is displayed in green.
Zero Line (Zero Line): This black line on the chart shows the zero level.
EMA of Yearly % Difference (EMA of annual percentage difference): This line represents the exponential moving average (EMA) of the annual percentage difference. The graph is displayed in red.
EMA of 12-Week % Difference (EMA of the difference over 12 weeks as a percentage): This line represents the exponential moving average (EMA) of the difference over 12 weeks as a percentage. The graph is displayed in orange.
Use this indicator to analyze the percentage variability of asset prices on an annual and 12-week basis, as well as to track their EMA, which can help in making trading decisions.
Русская версия \\\\\
Индикатор "Разница в процентах за год и за 12 недель с EMA" предназначен для отображения цены от год к году, и за 12 недель процентной изменчивости цен актива, а также их экспоненциальных скользящих средних (EMA) на графике TradingView.
- EMA Period (Период EMA): Это настраиваемый параметр, который позволяет выбрать период для расчета EMA.
- Yearly % Difference (Годовая разница в процентах): Этот индикатор показывает процентную разницу между текущей ценой и ценой актива год назад на недельных барах. График отображается синим цветом.
- 12-Week % Difference (Разница за 12 недель в процентах): Этот индикатор показывает процентную разницу между текущей ценой и ценой актива 12 недель назад на недельных барах. График отображается зеленым цветом.
- Zero Line (Линия нуля): Эта черная линия на графике показывает нулевой уровень.
- EMA of Yearly % Difference (EMA годовой разницы в процентах): Эта линия представляет собой экспоненциальное скользящее среднее (EMA) годовой разницы в процентах. График отображается красным цветом.
- EMA of 12-Week % Difference (EMA разницы за 12 недель в процентах): Эта линия представляет собой экспоненциальное скользящее среднее (EMA) разницы за 12 недель в процентах. График отображается оранжевым цветом.
Используйте этот индикатор для анализа процентной изменчивости цен актива на годовой и 12-недельной основе, а также для отслеживания их EMA, что может помочь в принятии торговых решений.

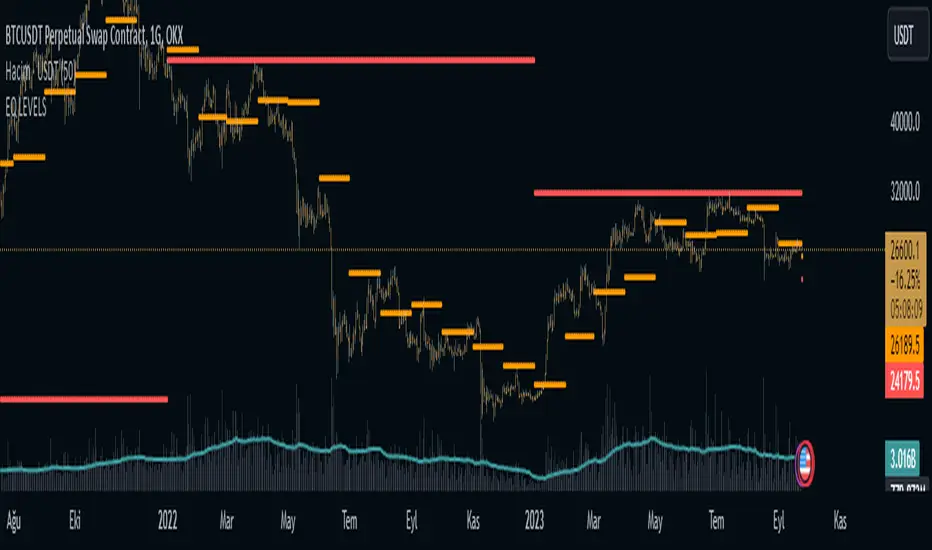
EQ LEVELS / EquilibriumWhat is it, How to use it, How to adjust the settings? What Calculates EQ Level?
What is it?
EQ, Equilibrium, In the money market, the term "equilibrium" or "equilibrium" refers to the point at which supply and demand are equalised. At this point, money supply and money demand meet each other and interest rates stabilise at a certain level. Equilibrium in the money market reflects the overall financial balance in the economy
According to What Calculates the EQ Level?
Normally, there may be many different alternatives to this, but I have printed the result on the screen by adding the highest and lowest levels of the prices and averaging them to think of a simple solution.
How to use it?
I have added 4 timeframes for both long-term investors and traders to use. If you want to use which timeframe, you can select the timeframe you want from the settings and see it on the chart. For those who want to trade, my suggestion is to follow the daily eq levels and of course look at the weekly eq levels. The weekly eq level can give you an idea of what kind of price range the next day may be in.
How to Make Settings?
When you first add the indicator to the chart, it draws a line. You change it to a circle or plus in the settings, it will look like the picture I shared. I also share open source code and can make changes in the code.
Nedir?, Nasıl Kullanılır?, Ayarları Nasıl Yapılır? EQ Seviyesini Neye Göre Hesaplar?
Nedir?:
EQ yani Equilibrium, Para piyasasında "denge" veya "equilibrium" terimi, arz ve talebin eşitlendiği noktayı ifade eder. Bu noktada, para arzı ile para talebi birbirini karşılar ve faiz oranları belirli bir seviyede dengelenir. Para piyasasındaki denge, ekonomideki genel finansal dengeyi yansıtır
EQ Seviyesini Neye Göre Hesaplar?
Normalde bunun farlı bir çok alternatifi olabilir ama ben biraz basit bir çözüm düşünmek için fiyatların en yüksek ve en düşük seviyelerini toplayarak ve ortalamasını alarak çıka sonucu ekrana yazdırdım.
Nasıl Kullanılır?
Hem uzun vadeli yatırım yapanlar hem de trade yapanların kullanabilmesi için 4 zaman dilimi ekledim. Hangi zaman dilimini kullanmak istiyorsanız ayarlardan istediniz zaman dilimini seçip onu grafikte görebilirsiniz. Trade yapmak isteyenler için önerim günlük eq seviyelerini takip etmeleri ve tabiki haftalık eq seviyelerine bakın. Haftalık eq seviyesi size bir sonra ki günün nasıl bir fiyat aralığı içerisinde olabileceği konusunda fikir verebilir.
Ayarları Nasıl Yapılır?
Grafiğe indikatörü ilk eklediğiniz de çizgi çizdirir. Siz ayarlardan onu daire veya artı olarak değiştirin benim paylaştığım resimde ki gibi görünecektir. Ayrıca açık kaynak kodlu paylaşıyorum isteyen kod içerisinde değişiklikler yapabilir.
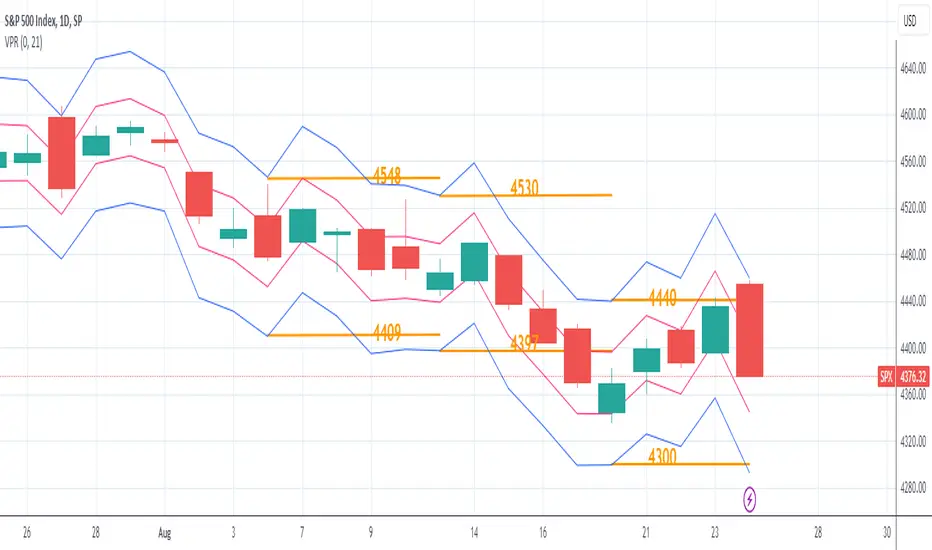
Volatility Price RangeThe Volatility Price Range is an overlay which estimates a price range for the next seven days and next day, based on historical volatility (already available in TradingView). The upper and lower bands are calculated as follows:
The Volatility for one week is calculated using the formula: WV = HV * √t where:
WV: one-week volatility
HV: annual volatility
√: square root
t: the time factor expressed in years
From this formula we can deduce the weekly volatility WV = HV * √(1 / 52) = HV / 7.2 where 52: weeks in a year.
The daily volatility DV = HV * √(1 / 365) = HV / 19.1 where 365: days in a year.
To calculate the lower and upper value of the bands, the weekly/daily volatility value obtained will be subtracted/added from/to the current price.
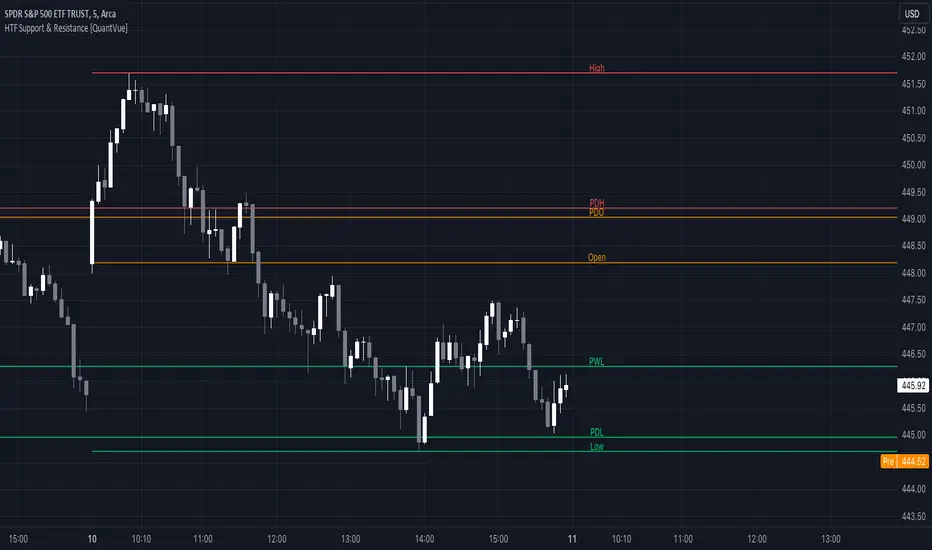
HTF Support & Resistance [QuantVue]The "HTF Support / Resistance" indicator highlights critical price levels across multiple timeframes helping you recognize major support/resistance areas.
Whether you're a day trader needing to understand the current day's price action, or a long-term investor looking to analyze yearly trends, this indicator can be a valuable addition to your trading toolkit.
The daily levels, which can be enabled or disabled according to your preference, will give you insights into the open, high, and low levels for the current and previous day.
Similarly, weekly levels provide information for the current and previous weeks, while monthly levels cover the current and previous months.
In addition, the indicator offers more extended views through its quarterly and yearly levels. These will help you understand long-term trends and major support/resistance areas, and they can be particularly beneficial for major support/resistance levels.
Features:
🔹Visualization: View support and resistance levels from Daily, Weekly, Monthly, Quarterly, and Yearly timeframes.
🔹Customizable Appearance: Tailor the display colors and line styles for each level according to your preferences.
🔹Clear Labeling: Each level is clearly labeled for quick identification.
🔹Extension Option: Opt to extend the support and resistance lines across the chart for better visualization.
Give this indicator a BOOST and COMMENT your thoughts!
We hope you enjoy.
Cheers.
Average Range LinesThis Average Range Lines indicator identifies high and low price levels based on a chosen time period (day, week, month, etc.) and then uses a simple moving average over the length of the lookback period chosen to project support and resistance levels, otherwise referred to as average range. The calculation of these levels are slightly different than Average True Range and I have found this to be more accurate for intraday price bounces.
Lines are plotted and labeled on the chart based on the following methodology:
+3.0: 3x the average high over the chosen timeframe and lookback period.
+2.5: 2.5x the average high over the chosen timeframe and lookback period.
+2.0: 2x the average high over the chosen timeframe and lookback period.
+1.5: 1.5x the average high over the chosen timeframe and lookback period.
+1.0: The average high over the chosen timeframe and lookback period.
+0.5: One-half the average high over the chosen timeframe and lookback period.
Open: Opening price for the chosen time period.
-0.5: One-half the average low over the chosen timeframe and lookback period.
-1.0: The average low over the chosen timeframe and lookback period.
-1.5: 1.5x the average low over the chosen timeframe and lookback period.
-2.0: 2x the average low over the chosen timeframe and lookback period.
-2.5: 2.5x the average low over the chosen timeframe and lookback period.
-3.0: 3x the average low over the chosen timeframe and lookback period.
Look for price to find support or resistance at these levels for either entries or to take profit. When price crosses the +/- 2.0 or beyond, the likelihood of a reversal is very high, especially if set to weekly and monthly levels.
This indicator can be used/viewed on any timeframe. For intraday trading and viewing on a 15 minute or less timeframe, I recommend using the 4 hour, 1 day, and/or 1 week levels. For swing trading and viewing on a 30 minute or higher timeframe, I recommend using the 1 week, 1 month, or longer timeframes. I don’t believe this would be useful on a 1 hour or less timeframe, but let me know if the comments if you find otherwise.
Based on my testing, recommended lookback periods by timeframe include:
Timeframe: 4 hour; Lookback period: 60 (recommend viewing on a 5 minute or less timeframe)
Timeframe: 1 day; Lookback period: 10 (also check out 25 if your chart doesn’t show good support/resistance at 10 days lookback – I have found 25 to be useful on charts like SPX)
Timeframe: 1 week; Lookback period: 14
Timeframe: 1 month; Lookback period: 10
The line style and colors are all editable. You can apply a global coloring scheme in the event you want to add this indicator to your chart multiple times with different time frames like I do for the weekly and monthly.
I appreciate your comments/feedback on this indicator to improve. Also let me know if you find this useful, and what settings/ticker you find it works best with!
Also check out my profile for more indicators!

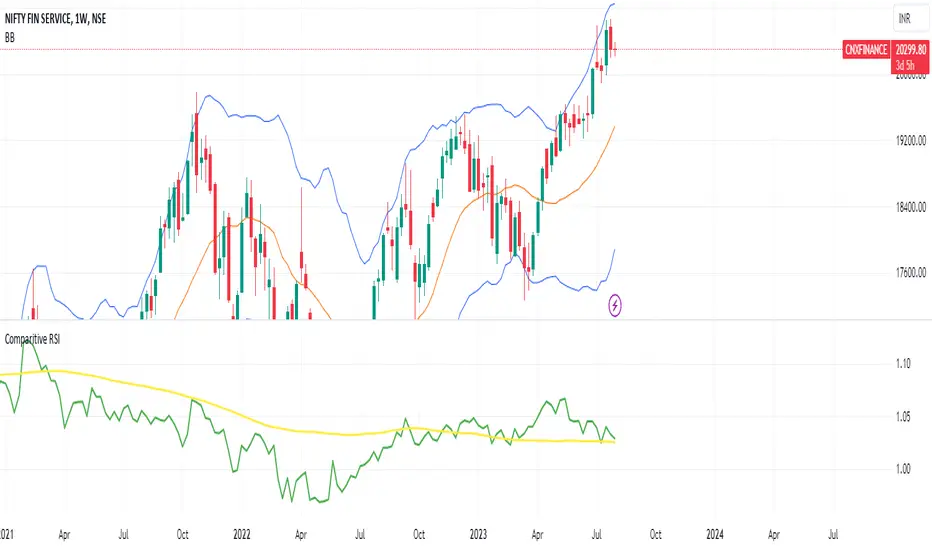
Comparative Relative StrengthIn Comparative RSI We need to Use weekly timeframe
Comparative Symbol should be Nifty and CRS moving average 100.
If the Moving avg is above the 100 period Comparative Symbol that means the stock is outperforming benchmark indices and can make position in that stock and hold till it goes below Comparative Symbol on weekly basis
HTF Candle Support & Resistance «NoaTrader»This script uses higher timeframe candle's High, Low & Close as a source for drawing a line representing potential Supports and Resistances.
The more lines you see on a level, probably the more important that level is.
The script has a single input for setting the source candle's timeframe, so it can be used on any timeframe with the proper settings. For example, higher timeframes like weekly and monthly can use "3M" or "12M" settings, Daily timeframes with "W", or even lower timeframes like minutes and seconds with "240" and "60" (M means monthly candle, W is weekly, and numbers are for minutes.)
As you can see on the code:
Red lines represent candle's High.
Green lines represent candle's Low.
Blue lines represent candle's Close.
Give it a try on different timeframes with different settings to see interesting gaps between lines!
Farzan Paid CaliburnFarzan Paid Caliburn is used to identify trends and smoothen out price fluctuations. It was derived from the candlestick charting techniques, and it is based on open, high, low and close prices from the previous session
The Farzan Paid Caliburn indicator is plotted as a candlestick chart with a series of Blue and Black candles. The Blue candles indicate an uptrend while Black candles indicate a downtrend.
The Farzan Paid Caliburn indicator is a trend-following indicator that helps traders identify the direction of the current market trend.
To use this Farzan Paid Caliburn indicator you need to follow these steps :-
*1.Open the chart of a particular stock you want to trade.
*2.Fix the time interval of 10 minutes for the intraday trading. For that, you can use Tradingview charts.
*3.Insert the Farzan Paid Caliburn as your indicator.
The Farzan Paid Caliburn is shown under the main chart and their plots indicate the current trend. Farzan Paid Caliburn indicator can be used with varying periods (daily, weekly, intraday etc.) and on varying instruments (stocks, futures or forex) .
My personal preference is to use the Indicator on Weekly chart for best result.

Directional Volume EStimate from Price Action (RedK D_VESPA)The "Directional Volume EStimate from Price Action (RedK D_VESPA)" is another weapon for the VPA (Volume Price Analysis) enthusiasts and traders who like to include volume-based insights & signals to their trading. The basic concept is to estimate the sell and buy split of the traded volume by extrapolating the price action represented by the shape of the associated price bar. We then create and plot an average of these "estimated buy & sell volumes" - the estimated average Net Volume is the balance between these 2 averages.
D_VESPA uses clear visualizations to represent the outcomes in a less distracting and more actionable way.
How does D_VESPA work?
-------------------------------------
The key assumption is that when price moves up, this is caused by "buy" volume (or increasing demand), and when the price moves down, this is due to "selling" volume (or increasing supply). Important to note that we are making our Buy/sell volume estimates here based on the shape of the price bar, and not looking into lower time frame volume data - This is a different approach and is still aligned to the key concepts of VPA.
Originally this work started as an improvement to my Supply/Demand Volume Viewer (V.Viewer) , I ended up re-writing the whole thing after some more research and work on VPA, to improve the estimation, visualization and usability / tradability.
Think of D_VESPA as the "Pro" version of V.Viewer -- and please go back and review the details of V.Viewer as the root concepts are the same so I won't repeat them here (as it comes to exploring Balance Zone and finding Price Convergence/Divergence)
Main Features of D_VESPA
--------------------------------------
- Update Supply/Demand calculation to include 2-bar gaps (improved algo)
- Add multiple options for the moving average (MA type) for the calculation - my preference is to use WMA
- Add option to show Net Volume as 3-color bars
- Visual simplification and improvements to be less distracting & more actionable
- added options to display/hide main visuals while maintaining the status line consistency (Avg Supply, Avg Demand, Avg Net)
- add alerts for NetVol moving into Buy (crosses 0 up) or Sell (crosses 0 down) modes - or swing from one mode to the other
(there are actually 2 sets of alerts, one set for the main NetVol plot, and the other for the secondary TF NetVol - give user more options on how to utilize D_VESPA)
Quick techie piece, how does the estimated buy/sell volume algo work ?
------------------------------------------------------------------------------------------
* per our assumption, buy volume is associated with price up-moves, sell volume is associated with price down-moves
* so each of the bulls and bears will get the equivalent of the top & bottom wicks,
* for up bars, bulls get the value of the "body", else the bears get the "body"
* open gaps are allocated to bulls or bears depending on the gap direction
The below sketch explains how D_VESPA estimates the Buy/Sell Volume split based on the bar shape (including gap) - the example shows a bullish bar with an opening gap up - but the concept is the same for a down-bar or a down-gap.
I kept both the "Volume Weighted" and "2-bar Gap Impact" as options in the indicator settings - these 2 options should be always kept selected. They are there for those who would like to experiment with the difference these changes have on the buy/sell estimation. The indicator will handle cases where there is no volume data for the selected symbol, and in that case, it will simply reflect Average Estimated Bull/Bear ratio of the price bar
The Secondary TF Est Average Net Volume:
---------------------------------------------------------
I added the ability to plot the Estimate Average Net Volume for a secondary timeframe - options 1W, 1D, 1H, or Same as Chart.
- this feature provides traders the confidence to trade the lower timeframes in the same direction as the prevailing "market mode"
- this also adds more MTF support beyond the existing TradingView's built-in MTF support capability - experiment with various settings between exposing the indicator's secondary TF plot, and changing the TF option in the indicator settings.
Note on the secondary TF NetVol plot:
- the secondary TF needs to be set to same as or higher TF than the chart's TF - if not, a warning sign would show and the plot will not be enabled. for example, a day trader may set the secondary TF to 1Hr or 1Day, while looking at 5min or 15min chart. A swing/trend trader who frequently uses the daily chart may set the secondary TF to weekly, and so on..
- the secondary TF NetVol plot is hidden by default and needs to be exposed thru the indicator settings.
the below chart shows D_VESPA on a the same (daily) chart, but with secondary TF plot for the weekly TF enabled
Final Thoughts
-------------------
* RedK D_VESPA is a volume indicator, that estimates buy/sell and net volume averages based on the price action reflected by the shape of the price bars - this can provide more insight on volume compared to the classic volume/VolAverage indicator and assist traders in exploring the market mode (buyers/sellers - bullish/bearish) and align trades to it.
* Because D_VESPA is a volume indicator, it can't be used alone to generate a trading signal - and needs to be combined with other indicators that analysis price value (range), momentum and trend. I recommend to at least combine D_VESPA with a variant of MACD and RSI to get a full view of the price action relative to the prevailing market and the broader trend.
* I found it very useful to take note and "read" how the Est Buy vs Est Sell lines move .. they sort of "tell a story" - experiment with this on your various chart and note the levels of estimate avg demand vs estimate avg supply that this indicator exposes for some very valuable insight about how the chart action is progressing. Please feel free to share feedback below.
