Daily & Weekly ConfluenceDaily & Weekly Confluence is a precision momentum-alignment indicator built on Stochastic RSI, designed to highlight high-probability bullish conditions when lower-timeframe momentum aligns with higher-timeframe structure. It combines live Stoch RSI signals with a forward-shifted momentum path and a robust daily/weekly confirmation system to help traders anticipate and confirm trend transitions with clarity and discipline.
Why this indicator matters
Momentum signals are most effective when they agree across timeframes. Daily & Weekly Confluence filters noise by requiring alignment between daily and weekly Stoch RSI behavior, allowing traders to focus on setups that occur within a supportive higher-timeframe context rather than reacting to isolated signals.
What the indicator shows
1. Live Stochastic RSI (%K / %D)
The indicator plots real-time Stoch RSI values for the active chart timeframe, including standard overbought and oversold reference levels. These lines represent current momentum conditions and form the basis for all signal logic.
2. Forward-shifted Stoch RSI path
A user-defined Stoch RSI pattern window is sampled from the past and drawn forward on the chart. This path visually maps how momentum previously evolved and where similar momentum behavior may re-emerge. Optional normalization keeps the path scaled to recent conditions for consistent visual interpretation.
3. Momentum cross visualization
When %K and %D intersect within the forward-shifted path, the indicator can display:
Color-cycling vertical reference lines
Small directional arrows at the crossing point
A single highlighted label marking the next upcoming cross
These visuals are designed to keep attention on momentum inflection zones, not clutter.
Multi-timeframe signal logic
Weekly signals
The indicator independently computes weekly Stoch RSI values and detects:
Confirmed bullish crosses
Near-cross conditions based on distance and slope
Daily signals
Daily bullish crosses and near-cross conditions are detected using the same logic but on the daily timeframe.
Weekly context filter (optional)
Daily signals can be restricted so they only trigger when weekly momentum is already bullish or has recently turned bullish. This alignment filter significantly reduces counter-trend signals.
Dual confirmation
When daily and weekly bullish crosses occur together, the indicator flags a high-confidence confluence event.
Alerts built for real trading
Preconfigured alert conditions include:
Weekly bullish confirmed
Weekly bullish near-cross
Daily bullish confirmed
Daily bullish near-cross
Daily signals with weekly confirmation required
Dual daily + weekly confirmation
Alerts can be configured to trigger only on confirmed bar closes for cleaner execution timing.
How to use it effectively
Use weekly signals to define directional bias
Use daily signals for timing within that bias
Treat “near-cross” alerts as early warnings, not entries
Give the highest weight to dual confirmed alignment events
This indicator is best suited for swing traders, position traders, and systematic momentum strategies that prioritize structure, confirmation, and discipline over reactive entries.
Cerca negli script per "weekly"

Master Accumulation Weekly Buy SignalsMaster Accumulation Weekly Buy Signals
The Master Accumulation Weekly Buy Signals indicator is designed to help traders identify potential buy opportunities based on the accumulation and distribution of volume, with a primary focus on weekly timeframes. This indicator combines the On Balance Volume (OBV) and the Accumulation/Distribution (AD) indicators to generate buy signals when both metrics show a decline.
Key Features:
Percentage Change Calculation: Calculates the percentage change in OBV and AD over a specified length tailored to weekly timeframes.
Timeframe Adaptability: While optimized for weekly timeframes, the indicator can also adjust to daily and monthly charts.
Volume Validation: Ensures that volume data is available and valid for accurate calculations.
Buy Signals: Generates buy signals when both OBV and AD percentage changes are negative, indicating potential accumulation by informed traders.
Visual Alerts: Plots buy signal triangles below the price bars on the main chart for easy identification.
How It Works:
On Balance Volume (OBV): Tracks the cumulative volume, considering the direction of price changes, and calculates the percentage change over the specified period, primarily for weekly analysis.
Accumulation/Distribution (AD): Measures the flow of volume into or out of a security, considering the relationship between the closing price and the high-low range, and calculates the percentage change over the specified period, primarily for weekly analysis.
Buy Signal Generation: A buy signal is generated when both OBV and AD show a negative percentage change, suggesting a potential buying opportunity.
How to Use:
Apply the indicator to your chart and select the weekly timeframe for optimal performance.
Look for buy signal triangles that appear below the price bars on the main chart.
Use the buy signals as part of your broader trading strategy, confirming them with other technical analysis tools and indicators.
Important Note:
This indicator is a tool to assist in identifying potential buy signals based on volume accumulation patterns. It is primarily designed for weekly timeframes and should not be used as a standalone trading strategy. Always perform comprehensive analysis and consider risk management practices before making any trading decisions.
This description highlights the indicator's primary focus on weekly timeframes while providing comprehensive information about its features and usage.
THIS IS TEST ONLY*******

RD Key Levels (Weekly, Daily, Previous vWAP)The RexDog Key Levels indicator plots the weekly open, daily open, and the previous day vWAP close.
These are all critical price levels (zones) to know when trading any market or instrument. These areas are also high probability reaction areas that you can trade using simple confirmation trading patterns.
First, I'll cover an overview of the indicator then I'll share general usage tips.
Weekly Open - default is white/orange. White is when price is above the weekly open. Orange is when price is below the weekly open.
Weekly High/Low - there are options to turn on the weekly high and lows. Default plot is circles. Green is the high. Red is the low.
Daily Open - default is green/red. Green is when price is above the daily open. Red is when price is below the daily open.
Previous vWAPs - aqua single lines. These are the closing price of the daily vWAPs.
Top Indicators - The triangles at the top of the chart signify is price is currently above or below the weekly open. This is helpful on lower timeframe charts (5m, 15m) to get a quick indication when price is far extended beyond the weekly open. Green triangle = above weekly open. Red triangle = below weekly open.
General Usage
Each one of these levels are important levels markets look use for continuation or failure of momentum and bias. I also find it extremely helpful to think of these levels as magnets, dual magnets. They both attract and repel price at the same time. Now you might say, how is that helpful to have opposing views at the same time? Be indifferent to direction, create your own rules on when these price zones repel or attract price, I have my own.
Here's the easiest way to use these price levels.
As price approaches one of these levels to expect a reaction. A reaction is price is going in one direction and price hits a price level zone and reacts in the opposite direction.
These are price zones, sometimes you will see a reaction right at the price but visualize these areas as zones of reaction.
A high percentage of the time when price approaches these level zones there will be a reaction. So trade the reaction .
How do you do that?
Simple. Trade patterns that repeat. I have 3 solid patterns I trade around these key levels:
The first pattern is early entry with precise scale in rules and a very effective protective stop loss placement.
The second pattern is wait for confirmation that the level holds. This requires more patience and for you to fully trust the chart. The benefit of this pattern is with confirmation you have even more precise stop placement.
There is a bonus third pattern I trade around these levels. I call this the confirmation and bluff entry. It's a combination of both of the patterns above. You wait for confirmation but on any pull back you call the bluff on the market and enter on key test. Trade management here is critical. In addition to the pattern you trade you should have a series of failure patterns that tell you to get out of the trade, I use 2 primary failure patterns.
I trade all markets, same system, same rules, so I'll show a few examples.
Usually I start with Bitcoin but let's start with equities:
BA - Boeing - 8 Trades
Here we see weekly low patterns, previous week low test, vwAP hold patterns, day magnets and day holding. Then 2 week failures and a double hold pattern.
These are all straightforward trades to execute following really simple patterns.
BTCUSD Previous vWAP and Day Open Trades
We see here on the circle areas both daily open and previous day vWAP zone tests. Within this chart are all 3 highly effective patterns I trade.
SPY - 7 High Probability Trades
Here we see a pDay vWAP mixed with a daily failure. Next a daily retest, then a pDay vWAP failure, then a vWAP capture and test. Then a double weekly failure test (great trade there) and finally a daily test.
I could provide more examples but most are just derivatives of the above examples.

Multi-Timeframe Levels (Daily & Weekly)// ═══════════════════════════════════════════════════════════════════════════════
// 📊 MULTI-TIMEFRAME LEVELS INDICATOR
// ═══════════════════════════════════════════════════════════════════════════════
//
// ┌─────────────────────────────────────────────────────────────────────────────┐
// │ 🎯 LEVEL COLORS & MEANING │
// ├─────────────────────────────────────────────────────────────────────────────┤
// │ 🟡 YELLOW (PDH/PDL) = Previous Day High/Low - PRIMARY intraday S/R │
// │ 🟣 PURPLE (PD2H/PD2L) = 2 Days Ago High/Low - SECONDARY confluence │
// │ 🔴 RED (PWH/PWL) = Previous Week High/Low - MAJOR swing levels │
// └─────────────────────────────────────────────────────────────────────────────┘
//
// ═══════════════════════════════════════════════════════════════════════════════
// ⚡ SCALPING STRATEGY (1-5 min charts)
// ═══════════════════════════════════════════════════════════════════════════════
//
// 📍 ENTRY ZONES:
// • Look for price entering 🟡 YELLOW zones (PDH/PDL)
// • Best setups: Price rejects from zone with strong candle pattern
// • Extra confirmation: Zone overlaps with 🟣 PURPLE (confluence)
//
// ✅ BUY SCALP:
// 1. Price touches PDL zone (yellow) from above
// 2. Wait for bullish rejection candle (hammer, engulfing)
// 3. Enter long with stop below the zone
// 4. Target: Mid-range or PDH zone
//
// ❌ SELL SCALP:
// 1. Price touches PDH zone (yellow) from below
// 2. Wait for bearish rejection candle (shooting star, engulfing)
// 3. Enter short with stop above the zone
// 4. Target: Mid-range or PDL zone
//
// 💡 SCALP TIPS:
// • Avoid trading THROUGH zones - wait for rejection
// • Tighter stops when trading during high volume (9:30-11:00 AM)
// • Skip setups if price is choppy inside the zone
//
// ═══════════════════════════════════════════════════════════════════════════════
// 📈 SWING TRADING STRATEGY (15min - Daily charts)
// ═══════════════════════════════════════════════════════════════════════════════
//
// 📍 HIGH PROBABILITY ZONES:
// • 🔴 RED zones (PWH/PWL) = Primary swing entries
// • Best setups: 🔴 RED + 🟡 YELLOW confluence (weekly + daily align)
// • Monster setups: All 3 colors stack at same price area
//
// ✅ SWING LONG:
// 1. Price drops into PWL zone (red) - weekly support
// 2. Bonus: PDL (yellow) is nearby = confluence
// 3. Wait for daily/4H bullish reversal pattern
// 4. Enter with stop below the zone cluster
// 5. Target: PWH or next major resistance
//
// ❌ SWING SHORT:
// 1. Price rallies into PWH zone (red) - weekly resistance
// 2. Bonus: PDH (yellow) is nearby = confluence
// 3. Wait for daily/4H bearish reversal pattern
// 4. Enter with stop above the zone cluster
// 5. Target: PWL or next major support
//
// 💡 SWING TIPS:
// • Weekly levels (red) have highest reversal probability
// • More confluence = higher win rate, use larger position
// • Let winners run when breaking through weekly levels
//
// ═══════════════════════════════════════════════════════════════════════════════
// 🚀 BREAKOUT STRATEGY
// ═══════════════════════════════════════════════════════════════════════════════
//
// 📍 BREAKOUT SIGNALS:
// • Price closes ABOVE PDH/PWH with volume = Bullish breakout
// • Price closes BELOW PDL/PWL with volume = Bearish breakout
//
// ✅ TRADING BREAKOUTS:
// 1. Wait for candle CLOSE beyond the level (not just wick)
// 2. Volume should be above average
// 3. Enter on retest of broken level (now becomes support/resistance)
// 4. Stop: Below/above the breakout candle
//
// ⚠️ AVOID FALSE BREAKOUTS:
// • Don't chase - wait for pullback to broken level
// • Skip if breakout happens on low volume
// • Be cautious of breakouts into higher timeframe zones
//
// ═══════════════════════════════════════════════════════════════════════════════
// 📋 QUICK REFERENCE
// ═══════════════════════════════════════════════════════════════════════════════
//
// │ Level │ Color │ Best For │ Hold Time │ Stop Size │
// ├──────────┼────────┼─────────────────┼──────────────┼─────────────┤
// │ PDH/PDL │ 🟡 │ Scalps/Day │ Minutes-Hours│ Tight │
// │ PD2H/PD2L│ 🟣 │ Confluence │ Hours │ Medium │
// │ PWH/PWL │ 🔴 │ Swings │ Days-Weeks │ Wide │
//
// 🔥 GOLDEN RULE: Never fight the weekly level (red) - it's the boss!
//
// ═══════════════════════════════════════════════════════════════════════════════

Daily/Weekly FVG by KrisThis indicator is a Multi-Timeframe (MTF) tool designed to automatically identify and project Fair Value Gaps (Imbalances) from Daily and Weekly timeframes onto your current chart. It helps traders locate higher-timeframe Areas of Interest (POI) and liquidity voids without manually switching charts.
How it works:
The script utilizes `request.security` to fetch High and Low data from Daily and Weekly timeframes. It identifies a Fair Value Gap (FVG) based on the 3-candle formation logic where price moves inefficiently, leaving a gap between the wicks.
- Bullish FVG: Identified when the current Daily/Weekly Low is greater than the High of the candle from 2 periods ago.
- Bearish FVG: Identified when the current Daily/Weekly High is lower than the Low of the candle from 2 periods ago.
The indicator draws a box extending to the right to visualize the zone, along with a dotted midline which often acts as a sensitive support/resistance level.
Unique Feature: Smart Mitigation (Auto-Hide)
To keep your chart clean and focused on relevant data, the script includes a "Full Fill" logic. It continuously monitors price action relative to existing FVG boxes.
- If price completely crosses through a box (fully fills the gap), the indicator considers it "mitigated" and automatically hides the box and its midline (sets transparency to 100%).
- This ensures you only see "fresh" or unfilled gaps that are still relevant for trading.
Settings:
- TF Checkboxes (Daily/Weekly FVG): Toggle the visibility of Daily or Weekly gaps independently based on your analysis needs.
- Design Mode:
Colored: Uses classic Green (Bullish) and Red (Bearish) colors for easy trend identification.
Monochrome: Uses Gray tones for a minimalist look that reduces visual noise on the chart.
Usage:
Use these zones to identify potential reversal points or liquidity targets. Since these are higher-timeframe levels, they often carry more weight than intraday imbalances.

Bens Platypus Dual VWAP_Rolling 7D vs Weekly AnchoredBen’s Platypus Dual VWAP: Rolling 7D vs Weekly Anchored (optional σ bands)
Weekly-anchored VWAP resets on Monday (exchange time). That makes sense for assets tied to a traditional weekly “market open,” but BTC trades 24/7 and often doesn’t respect Monday as a real regime boundary—so the Monday reset can create a mechanical jump that looks like signal but is just arithmetic. If you drive entries/exits off that reset, some algos will get spooked into early entries, fake “stretch” readings, or sudden mean shifts that aren’t actually market behaviour.
This indicator fixes that by plotting:
• Rolling 7D VWAP (thick aqua): a continuous trailing VWAP that does not reset on Mondays, giving you a stable mean for reversion logic.
• Weekly Anchored VWAP (thin purple): kept for context, so you can see the reset effect rather than accidentally trade it.
Result: you can visually compare the two means and quantify when “weekly structure” is useful versus when it’s just a calendar artifact on a 24/7 market.

Pre-Market + Daily + Weekly REGULAR HOURS 📦 Pre-Market + Daily + Weekly RTH Range Boxes
This indicator automatically plots Pre-Market, Daily, and Weekly range boxes based strictly on US Regular Trading Hours (RTH).
What it does:
Pre-Market Box (04:00–09:30)
Captures the full pre-market high and low, then projects the range forward from the RTH open.
Daily RTH Box (09:30–16:00)
Tracks the previous day’s regular session high and low and plots the range starting at 04:00 AM the next day.
Weekly RTH Box (Mon–Fri, 09:30–16:00)
Accumulates the full weekly RTH range and plots it at 04:00 AM on Monday.

Daily/Weekly Swing Highs-Lows + Candle PatternsDescription
Daily/Weekly Swing Highs-Lows + Candle Patterns
This indicator plots the most recent Daily and Weekly Swing Highs and Lows (key support/resistance levels) using a simple and effective logic: a swing high/low is confirmed when the previous bar's extreme is higher/lower than both the current and the one before it.
Features:
• Daily Swing Highs/Lows (teal/maroon circles) – toggleable
• Weekly Swing Highs/Lows (blue/purple circles) – optional
• Visual separators for new daily and weekly bars (light background color)
• Daily candle pattern labels (optional):
- US = Up Swing (strong bullish continuation)
- DS = Down Swing (strong bearish continuation)
- IN = Inside Bar
- OUT = Outside Bar
• Daily close position labels (optional):
- P = Positive (close in upper 25% of the range)
- mP = minor Positive (50–75%)
- mN = minor Negative (25–50%)
- N = Negative (lower 25%)
All elements are fully customizable (colors, visibility) and work on any timeframe.
Best suited for intraday timeframes (1 min to 4 hours) where daily and weekly key levels provide important context for price action and reversals.
The optional "Trading session length" input is mainly useful for markets with shorter sessions (e.g., European indices) and does not affect swing detection.
Open-source, free to use and modify.
How to Use the Indicator + Practical Use Case
Key Settings (Inputs)
Trading session length (hours) → Default 8.5 h (useful for FTSEMIB, DAX, etc.). Leave it as is unless you trade a market with a different session length.
Daily Swing Levels → Show/Hide daily swing highs (teal) and lows (maroon).
Weekly Swing Levels → Usually keep off on intraday charts to avoid clutter (turn on for higher-timeframe context).
Daily Candle Patterns → Enable only if you want to see US/DS/IN/OUT labels on the daily close.
Close Position (P/mP/mN/N) → Enable if you want to quickly see how strong/weak the daily close was.
What You See on the Chart
Teal circles = Last confirmed daily swing high (resistance).
Maroon circles = Last confirmed daily swing low (support).
Blue/purple circles (if enabled) = Weekly swing high/low.
Light gray background = Start of a new trading day.
Purple background (if weekly enabled) = Start of a new week.
Small labels on daily close (if enabled):
- US = strong bullish day
- DS = strong bearish day
- IN = inside bar (consolidation)
- OUT = outside bar (expansion)
- P/mP/mN/N = how far the close was from the high/low of the day.
Best Timeframes 1 min to 240 min charts → Daily levels act as major support/resistance zones for intraday trading.
Avoid using on daily or higher charts (the logic is designed for intraday context).
Why this works well intraday:
The daily swing high/low levels are high-probability zones where institutions and algorithms often defend positions. On intraday charts, they act as “magnets” for price, giving you clean entries and exits with clear invalidation levels.
This indicator keeps your chart clean while providing exactly the context most intraday traders need: key daily levels + daily momentum context.

DAILY AND WEEKLY MID LINESDAILY AND WEEKLY MID LINES INDICATOR
Description:
This indicator calculates and visualizes the dynamic midpoint (mid) of the current day and week in real-time. It provides traders with key reference levels based on developing price action.
Features:
Daily Mid Line:
Color: Orange
Thickness: 3 pixels
Style: Solid line
Updates: Automatically recalculates with each new candle
Calculation: Average of the day's highest high and lowest low from market open
Weekly Mid Line:
Color: Blue
Thickness: 3 pixels
Style: Dashed line
Updates: Continuously recalculates throughout the week
Calculation: Average of the week's highest high and lowest low from week start
How It Works:
At the start of each new trading day (00:00), the daily mid line resets and begins calculating from the first candle
At the start of each new trading week (typically Monday), the weekly mid line resets and begins fresh calculations
Both lines extend automatically to the right as new candles form
The lines are dynamic - they adjust as new highs/lows are made during the day/week
Trading Applications:
Support/Resistance Levels:
The mid lines act as natural equilibrium points where price may find temporary support or resistance
Daily mid can serve as intraday pivot, weekly mid as broader market balance point
Trend Analysis:
Price consistently above mid lines suggests bullish momentum
Price consistently below mid lines suggests bearish momentum
Relationship between daily and weekly mid lines shows multi-timeframe alignment
Entry/Exit Signals:
Price crossing above daily mid may indicate short-term bullish momentum
Price crossing below daily mid may indicate short-term bearish momentum
Weekly mid breaks can signal more significant trend changes
Market Context:
Distance between price and mid lines indicates market extremity
Steeper mid line slopes suggest stronger directional momentum
Flat mid lines suggest range-bound or consolidating markets
Confluence Trading:
Combine with other indicators (RSI, MACD, moving averages) for confirmation
Use as dynamic levels for stop-loss placement or take-profit targets
Best Practices:
More effective on higher timeframes (1H, 4H, Daily) for clearer signals
Works well in trending markets where mid lines act as moving support/resistance
Monitor for price rejection or acceptance at mid levels for trading decisions
Use in conjunction with volume analysis for confirmation
Psychological Significance:
Mid points often represent fair value areas where buyers and sellers find temporary equilibrium, making them natural decision points for market participants.
This indicator is particularly useful for day traders, swing traders, and position traders looking for dynamic, real-time reference points that adapt to current market conditions rather than relying on static historical levels.

Strict Weekly 50/200 WMA Signals True Weekly Only-Strict Weekly 50/200 WMA Signals True Weekly Only => also on other time frames than weekly (like daily, etc.) always indicates the indicators based on the weekly chart
-especially useful for Crypto
-gives buy and sell signals when the 200 WMA or the 50 WMA are crossed
-typically above the 50 WMA indicates a bull market
-reaching below the 200 WMA indicates a bear market and typically for investors with a longer time frame (>2-4 years) a good entry point

Custom Weekly WED→TUEPurpose:
This indicator creates custom weekly candles with a week boundary running from Wednesday to Tuesday (WED→TUE) for any symbol. It is designed for systems that prefer to close the trading week on Tuesday’s session instead of the standard weekend.
Custom Candle Logic (WED→TUE):
• Open = Opening price on Wednesday (start of the custom week).
• Close = Closing price on Tuesday (end of the custom week).
• High/Low = Maximum/minimum during the entire range from Wednesday → Tuesday.
Display Behavior:
• Only renders when the chart timeframe = 1W (Weekly).
• Completed weeks (with full Wed→Tue data) are shown as candlesticks (colored up/down based on O/C).
• The current incomplete week is shown as a preview box shifted to the next weekly slot (the column to the right), allowing you to see the progress of the ongoing week while keeping the last completed week intact.
Inputs:
• Start day (1=Mon…7=Sun) — default is 3 = Wednesday. You can change this to redefine the week boundary.
• Show current (incomplete) custom week — toggles the preview box for the current running week.
• Up/Down/Doji color — defines the colors of completed weekly candles.
• Preview box transparency — controls the opacity of the preview box for the ongoing week.

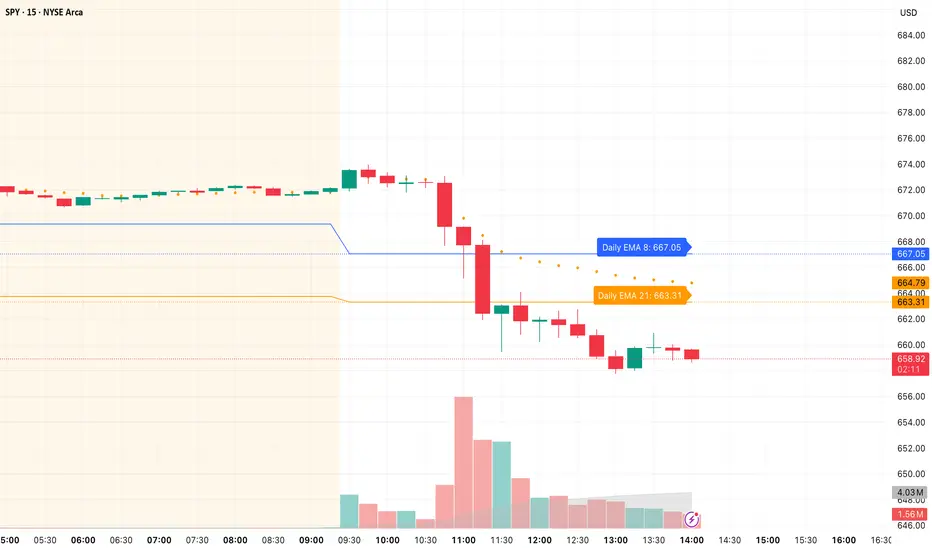
Daily/Weekly EMAs on Lower TimeframesThis indicator allows traders to view Daily and Weekly EMAs (Exponential Moving Averages) directly on lower timeframes such as 1m, 5m, 15m, or 1h charts — providing a higher timeframe perspective without switching charts.
The script includes individual checkboxes for each EMA length — 5, 8, 9, 21, 50, and 200 — organized into two clear sections:
🟢 Daily EMAs
🔵 Weekly EMAs
You can selectively enable or disable any EMA to match your trading style and reduce chart clutter.
Each EMA is color-coded for clarity and consistency:
5 EMA: Green
8 EMA: Blue
9 EMA: Blue
21 EMA: Orange
50 EMA: Purple
200 EMA: Red
Weekly EMAs appear slightly transparent to distinguish them from daily ones.
This makes it easy to visualize higher timeframe trend direction, confluence zones, and dynamic support/resistance levels while trading intraday.
💡 Key Features
View Daily and Weekly EMAs on smaller timeframes.
Individual checkbox toggles for all 6 EMA lengths.
Separate sections for Daily and Weekly EMAs.
Color-coded lines for easy visual recognition.
Works seamlessly on any symbol or timeframe below Daily.
Pattern Match & Forward Projection – Weekly (EN)
Overview
This indicator searches for recurring price patterns in weekly data and projects their average forward performance.
The logic is based on historical pattern repetition: it scans past price sequences similar to the most recent one, then aggregates their forward returns to estimate potential outcomes.
⚠️ Important: The indicator is designed for weekly timeframe only. Using it on daily or intraday charts will trigger an error message.
Settings (Inputs)
Pattern Settings
Pattern length (weeks): Number of weeks used to define the reference pattern.
Forward length (weeks): Number of weeks into the future to evaluate after each pattern match.
Lookback (weeks): Historical window to scan for past pattern matches.
Normalize by shape (z-score): If enabled, patterns are normalized by z-score, focusing on shape similarity rather than absolute values.
Distance threshold (Euclidean): Maximum allowed Euclidean distance between the reference pattern and historical candidates. Smaller values = stricter matching.
Min. required matches: Minimum number of valid matches needed for analysis.
Quality Filters
Min required Hit%: Minimum percentage of positive outcomes (upside forward returns) required for the pattern to be considered valid.
Return filter mode:
Either: absolute average return ≥ threshold
Long only: average return ≥ threshold
Short only: average return ≤ -threshold
Min avg return (%): Minimum average forward return threshold for validation.
Visual Options
Highlight historical matches (labels): Marks where in history similar patterns occurred.
Max match labels to draw: Caps the number of match markers shown to avoid clutter.
Draw average projection: Displays the average projected forward curve if conditions are met.
Show summary panel: Enables/disables the information panel.
Show weekly avg curve in panel: Adds a breakdown of average returns week by week.
Projection color: Choose the color of the projected forward curve.
What the Screen Shows
Summary Panel (top-left by default)
Total matches found in history
Matches with valid forward data
Average, minimum, and maximum distance (similarity measure)
Average forward return and Hit%
Distance threshold and normalization setting
Weekly average forward curve (if enabled)
Quality filter results (pass/fail)
Projection Curve (dotted line on price chart)
Drawn only if enough valid matches are found and filters are satisfied
Represents the average forward performance of historical matches, anchored at the current bar
Historical Match Labels (▲ markers)
Small arrows below past bars where similar patterns occurred
Tooltip: “Historical match”
Forecast Logic
The indicator does not predict the future in a deterministic way.
Instead, it relies on a pattern-matching algorithm:
The most recent N weeks (defined by Pattern length) are taken as the reference.
The algorithm scans the last Lookback (weeks) for segments with similar shape and magnitude.
Similarity is measured using Euclidean distance (optionally z-score normalized).
For each valid match, the subsequent Forward length weeks are collected.
These forward paths are averaged to generate a composite forward projection.
The summary panel reports whether the current setup passes the quality filters (Hit% and minimum average return).
Usage Notes
Best used as a contextual tool, not a standalone trading system.
Works only on weekly timeframe.
Quality filters help distinguish between noisy and statistically meaningful patterns.
A higher number of matches usually improves reliability, but very strict thresholds may reduce sample size.
📊 This tool is useful for traders who want to evaluate how similar historical setups have behaved and to visualize potential forward paths in a statistically aggregated way.

Daily/Weekly Wick (Shadow) Range📈 Detailed Guide to the Daily/Weekly Wick (Shadow) Range Indicator
This indicator is a powerful visualization tool designed to map the key price levels established during the previous trading period (either the previous day or the previous week). Instead of just showing a single line for the high and low, it highlights the entire range of the upper and lower wicks (shadows), representing the "battleground" where buyers and sellers were most active.
How It Works
The Wick (Shadow) Range indicator fetches the Open, High, Low, and Close data from the last completed daily or weekly candle and projects those levels onto your current chart. This creates two distinct colored zones.
Upper Wick (Green Zone): This area spans from the Previous High down to the top of the Previous Candle's Body. It visually represents the territory where sellers successfully pushed the price down from its peak. This entire zone can be considered a resistance area.
Lower Wick (Red Zone): This area spans from the bottom of the Previous Candle's Body down to the Previous Low. It shows where buyers stepped in to defend a price level and push it back up. This entire zone can be considered a support area.
How to Use It in Your Trading
This indicator isn't meant to give direct buy or sell signals on its own. Instead, it provides crucial context about market structure. Here are several ways to incorporate it into your strategy:
1. Identifying Key Support & Resistance
This is the indicator's primary function. The most significant levels are:
Key Resistance: The top edge of the green zone (the previous period's high).
Key Support: The bottom edge of the red zone (the previous period's low).
Look for the current price to react when it approaches these boundaries. These are high-probability areas for price to pause or reverse.
2. Watching for Price Rejection (Reversal Trading)
The colored zones are perfect for spotting rejection signals.
Bearish Rejection 📉: If the current price enters the green zone but fails to stay there, closing back below it (often forming a new wick), it's a strong sign that sellers are still in control at that level. This can be an excellent entry signal for a short position.
Bullish Rejection 📈: If the current price dips into the red zone and is quickly bought back up, it shows that buyers are actively defending that area. This can be a great entry signal for a long position.
3. Confirming Breakouts (Trend Trading)
The zones also help validate breakouts.
Bullish Breakout: If the price pushes decisively through the entire green zone and closes above the previous high, it signals that the previous resistance has been broken and the trend may continue upward.
Bearish Breakdown: If the price falls decisively through the entire red zone and closes below the previous low, it confirms that support has failed and the price may continue downward.
4. Setting Context with Timeframes
Weekly Setting: Use the "Weekly" option to identify major, significant support and resistance levels that can influence the market for the entire week. These are powerful levels for swing trading.
Daily Setting: Use the "Daily" option for intraday trading. The previous day's high and low are critical pivot points that many day traders watch.
⚙️ Indicator Settings
The indicator has one simple setting, which you can access by clicking the gear icon ⚙️ next to its name on the chart.
Select Wick Timeframe: This dropdown menu allows you to switch the indicator's calculation between the Daily and Weekly timeframe instantly.

Key Levels: Daily, Weekly, Monthly [BackQuant]Key Levels: Daily, Weekly, Monthly
Map the market’s “memory” in one glance—yesterday’s range, this week’s chosen day high/low, and D/W/M opens—then auto-clean levels once they break.
What it does
This tool plots three families of high-signal reference lines and keeps them tidy as price evolves:
Chosen Day High/Low (per week) — Pick a weekday (e.g., Monday). For each past week, the script records that day’s session high and low and projects them forward for a configurable number of bars. These act like “memory levels” that price often revisits.
Daily / Weekly / Monthly Opens — Plots the opening price of each new day, week, and month with separate styling. These opens frequently behave like magnets/flip lines intraday and anchors for regime on higher timeframes.
Auto-pruning — When price breaks a stored level, the script can automatically remove it to reduce clutter and refocus you on still-active lines. See: (broken levels removed).
Why these levels matter
Liquidity pockets — Prior day’s high/low and the daily open concentrate stops and pending orders. Mapping them quickly reveals likely sweep or fade zones. Example: previous day highs + daily open highlighting liquidity:
Context & regime — Monthly opens frame macro bias; trading above a rising cluster of monthly opens vs. below gives a clean top-down read. Example: monthly-only “macro outlook” view:
Cleaner charts — Auto-remove broken lines so you focus on what still matters right now.
What it plots (at a glance)
Past Chosen Day High/Low for up to N prior weeks (your choice), extended right.
Current Daily Open , Weekly Open , and Monthly Open , each with its own color, label, and forward extension.
Optional short labels (e.g., “Mon High”) or full labels (with week/month info).
How breaks are detected & cleaned
You control both the evidence and the timing of a “break”:
Break uses — Choose Close (more conservative) or Wick (more sensitive).
Inclusive? — If enabled, equality counts (≥ high or ≤ low). If disabled, you need a strict cross.
Allow intraday breaks? — If on, a level can break during the tracked day; if off, the script only counts breaks after the session completes.
Remove Broken Levels — When a break is confirmed, the line/label is deleted automatically. (See the demo: )
Quick start
Pick a Day of Week to Track (e.g., Monday).
Set how many weeks back to show (e.g., 8–10).
Choose how far to extend each family (bars to the right for chosen-day H/L and D/W/M opens).
Decide if a break uses Close or Wick , and whether equality counts.
Toggle Remove Broken Levels to keep the chart clean automatically.
Tips by use-case
Intraday bias — Watch the Daily Open as a magnet/flip. If price gaps above and holds, pullbacks to the daily open often decide direction. Pair with last day’s high/low for sweep→reversal or true breakout cues. See:
Weekly structure — Track the week’s chosen day (e.g., Monday) high/low across prior weeks. If price stalls near a cluster of old “Monday Highs,” look for sweep/reject patterns or continuation on reclaim.
Macro regime — Hide daily/weekly lines and keep only Monthly Opens to read bigger cycles at a glance (BTC/crypto especially). Example:
Customization
Use wicks or bodies for highs/lows (wicks capture extremes; bodies are stricter).
Line style & thickness — solid/dashed/dotted, width 1–5, plus global transparency.
Labels — Abbreviated (“Mon High”, “D Open”) or full (month/week/day info).
Color scheme — Separate colors for highs, lows, and each of D/W/M opens.
Capacity controls — Set how many daily/weekly/monthly opens and how many weeks of chosen-day H/L to keep visible.
What’s under the hood
On your selected weekday, the script records that session’s true high and true low (using wicks or body-based extremes—your choice), then projects a horizontal line forward for the next bars.
At each new day/week/month , it records the opening price and projects that line forward as well.
Each bar, the script checks your “break” rules; once broken, lines/labels are removed if auto-cleaning is on.
Everything updates in real time; past levels don’t repaint after the session finishes.
Recommended presets
Day trading — Weeks back: 6–10; extend D/W opens: 50–100 bars; Break uses: Close ; Inclusive: off; Auto-remove: on.
Swing — Fewer daily opens, more weekly opens (2–6), and 8–12 weeks of chosen-day H/L.
Macro — Show only Monthly Opens (1–6 months), dashed style, thicker lines for clarity.
Reading the examples
Broken lines disappear — decluttering in action:
Macro outlook — monthly opens as cycle rails:
Liquidity map — previous day highs + daily open:
Final note
These are not “signals”—they’re reference points that many participants watch. By standardising how you draw them and automatically clearing the ones that no longer matter, you turn a noisy chart into a focused map: where liquidity likely sits, where price memory lives, and which lines are still in play.

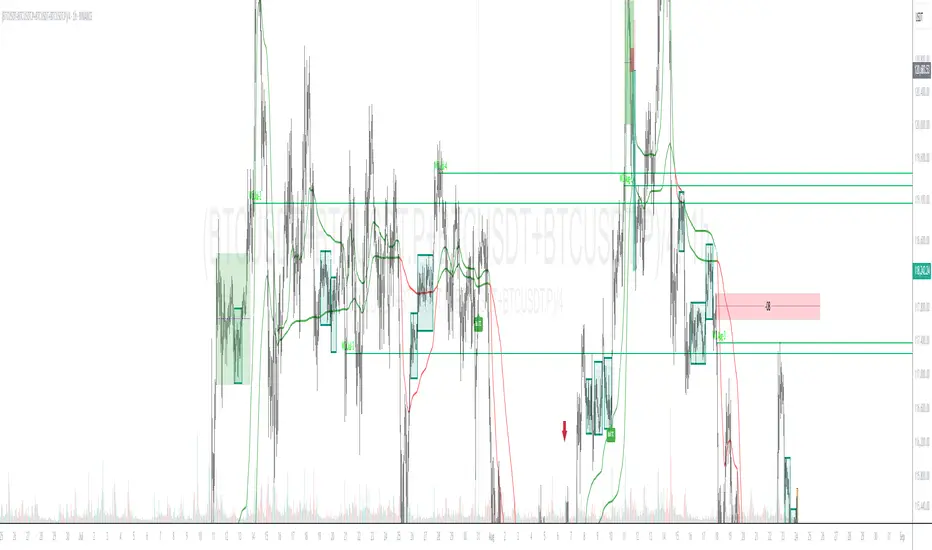
Spiderlines BTCUSD - daily/weekly📘 Documentation – Daily and Weekly Spider Lines for Bitcoin
🔹 Purpose of the Script
This script draws dynamic “Spider Lines” in the Bitcoin chart.
The lines connect certain historical candles with a reference candle and extend to the right.
These act as guideline levels that can serve as potential support or resistance zones.
🔹 How It Works
The script operates in two modes, depending on the active chart timeframe:
Weekly Mode (timeframe.isweekly)
The reference date is July 1, 2019.
The number of weeks since that date is calculated.
This defines the connection candle (connection_candle).
Several predefined offsets (e.g., +32, +34, +36 …) are added to the reference to determine starting candles.
Lines are drawn from these candles toward the connection candle.
→ Line color: green
Daily Mode (timeframe.isdaily)
Same reference date: July 1, 2019.
The number of days since that date is calculated.
Again, a connection candle is set.
A different set of offsets (e.g., +224, +238, +252 …) defines the starting candles.
Lines are drawn accordingly.
→ Line color: red
🔹 Line Logic
Each line connects:
Start → bar_index at high
End → bar_index at close
Lines are extended indefinitely to the right (extend.right).
Appearance: dashed style, width 2.
🔹 Error Handling
If a calculated candle index does not exist in the chart history (e.g., chart data does not go back far enough),
a label is plotted in the chart showing the message:
"Daily idx out of range: 252"
This way, missing lines can be diagnosed easily.
🔹 Color Convention
Weekly Spider Lines → Green
Daily Spider Lines → Red
🔹 Use Cases
Visualization of historical cyclic line patterns.
Helps in technical chart analysis: spotting potential reaction zones in price movement.
Designed mainly for long-term traders and analysts observing Bitcoin in Daily or Weekly timeframes.
🔹 Limitations
Works only on Daily and Weekly charts.
Requires chart data going back to July 1, 2019.
Based purely on fixed offsets → not a classical indicator like Moving Averages or RSI.

DCA Anchor (Weekly/Monthly/N Bars) [CHE] What is Dollar-Cost Averaging (DCA)?
DCA is a position-building method where you invest a fixed amount at fixed intervals (e.g., weekly or monthly) regardless of price. Over time, this:
reduces timing risk (you don’t need to guess tops/bottoms),
smooths entry price by buying more units when price is low and fewer when price is high,
keeps decisions simple and repeatable.
Trade-offs:
You’ll never catch the exact bottom.
In strong uptrends, lump-sum can outperform.
Fees matter if you buy very frequently.
Simple math:
Qty bought at time t = `amount / price_t` (net of fees if fees are not “on top”).
Total qty = sum of all buys.
Average price (cost basis) = `total invested / total qty`.
Equity = `total qty last price`.
P\&L = `equity − total invested` (and `%` = `P&L / total invested`).
DCA Anchor (Weekly/Monthly/N Bars)
Purpose: automate scheduled DCA buys on chart data, optionally add extra buys on drawdowns, track stats, and fire alerts.
Core features
Schedules:
1. Every N bars,
2. Weekly (first bar of a new week),
3. Monthly (first bar of a new month).
A Start time input gates when the logic begins.
Fees model:
Fee on top: you pay `amount + fee` in cash; quantity = `amount / close`.
Fee from amount: fee is deducted from the amount; quantity is smaller, cash outlay equals `amount`.
Optional drawdown buys:
Trigger when `close ≤ avgCost (1 − ddPct/100)`.
Controls: drawdown % threshold, multiplier (extra size vs. base amount), and cooldown in bars.
State & metrics: tracks total invested, total quantity, average price, equity, P\&L (abs/%).
Visuals:
Line plot of Average Price.
Buy labels at execution bars (plan and drawdown).
Compact table (positionable) with key stats (trades, invested, qty, avg price, equity, P\&L).
Alerts:
Plan Buy (Bar Close) and Drawdown Buy (Bar Close) — robust, non-repainting.
Optional Intrabar Preview alerts for early heads-up (can fire before bar close).
How to use it (quick start)
1. Add to chart → Inputs:
Buy frequency: pick Every N bars, Weekly, or Monthly.
Start time: date from which buys may begin.
Buy amount: fixed cash per planned buy.
Fees % and Fee on top? to match your broker/exchange model.
(Optional) Enable drawdown buy, set threshold %, multiplier, and cooldown.
Toggle Show buy labels and Show stats table.
2. Alerts (recommended):
Use “DCA Plan Buy (Bar Close)” and/or “DCA Drawdown Buy (Bar Close)” with Once per bar close.
If you need early signals, enable Intrabar pre-alerts and add the two Intrabar Preview alerts with Once per bar.
3. Interpretation:
The yellow line is your average price.
Green/orange markers show plan buys and drawdown buys.
The table summarizes total trades, invested capital, quantity, average price, current equity, and P\&L.
Practical notes
All executions occur at bar close by default to avoid intrabar repainting.
Weekly/monthly roll depends on the symbol’s exchange calendar.
Backtest realism: no slippage, no partial fills. Fees are modeled as configured.
If you buy very frequently, consider higher “N” or weekly/monthly to keep fees under control.
If you want, I can tailor the defaults (amount, fee model, drawdown rules) to your typical markets and timeframes.
Disclaimer
No indicator guarantees profits. DCA Anchor (Weekly/Monthly/N Bars) is a decision aid; always combine with solid risk management and your own judgment. Backtest, forward test, and size responsibly.
The content provided, including all code and materials, is strictly for educational and informational purposes only. It is not intended as, and should not be interpreted as, financial advice, a recommendation to buy or sell any financial instrument, or an offer of any financial product or service. All strategies, tools, and examples discussed are provided for illustrative purposes to demonstrate coding techniques and the functionality of Pine Script within a trading context.
Any results from strategies or tools provided are hypothetical, and past performance is not indicative of future results. Trading and investing involve high risk, including the potential loss of principal, and may not be suitable for all individuals. Before making any trading decisions, please consult with a qualified financial professional to understand the risks involved.
By using this script, you acknowledge and agree that any trading decisions are made solely at your discretion and risk.
Enhance your trading precision and confidence 🚀
Best regards
Chervolino

Emre AOI Zonen Daily & Weekly (mit Alerts, max 60 Pips)This TradingView indicator automatically highlights Areas of Interest (AOI) for Forex or other markets on Daily and Weekly timeframes. It identifies zones based on the high and low of the previous period, but only includes zones with a width of 60 pips or less.
Features:
Daily AOI Zones in blue, Weekly AOI Zones in yellow with 20% opacity, so candlesticks remain visible.
Persistent zones: AOI boxes stay on the chart until the price breaks the zone.
Multiple zones: Supports storing multiple Daily and Weekly AOIs simultaneously.
Break Alerts: Sends alerts whenever a Daily or Weekly AOI is broken, helping traders spot key levels in real-time.
Fully automated: No manual drawing needed; zones are updated and extended automatically.
Use Case:
Ideal for traders using a top-down approach, combining Weekly trend analysis with Daily entry signals. Helps identify support/resistance, supply/demand zones, and critical price levels efficiently.

All Weekly Opens + Week LabelThis script plots every Weekly Open (WO) across the entire chart, making it easy for traders to backtest how price reacts to weekly opens historically.
Each weekly open is drawn as a horizontal line and labeled with the month abbreviation and the week number of that month (e.g., WO Aug-4). This allows traders to quickly identify where each weekly session started and analyze market behavior around these key reference levels.
How it works
The script detects the first bar of each new week and records its opening price.
A horizontal line is drawn at that price, extending to the right.
An optional label shows the week name in the format Month-WeekNumber.
Traders can enable or disable labels, change line colors, line width, and optionally display the opening price in the label.
A new input allows filtering to show only the last N months of Weekly Opens. By default, all weekly opens are displayed, but traders can limit the chart to just the most recent ones for a cleaner view.
Why it’s useful
Weekly opens are often respected levels in both intraday and swing trading. They provide natural reference points for:
Backtesting market reactions to session opens.
Identifying areas of support/resistance around weekly levels.
Aligning trade entries and exits with higher-timeframe context.
Simplifying charts by focusing only on the most relevant recent weeks.
Notes
This indicator is not a trading signal generator.
It should be used as a contextual tool for analysis, helping traders improve risk management and entry precision.
Works on all symbols and timeframes.
The “last N months” filter is optional; setting it to 0 will plot all Weekly Opens available in the chart’s history.
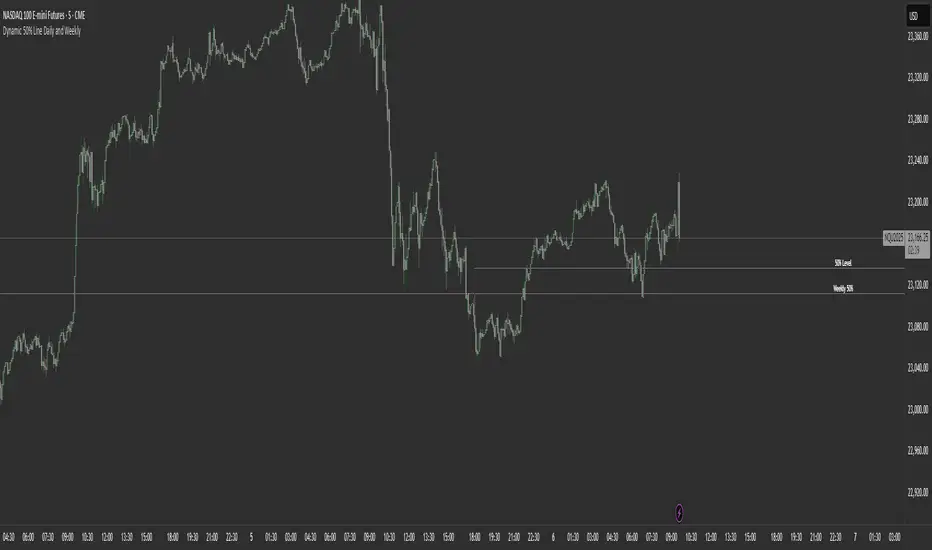
Dynamic 50% Line [Daily and Weekly Range]This indicator automatically plots the 50% retracement level (midpoint) of the daily and weekly trading ranges. It helps traders identify key support/resistance zones where price may react, offering insights into potential reversal or continuation areas.
Auction Market Theory & the 50% Level
At its core, this indicator is built on Auction Market Theory (AMT), which views price movement as an ongoing auction process where buyers and sellers compete to establish value. The 50% midpoint represents fair value—the equilibrium where price is most likely to balance before continuing its trend or reversing.
When price deviates too far from this level, it often returns to balance (mean reversion) or accepts new value (breakout). By tracking the daily and weekly 50% lines, traders can:
Identify high-probability reversal zones (where price may reject fair value).
Spot trend continuation areas (where price accepts higher/lower value).
Align with institutional order flow, as large players often use these levels for execution.
This makes the indicator particularly powerful for traders who follow volume profile, order flow, or ICT concepts, as it visually maps the market’s ongoing auction process.
Features:
✅ Automated Daily & Weekly Midpoints – Calculates the 50% level from the high/low of each session.
✅ Customizable Line Styles – Choose between solid, dotted, or dashed lines for better visibility.
✅ Clear Labeling – Optional text labels show "50% Level" or custom text at your preferred position (left, middle, or right).
✅ Flexible Styling – Adjust line colors, thickness, and text size to match your chart theme.
How It Works:
Daily 50% Line: Resets at 6 PM NY time (new trading day).
Weekly 50% Line: Resets on Sunday at 6 PM NY time (new trading week).
The midpoint is calculated as:
(High + Low) / 2
Lines extend 500 bars forward for easy visibility.
Why Use This Indicator?
Unlike static Fibonacci tools, this dynamic indicator auto-updates the 50% level as new highs/lows form, saving time and improving accuracy. Whether you trade forex, stocks, or crypto, these levels often act as strong magnets for price action.
Previous VWAP Levels by Riotwolftrading The "Previous VWAP" indicator calculates and displays the previous session's Volume Weighted Average Price (VWAP) for five timeframes (Daily, Weekly, Monthly, Quarterly, Yearly).
Each VWAP is plotted as a horizontal line extending to the right edge of the chart, with customizable labels at the right to identify each level. The indicator is designed for traders who want to visualize key price levels from prior periods without cluttering the chart with current VWAPs or additional metrics like standard deviations.
**Functionality**:
- **Calculates Previous VWAPs**: Computes the VWAP for the previous session of each timeframe (Daily, Weekly, Monthly, Quarterly, Yearly) based on the input source (default: `hlc3`) and volume.
- **Visual Style** : Uses `line.new` to draw horizontal lines from five bars back to the current bar, ensuring the lines extend to the right edge of the chart. Labels are placed at the right edge using `label.new` for clear identification.
- **Customization** : Allows users to toggle visibility, adjust line styles, widths, colors, and label sizes, and choose between abbreviated or full label text.
- **Minimalist Design**: Focuses solely on previous VWAPs, omitting current VWAPs, rolling VWAPs, and standard deviation bands to keep the chart clean.
**Intended Use**: This indicator is useful for traders who rely on historical VWAP levels as support/resistance or reference points for trading decisions, particularly in strategies involving mean reversion or breakout trading.
---
### Rules and Features
*VWAP Calculation**:
- The VWAP is calculated as the cumulative sum of price (`src`) multiplied by volume (`sumSrcVol`) divided by the cumulative volume (`sumVol`) for each timeframe.
- The "previous VWAP" is the VWAP value from the prior session, captured when a new session begins (e.g., new day, week, month, etc.).
- The indicator uses the `hlc3` (average of high, low, close) as the default source, but users can modify this in the settings.
**Timeframes**:
- **Daily**: Previous day's VWAP.
- **Weekly**: Previous week's VWAP.
- **Monthly**: Previous month's VWAP.
- **Quarterly**: Previous quarter's VWAP (3 months).
- **Yearly**: Previous year's VWAP (12 months).
- New sessions are detected using `ta.change(time(period))` for each timeframe.
**Line Drawing**:
- Lines are drawn using `line.new` from `time ` (five bars back) to the current bar (`time`), ensuring they extend to the right edge of the chart.
- Lines are updated only on the last confirmed bar (`barstate.islast`) to optimize performance and avoid repainting.
- Previous lines are deleted (`line.delete`) to prevent overlapping or clutter.
**Labels**:
- Labels are drawn at the right edge (`x=time`, `xloc=xloc.bar_time`) with `label.new`.
- Users can choose between abbreviated labels (e.g., "pvD" for Previous Daily VWAP) or full labels (e.g., "Prev Daily VWAP").
- Label sizes are customizable (`tiny`, `small`, `normal`, `large`, `huge`).
- Labels are deleted (`label.delete`) on each update to maintain a clean chart.
5. **Customization Options**:
- **Visibility**: Toggle each VWAP (Daily, Weekly, Monthly, Quarterly, Yearly) on or off.
- **Colors**: Individual color settings for each VWAP line and label (default colors: Daily=#E12D7B, Weekly=#F67B52, Monthly=#EDCD3B, Quarterly=#3BBC54, Yearly=#2665BD).
- **Line Style**: Choose from `solid`, `dotted`, or `dashed` lines.
- **Line Width**: Adjustable from 1 to 4 pixels.
- **Label Settings**: Enable/disable labels, abbreviate text, and select label size.
- **Source**: Customize the price source (default: `hlc3`).
**Performance Optimization**:
- The indicator only updates lines and labels on the last confirmed bar to minimize computational overhead.
- Uses `var` to initialize variables and avoid unnecessary recalculations.
- Deletes previous lines and labels to prevent chart clutter.
---
### Usage Instructions
1. **Add to Chart**:
- In TradingView, go to the Pine Editor, paste the script, and click "Add to Chart."
- The indicator will overlay on the price chart, showing previous VWAP lines and labels.
2. **Configure Settings**:
- Open the indicator settings to customize:
- Toggle visibility of each VWAP timeframe.
- Adjust colors, line style, and width.
- Enable/disable labels, choose abbreviation, and set label size.
- Modify the source if needed (e.g., use `close` instead of `hlc3`).
3. **Interpretation**:
- **Previous VWAPs**: Act as dynamic support/resistance levels based on the prior session's volume-weighted price.
- **Timeframes**: Use shorter timeframes (Daily, Weekly) for intraday/swing trading, and longer timeframes (Monthly, Quarterly, Yearly) for positional trading.
- **Labels**: Identify each VWAP level at the right edge of the chart for quick reference.
4. **Best Practices**:
- Use on charts with sufficient volume data, as VWAP relies on volume (a warning is triggered if no volume data is available).
- Combine with other indicators (e.g., moving averages, RSI) for confirmation in trading strategies.
- Adjust line styles and colors to avoid visual overlap with other chart elements.
---
### Example Use Case
A trader using a 1-hour chart can add the "Previous VWAP" indicator to identify key levels from the prior day, week, or month. For example:
- The Previous Daily VWAP might act as a support level for a bullish trend.
- The Previous Weekly VWAP could serve as a target for a swing trade.
- Labels at the right edge make it easy to identify these levels without cluttering the chart.
This indicator provides a clean, customizable way to visualize previous VWAPs, making it ideal for traders who want historical price context with minimal chart noise. For the complete Pine Script code, refer to the artifact provided in the previous response.

Daily & Weekly False-Breakout DetectorDaily & Weekly Lines
We retrieve previous day/week’s High and Low.
lookahead=barmerge.lookahead_on means we see the “final” daily/weekly bar values intraday, so it may repaint in real‐time.
False Breakout Logic
Intraday crosses of close above the previous high (PDH or PWH).
By the end of the daily/weekly bar, close is back below that high.
Similarly for false breakdowns below PDL or PWL.
Shape/Alert
Each time an intraday bar crosses up or down, if the final daily/weekly close reverts back inside the prior range, a label is drawn and an alert is triggered.
Because we are “peeking” at the daily/weekly close, these signals can appear or disappear in real‐time.
If you only want a confirmed signal after the period’s close, switch to lookahead_off, which will finalize them at the next day or next week.

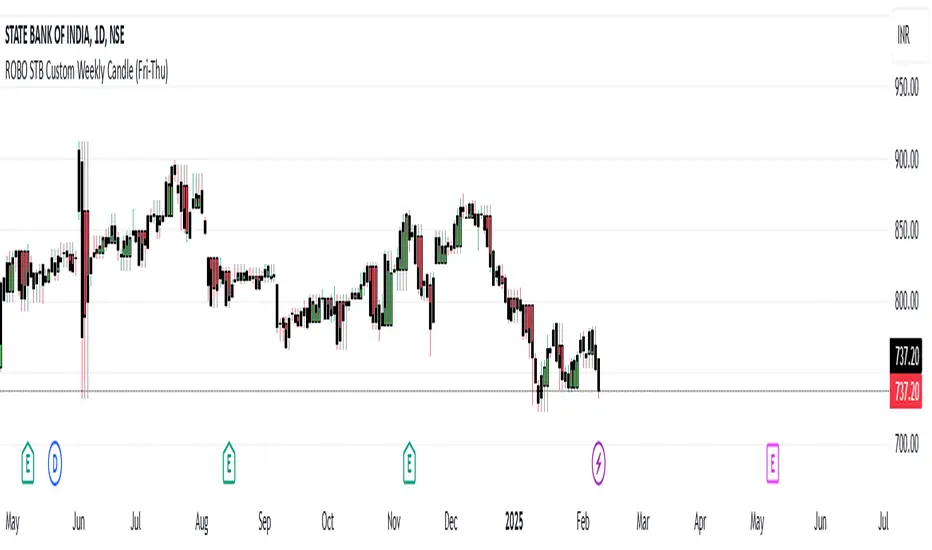
ROBO STB Custom Weekly Candle (Fri-Thu)Description:
This indicator creates custom weekly candles that start on Friday and end on Thursday, instead of the standard Monday–Friday weekly structure in TradingView. It aggregates the open, high, low, and close (OHLC) values from Friday to Thursday and displays them as candlesticks on the chart.
Features:
✅ Custom weekly candles from Friday to Thursday
✅ Dynamic calculation of open, high, low, and close
✅ Works on any timeframe
✅ Helps traders analyze market structure differently
How It Works:
Identifies the custom weekly session based on Friday's start and Thursday's end.
Aggregates OHLC values within this time range.
Resets the values when a new custom week begins.
Plots the calculated weekly candles on the chart.
Use Case:
This indicator is useful for traders who prefer to analyze weekly price movements based on a non-standard start and end day, especially those focusing on forex, crypto, or commodities where trading hours differ.
Notes:
This script does not modify existing candles but overlays new custom weekly candles on the chart.
It does not repaint and updates in real-time.
If you find this useful, like and share! 🚀